INLINING 3D RECONSTRUCTION, MULTI-SOURCE TEXTURE MAPPING AND
SEMANTIC ANALYSIS USING OBLIQUE AERIAL IMAGERY
D. Frommholz, M. Linkiewicz, A. M. Poznanska
DLR Institute of Optical Sensor Systems, Berlin, Germany -(dirk.frommholz, magdalena.linkiewicz, anna-maria.poznanska)@dlr.de
Commission III, WG III/4
KEY WORDS:Aerial, Oblique, Reconstruction, Texture Mapping, Classification, Rendering, CityGML
ABSTRACT:
This paper proposes an in-line method for the simplified reconstruction of city buildings from nadir and oblique aerial images that at the same time are being used for multi-source texture mapping with minimal resampling. Further, the resulting unrectified texture atlases are analyzed for fac¸ade elements like windows to be reintegrated into the original 3D models. Tests on real-world data of Heli-goland/Germany comprising more than 800 buildings exposed a median positional deviation of 0.31 m at the fac¸ades compared to the cadastral map, a correctness of 67% for the detected windows and good visual quality when being rendered with GPU-based perspective correction. As part of the process building reconstruction takes the oriented input images and transforms them into dense point clouds by semi-global matching (SGM). The point sets undergo local RANSAC-based regression and topology analysis to detect adjacent planar surfaces and determine their semantics. Based on this information the roof, wall and ground surfaces found get intersected and limited in their extension to form a closed 3D building hull. For texture mapping the hull polygons are projected into each possible input bitmap to find suitable color sources regarding the coverage and resolution. Occlusions are detected by ray-casting a full-scale digital surface model (DSM) of the scene and stored in pixel-precise visibility maps. These maps are used to derive overlap statistics and radiometric adjustment coefficients to be applied when the visible image parts for each building polygon are being copied into a compact texture atlas without resampling whenever possible. The atlas bitmap is passed to a commercial object-based image analysis (OBIA) tool running a custom rule set to identify windows on the contained fac¸ade patches. Following multi-resolution segmentation and classification based on brightness and contrast differences potential window objects are evaluated against geometric constraints and conditionally grown, fused and filtered morphologically. The output polygons are vectorized and reintegrated into the previously reconstructed buildings by sparsely ray-tracing their vertices. Finally the enhanced 3D models get stored as textured geometry for visualization and semantically annotated ”LOD-2.5” CityGML objects for GIS applications.
1. INTRODUCTION
With the increasing market availability oblique aerial cameras are about to become a standard tool for remote sensing tasks particu-larly in urban areas. In addition to solely nadir-looking sensors these devices are equipped with one or more camera modules in different configurations providing tilted (off-nadir) views of the scene (Remondino and Gehrke, 2015). This allows to record high-resolution images of the fac¸ades of buildings since the in-cidence angles between the merely orthogonal surfaces and the viewing vectors converge increasing the achievable resolution.
This capability qualifies oblique cameras for texturing virtual city models. If the interior and exterior orientation of the images cap-tured is known they can be accurately mapped on existing 3D data sets. The work of (Smith et al., 2009) demonstrates the projection of unrectified nadir and oblique images from different sensors onto triangular meshes addressing visibility issues due to shadow and in urban quadrangles, however, occlusions do not get handled yet. This differs from (Stilla et al., 2009) where hidden objects are detected using a z-buffer approach. Also, the airborne IR data used for the decoration of the model faces gets rectified in an offline processing step. Similarly (Frueh et al., 2004) project oblique aerial bitmaps onto triangular meshes of city buildings generated from a terrestrial laser scanner. Appropriate source im-ages are selected per face based on the viewing angle, spatial coherence and occlusion which again is detected by a z-buffer algorithm omitting objects not contained in the mesh. The re-sulting texture patches are compactly organized in a texture at-las, however, without combining multiple images from different
views to possibly color hidden object parts. Aside from texture mapping 3D building reconstruction from aerial images involv-ing parametric shapes, point cloud segmentation or the simplifi-cation of digital surface models (DSMs) has become popular as summarized in (Haala and Kada, 2010) but few approaches ex-plicitly exploit oblique data so far. In (Haala et al., 2015) an op-timized dense semi-global stereo matcher operating on off-nadir views is proposed together with a triangulation scheme based on restricted quadtrees to obtain watertight meshes. However, while the detailed output will be suitable for visualization its polygon count might be too high in order to feed geographical databases. This problem does not arise in (Panday and Gerke, 2011) where parametric building models are fitted to oblique images. For this purpose roof wire frame edges of a rough mesh of a struc-ture are matched to the off-nadir input bitmaps, and roof over-hangs already get detected by plane sweeping. However, since the required initial building hull is derived from an airborne laser scanner instead of the imagery the method described is not self-contained. Utilizing oblique imagery only (Xiao, 2012) generates a point cloud through stereo matching and identifies fac¸ade and roof patches using a trained classifier that incorporates both the height and color information from the underlying bitmaps. Being non-parametric this approach can handle slope roofs already and keeps track of the semantics of the building surfaces although this is not emphasized.
poly-gons with a known surface type get textured from the original bitmaps. Occluded parts of the reconstructed buildings are de-tected by ray-casting a full-resolution DSM of the scene and col-ored from multiple radiometrically adjusted sources with mini-mal resampling. Further, the unrectified texture atlases generated during this process are used for the perspective-correct visual-ization of the 3D models and for the identification of potential windows through object-based image analysis (OBIA). Any win-dows found get vectorized and reintegrated into the initial poly-gonal building hulls to obtain semantically annotated ”LOD-2.5” CityGML objects.
2. PREPROCESSING
In a first step of the proposed workflow the raw aerial images of an urban scene need to be preprocessed. This includes demosa-icking, dark signal and photo response non-uniformity correction and distortion removal involving one resampling step. Also, the position and rotation information from the GPS receiver and in-ertial measurement unit (IMU) of the camera that is assigned to the images gets refined by bundle adjustment. The resulting ori-ented pinhole images with a maximum epipolar line error of0.1
to0.3pixels are passed to a dense stereo matcher based on the semi-global matching (SGM) algorithm to produce (tilted) digital surface models (Hirschm¨uller, 2008). Since the available SGM implementation is optimized for nadir bitmaps the image orien-tation of the oblique data must be altered by the average angular displacement to roughly point into a vertical direction before run-ning the matcher and back-rotated later on to retain the original geometry of the fac¸ades.
Following stereo matching the DSMs get selectively smoothed to reduce the noise without affecting high-frequency details. As-suming that city buildings appear as elevated regions surrounded by lower ground those DSM pixels that form the terrain are iden-tified and removed by repeatedly shifting windows of varying size over the height bitmaps (Mayer, 2004). In conjunction with an or-thogonally projected near-infrared channel this process that basi-cally creates a digital terrain model (DTM) also eliminates most of the vegetation which otherwise would disturb the upcoming stages of the workflow. As a by-product the DTM provides an estimate for the ground height around the buildings.
3. BUILDING EXTRACTION
Building extraction resembles previous work from (Frommholz et al., 2015). It comprises fac¸ade and roof plane detection, topo-logy analysis and a geometric composition stage to construct the 3D hull of the structures captured.
3.1 Fac¸ades
After preprocessing, to detect the fac¸ades, the (oblique) DSM pixels that remain from the subtraction by the DTM are trans-formed into genuine 3D points, subsampled and projected onto the XY plane subdivided by a regular grid. The spacing of the grid must be adjusted empirically according to the residual noise of the points. Then, the spatial distribution and z histogram is analyzed to identify fac¸ade pieces. For the cell element set that is considered a part of the fac¸ade the regression line is estimated by RANSAC from a consensus set of two projected points (Fisch-ler and Bolles, 1981). The RANSAC estimator will terminate if either an upper iteration count has been reached or if the percent-age of the points of the cell that are within a maximum distance to the regression line running through the consensus set is above a
threshold that depends on the grid spacing. Compared to the for-merly employed principal component analysis (PCA) switching to RANSAC has proven to be more robust to noise introduced by the slightly higher orientation and matching inaccuracies of cell points derived from oblique surface models which represent the majority on wall surfaces. Therefore taking the Eigenvector with the greatest Eigenvalue of the 2D covariance matrix of the cell points as the major line direction has been abandoned trading speed for quality.
If the line segments have been determined for individual grid cells the computation of the regression line will be extended to adja-cent cell groups to form fac¸ade fragments of the same orientation. This is achieved by pair-wisely comparing the line directions of the cells of a local 8-neighborhood and the line direction of the kernel center against a fixed angular threshold. In case of match-ing directions the respective cells are added to the same cell set. When no more adjacent cells are left to be assigned a common re-gression line will be estimated through the point set of each cell group. The resulting linear fac¸ade fragments will be intersected if their endpoints are locally adjacent within the grid forming the desired closed two-dimensional contour.
3.2 Roofs
For each building the roof surface gets modeled from the nadir images only. Reconstruction starts by sorting the 3D points de-rived from the DSM into a grid, however, no projection is applied keeping the z coordinates. Cells outside the polygonal outline from fac¸ade detection get discarded, and PCA on the3×3 covari-ance matrix is performed for each cell since the positional noise from utilizing the vertical views only is low in contrast to wall surface extraction. Roof cells are identified by applying a pla-narity threshold and get merged into the same labeled cell group if their normals roughly point into the same direction.
3.3 Topology
To derive the roof geometry from the cell groups their spatial re-lationship, or topology, needs to be computed. Since this step requires any gaps between the labeled cell clusters caused by chimneys, antennas and similar roof installations to be closed first breadth-first region growing operating on the 2D projection of the confined cell points is initially applied. The grown cell sets are subsequently tested for potential connections by shifting a2×2
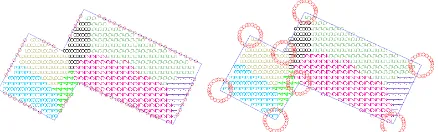
window over the axis-aligned bounding box of the projected area. If the window covers two or more different labels this will indi-cate a topological edge or node between adjacent cell groups re-spectively to be stored in a table. Similarly, the topology between the roof and the building fac¸ades is analyzed by discretely scan-ning the polygonal outline of the structure obtained during wall surface reconstruction. If a particular side of the contour entirely joins a single roof cell group it will be considered an edge adja-cent to the corresponding fac¸ade. If two or more different labels are found along a side of the polygon instead a fac¸ade-roof node resulting for instance from an arris will be assumed. Also, to have a node in the topology table where two wall surfaces and exactly one roof cell group intersect the number of roof cell groups at the corner points of the contour is computed by circular sampling as shown in figure 1.
3.4 Geometric surface composition
Figure 1. Topology analysis between roof regions/fac¸ades and at fac¸ade corners
cell groups. Also, the fac¸ade planes get constructed by extruding the respective segments of the building contour perpendicularly to the XY plane. Having these geometric entities the intersection of adjacent pairs of roof planes or a roof plane with a nearby wall surface yields the geographic position and direction of the topo-logical edges, i.e. the roof ridge, arris and the outer edges of the house top. However, since the resulting and possibly skew lines will be infinite they need to be limited by the spatial represen-tation of the topological nodes before they eventually can form the skeleton of the building to be modeled. Therefore the node coordinates are computed as the geometric center of the shortest connecting line among all combinations of pairs of lines derived from the topological edges, and the edge lines get adjusted ac-cordingly.
To make the reconstruction complete the missing ground surface is derived from the building contour obtained during fac¸ade cell regression. Its z value is set to the height estimate from the terrain removal process initially performed after SGM. The finite roof, wall and ground polygons of the modeled buildings eventually get written to separate files using the open Alias/Wavefront OBJ data format where the semantic designations are kept in specifi-cally formatted comments. In addition the geometry gets stored as separate LOD-2 CityGML objects for 3D GIS databases.
4. TEXTURE MAPPING
For an attractive visualization of the reconstructed buildings their surfaces are colored by projecting parts of the original oriented aerial images onto the polygons of the previously written OBJ meshes. This process called texture mapping assigns each point of a model polygon a normalized 2D position inside a texture bitmap pointing to the pixel which effectively provides the spec-tral intensities at that vertex. Any pixel inside the polygon will then be automatically interpolated by the 3D render engine. Com-puting the texture map for each surface of the building is subdi-vided into two major steps. First, the set of aerial images that pic-ture a particular polygon best needs to be determined with respect to the viewing angle and object visibility. Second, those parts of the chosen images that actually contribute to the surface need to be radiometrically adjusted and rendered to a single digital image called texture atlas without wasting too much space. Creating a texture atlas is essential because real-world render engines can-not efficiently handle hundreds or thousands of high-resolution source images at once due to memory and I/O limitations and a finite number of texture units on the graphics processor.
4.1 Finding source images
To find the set of images that optimally colors a particular part of the building model the entire oriented imagery from the aerial camera is traversed per polygon. Since different measures are used to assess the texture quality the input data gets subdivided into nadir and oblique bitmaps depending on the tilt angle of the underlying sensor which is tested against a fixed user-defined off-nadir threshold. Also, because off-nadir views will precede oblique
views by default, this threshold allows to control the type of view which critical surfaces like slope roofs are to be primarily tex-tured from.
For the nadir views the texture quality for a particular building polygon is calculated by comparing the normal vector of the re-spective camera against the surface normals which are implicitly given in form of a consistent vertex order enforced during the reconstruction phase. In case of opposing normal directions the polygon is considered visible and its vertices will be projected into the potential texture source. For the resulting 2D positions
(si, ti)a positional floating-point scoreqn=qxqyis determined per coordinate as
˜
dx=max(px,|px−dx|)
˜
dy=max(py,|py−dy|)
qx= (
1−|si−px| ˜
dx ,0≤si< dx
0 , else
qy=
1−|ti−py| ˜
dy ,0≤ti< dy
0 , else
(1)
where(px, py)denotes the principal point and(dx, dy)the im-age dimension in pixels. The positional score will equal 1.0 at the principal point of the sensor, linearly decrease while approaching the image borders and drop to zero when the frame is left. It therefore penalizes projective distortions yet building polygons will be allowed to be incompletely pictured. Incorporating the angle the surface is seen from the final quality score for nadir images is obtained by multiplyingqnwith the cosine of the inci-dence angle of the camera and face normal. Only if this product is non-zero the aerial bitmap will be added to the texture source list of the current building polygon.
If no suitable nadir images are found to color a particular surface the oblique images will be tried. Similarly to the nadir case a quality measure will be computed for the tilted views, however, the average incidence angle between the model face normal and the actual view vectors per vertex will be taken instead of the fixed camera normal. Also, the positional score is calculated as the area ratio of the axis-aligned bounding box of the projected polygon vertices(si, ti)clamped to the image dimensions and its full-size counterpart. Being computationally cheap this once more allows but penalizes projections that partially fall outside the source bitmap without being tied to the principal point. The product of the view-dependent and positional score delivers the final quality criterion for oblique images rewarding lower inci-dence angles in order to reduce projective distortions on the ver-tically aligned fac¸ades aimed at. Only aerial bitmaps with a pos-itive quality index will be added to the texture source list for the current building polygon.
a texture atlas, renders the unified bitmap and calculates the final texture coordinates. The texture coordinates and atlas location are added to the reconstructed 3D building models which will be rewritten as OBJ files.
4.2 Visibility test
Because assessing the texture quality from the normal vectors and positional score as described does not consider occlusions at all the reconstructed 3D buildings might get incorrectly tex-tured with parts of the surrounding terrain, vegetation or close-by man-made objects. To avoid these artifacts the bitmaps of the ini-tial texture source list for a particular polygon are analyzed for visibility issues. Since it is the only information available about arbitrary occluders geographically aligned to the reconstructed structures the visibility test is performed on the full-scale nadir DSM of the scene recorded by the aerial camera.
Therefore, for each pixel of each building surface projected into its first texture source a 3D ray is constructed by connecting the center of projectionCwof the underlying camera and the pixel in world coordinates. The end point of the ray is retrieved from its intersection with the respective polygon. When the finite ray
rwis entirely known in world space it will be projected onto the DSM forming a 2D rayrdsmfrom the projected camera center
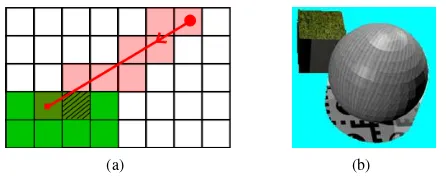
Cpto the end pointEpon the building. Using a digital differen-tial analyzer (DDA) like the 4-connected component Bresenham algorithm (Bresenham, 1965) the DSM gets traced alongrdsm beginning atCp. For each discrete positionp= (x, y)the height values are obtained from both the DSM and the world rayrw abovep. If the DSM height exceeds the height onrwthe world ray intersects with an object, and if this object is not the surface under testing of the target building an occlusion has been found. Otherwise line tracing continues on the projected rayrdsmuntil a user-defined environment aroundEpis reached. Stopping shortly before the projected end pointEpcompensates for reconstruction inaccuracies and discretization errors of the DDA of up to half a DSM pixel although small objects in front of the affected surface might get omitted. Also, the visibility test will fail with erro-neously detected occlusions whenEpcannot be reached because the DSM is 2.5D with only one z coordinate per position while the polygonal meshes to be textured are not (see figure 2). If a pixel of the building polygon has been confirmed visible the result will be kept in a binary bitmap that has the size of the bounding box of the projected surface vertices. Since these visibility maps are stored per polygon per source image and need to remain in RAM until the texture atlas has been written they get compressed loss-lessly via run-length encoding.
Because the DDA-based algorithm described uses integer opera-tions only for the trace it is very efficient already and in addition can be easily parallelized. Moreover, for aerial cameras the ori-ginCw and most parts of the world ray can be expected to be higher than the highest object of the scene pictured. This means that most of the trace ofrpcan be skipped to further reduce the runtime as long as potential occlusions won’t be omitted as well under all circumstances. Therefore, to safely implement this opti-mization, the Bresenham tracer is made hierarchical and operates on two levels of detail of the DSM. Beginning with the coarse trace a small version of the surface model containing the maxi-mum heights per pixel at 2% of the original dimensions is ana-lyzed starting fromCpwhich needs to be scaled accordingly. If the height value from ray-casting the low-resolution DSM is less than the height of the world rayrwat that point no occlusions can occur, and hence the next coarse pixel needs to be tested safely skipping at least fifty full-resolution DSM pixels at once. Other-wise a detailed trace is run on the original DSM as stated above,
and no speed will be gained. Aside from its accelerating effect us-ing a hierarchical approach also reduces the amount of memory needed by the line tracer. If the full-size DSM image is not kept in RAM completely but accessed on-demand only those parts re-quired during the detailed trace need to be cached. This greatly overcompensates the memory additionally occupied by the sub-sampled DSM particularly if rays from distant oblique cameras with their stretched projections must be followed.
(a) (b)
Figure 2. (a) Incorrect early object hit due to trace discretization (b) Failing visibility test below the sphere
4.3 Redundancy removal and radiometric analysis
In highly overlapping flight configurations a reconstructed struc-ture will be picstruc-tured by many images. This redundancy allows to texture occluded building surfaces from a different view possi-bly requiring radiometric adjustments, however, too many highly overlapping texture bitmaps also consume resources without pro-viding additional information. Having the pixel-precise com-pressed bitmaps from the visibility test both aspects can be ad-dressed for each mesh polygon by constructing the overlap graph for each pair of its color sources(Ti, Tj), i6=j. This is done by traversing the visible pixels ofTi, reprojecting their respective position intoTjand querying the corresponding visibility map if the warped pixel can be seen inTjtoo. The data added to the graph then comprises a node forTicarrying the total count of its visible pixels and a weighted edge fromTitoTjstoring the non-commutative count of overlapping pixels ofTiwithTj. Together both values form the denominator and numerator of the overlap ratio betweenTiandTj. Using this percentage redundant texture sources can be removed from the graph and bitmap list of the polygon by comparing the ratio against a threshold. Preference will be given to images exposing a high surface coverage if the graph nodes are sorted by their payload in descending order.
In addition to redundancy removal the condensed graph is ana-lyzed to derive the coefficients for radiometric adjustments be-tween overlapping sources texturing the same building surface. This will produce homogeneous render results when occlusions are padded. To compute the coefficients the minimum spanning trees (MSTs) are obtained from Kruskal’s algorithm (Kruskal, 1956) run on the overlap graph. In each construction step the edges with the highest weight, that is, the highest overlap is cho-sen. The resulting MSTs define disjoint sets of overlapping tex-ture sources among which the radiometric adjustments can be made. Now, starting from the root node with the maximum value of shared pixels, each tree is traversed pre-order. Assuming the linear correction model from (Fisher, 1992), the brightness off-setsoand contrast scalesscan be obtained for each color channel separately as
s=n
2(Pn
i=1aibi)−( Pn
i=1ai)( Pn
i=1bi)
n2Pn i=1a2i −(
Pn i=1ai)2
o=
Pn
i=1bi−sPni=1ai
n2
for then overlapping pixelsai andbi between the parent and child nodes representing two texture sources for the same model polygon. When deeper regions of the MST are approached this calculation must be performed using the radiometrically adjusted texture pixels from the parent nodes. The resulting coefficients are stored in the graph nodes to be applied when the texture atlas is being finalized.
4.4 Creating the texture atlas
When the polygons of the reconstructed buildings have been as-signed a sorted list of images with source texture coordinates
(si, ti), visibility maps and radiometric correction coefficients per bitmap the actual color information will be written to the tex-ture atlas. In a placement stage a compact layout for the textex-ture patches comprising the pixels inside the(si, ti)area is computed for each model polygon. The shape of this patch is defined by the first or ”master” source bitmap and extended by a protective border to accommodate the mipmap filters employed by graphics adapters to display a scene in different resolutions. Since solv-ing the placement problem optimally on a global level is known to be NP-hard an efficient greedy algorithm placing new texture patches inside the atlas bitmap one by one is used instead. Thus, to find the next free spot for the current patchP the vacant po-sitions inside the texture atlas are sequentially traversed. Once a free position has been found it will be attempted to pasteP in there. This is done by rotating its pixels losslessly in steps of
90◦to efficiently use the space available inside the target bitmap
and intersecting the resulting shapes with the set of texture patch polygons placed before. If no overlap is detected the atlas po-sition and rotation angle forP will be stored in a dynamic list and the algorithm will proceed with the next patch. However, in casePcannot be pasted anywhere the destination bitmap will get resized horizontally and vertically to the next power of two of pixels as required by most graphics cards. To accelerate the placement the unoccupied spots inside the texture atlas are man-aged by a two-dimensional block availability map (BAM) storing free scanline segments. Moreover, the previously allocated tex-ture patches to testP against are spatially sorted to reduce the number of expensive polygon-polygon intersection tests when the algorithm attempts to paste a particularP.
Once the layout has been determined the render stage writes the color information from the respective aerial source images to their designated places inside the atlas bitmap. Following the ordered sequence of texture sources the visible pixels for each building surface get rotated and copied to the corresponding texture atlas position. In case of the master bitmap this does not involve resam-pling, that is, if a building surface can be entirely textured from a single aerial image the original resolution will be retained. How-ever, if a certain part of a polygon is not visible in the first bitmap of the sorted list of texture sources the subordinate images will have to be accessed to bridge the occlusion. In this case the cur-rent subordinate bitmap needs to be warped onto the shape of the texture patch which is defined by the master bitmap and resam-pling will become unavoidable. If no more subordinate images are available to texture an entirely unseen part of a polygon of the reconstructed object the respective pixels will be interpolated from any surrounding color information using inverse distance weighting. This happens in particular if the flight configuration lacks sufficient overlap.
To accelerate rendering the texture atlas the same on-demand ac-cess technique as for the visibility test is employed to read from the oriented aerial input images. Therefore even huge source bitmaps as recorded by certain commercial camera systems will have no significant performance impact on the process. When a
texture patchPfor a building surface has been completely writ-ten its corner coordinates inside the texture atlas without the pro-tective border get normalized by the dimensions of the destination bitmap as required by render engines and 3D file formats. The resulting positions(ˆsi,ˆti)and a link to the atlas bitmap are sub-sequently added to the respective OBJ model of the structure. In addition to the texture atlas the index of the surface, its semantic designation and the rotation applied during the placement stage are kept in an artificial multi-channel bitmap as filled polygons comprising the area defined by the(ˆsi,ˆti). Since this semantic layer will be exclusively used for the object-based classification the protective border does not need to be taken into account. Also, to preserve the link between the final texture coordinates and the aerial images, the source bitmap reference, the texture coordi-nates(si, ti)and the index of the corresponding building surface are serialized to a text file.
5. 3D RENDERING
Rendering the reconstructed and textured buildings is straight-forward because in their binary form the required vertices, face indices and 2D texture coordinates(ˆsi,ˆti)contained in the OBJ output can be passed directly to the graphics card using 3D ap-plication programming interfaces like OpenGL or DirectX that many visualization tools are based on. When the model poly-gons get displayed the pixels between the vertex projections will be colored by interpolating the texture coordinates and sampling the texture bitmap at the resulting relative positions. Decent ras-terizers operate in a perspective-correct way with respect to the current viewpoint and angle by linearly interpolating1/z,ˆsi/z andˆti/zwithzdenoting the distance in world units between the current vertex and the virtual camera and undoing the division later by multiplying with the now interpolated value1/(1/z) be-fore the texture pixels are actually being accessed (Low, 2002).
However, this method does not compensate for any perspective distortion introduced by the texture source itself which is not an issue with the ortho-rectified bitmaps used for example in 3D computer games. Therefore, when using pinhole images as tex-ture sources as described before significant positional errors may occur leading to visible render artifacts if there is a strong depth contrast relative to the distance between the acquiring camera and the real-world object resembling the model polygon (see figure 3). In particular this issue will occur when low-flying airplanes or unmanned aircraft systems (UAS) are used for photogrammetric tasks to achieve high resolutions. To correct the positional error the perspective distortion of the texture patches must be neutral-ized. This is done by projecting the verticesviof each face or-thogonally onto the sensor plane of the respective master camera running through its center of projectionCw, i.e. computing
di=|n((vi−Cw)·n)| (3)
other hand, if depth support is implemented as outlined and be-cause the texture atlas remains unmodified, no additional loss in resolution or filter artifacts due to resampling will be introduced aside from the renderer where it is unavoidable however.
(a) (b) (c)
Figure 3. Render issues with pinhole textures (a) Pinhole texture source (b) Fronto-parallel quad textured with (a) and rendered using raw texture coordinates (c) Same quad rendered correctly using adjusted texture coordinates
6. WINDOW CLASSIFICATION
To extract the windows from the unrectified texture atlas that originally gets created for visualization purposes the output from the texture mapping stage undergoes object-based image analysis (OBIA) using the commercial eCognition software by Trimble. In the initial segmentation stage of a custom rule set regions of high spatial gradient which often correspond to edges represent-ing window borders are highlighted by the Roberts edge detec-tor independently from whether the contrast between the window and background is positive or negative (Roberts, 1963). To regain the individual texture patches of the building surfaces without ac-cess to the texture coordinates eCognitions contrast split segmen-tation algorithm separates the atlas bitmap into discrete objects. Since this does not identify potential openings inside the resulting 2D polygons yet multiresolution segmentation further subdivides the result into very fine and detailed regions even in the presence of a low image contrast.
When the atlas has been segmented the actual classification stage will be executed starting with the removal of the vegetation left on the building surfaces by calculating the vegetation index. Sub-sequently, the weighted combination of the Roberts border con-trast, the local contrast within ten pixels around the edges found, the compactness of the segments and their rectangular fit identi-fies preliminary window regions. This adds shape-based criteria which favor openings with balanced proportions and perpendic-ular lines to purely radiometric features and allows to roughly detect ill-formed objects even though the texture atlas has not been rectified. Also, a binary weight reflecting the surface se-mantics of the reconstructed buildings excludes the wall and roof surfaces which currently are not examined for windows. Because the merged segments still may not yield the correct extent and shape they are further grown into adjacent regions under similar-ity and homogenesimilar-ity constraints for the window seed, candidate and target. To close any gaps in the classification outcome the window objects are processed by the island and pixel-based den-sity filters. The denden-sity calculation is based on the relative area of considered object pixels within a moving window around a can-didate pixel. The cancan-didate pixel is removed from the object if the relative area exceeds a fixed maximum threshold. This func-tion can remove small convexities. Complementarily, the mor-phological closing filter fills small concave deformations so that the window objects receive a relatively smooth shape. In the end the classified window areas get uniquely labeled and written to a bitmap of the same size as the texture atlas.
Having the label image congruently covering the texture atlas and the serialized text file linking the texture atlas to the aerial source images the extracted windows can be reintegrated into the recon-structed buildings. To convert the labeled pixel sets from OBIA into polygons in world space the contours of the window areas are retrieved first using the Moore tracing algorithm with a modified stopping criterion (Reddy et al., 2012). The resulting contour ver-tices are reduced with the Ramer-Douglas-Peucker method (Dou-glas and Peucker, 1973) with a maximum simplification error of one pixel. Since each contour lies inside a corresponding tex-ture patch its coordinates can be computed relatively to the patch and back-rotated according to the information from the congruent semantic layer from the mapping stage. Further, utilizing the se-rialization that assigns a texture patch its aerial source image and its source texture coordinates(si, ti)the relative contour
coordi-nates can be translated into the aerial source image as well. With the known camera orientation, if the translated window contours are now being sparsely ray-traced, their 3D coordinates will be obtained from the intersections with the respective wall surfaces and added to the reconstructed buildings as polygonal objects. Because ray-tracing the windows in world space will automat-ically consider the perspective distortion of the texture patches inside the atlas no correction needs to be applied in contrast to vi-sualization. The modified building models are written once more as CityGML objects lifted to the inoffical ”LOD-2.5”.
7. RESULTS
To evaluate the performance of the proposed method a flight cam-paign over the island of Heligoland in Germany was conducted with the DLR MACS HALE aerial camera (Brauchle et al., 2015). This device is equipped with one nadir-looking and two oblique RGBI sensors pointing to the left and right at an angle of36◦and
comes with an on-board GPS receiver and IMU to assign each image the approximate camera position and rotation. During pre-processing a total of 3478 images with 4844 x 3212 pixels each at a radiometric depth of 12 bits per color component were con-verted to digital surface models with a spatial resolution of 5 cm per pixel and 3D point clouds consuming 266 megabytes on aver-age per building. From this data 843 structures got reconstructed by a MATLAB software prototype which is not completely auto-matic yet but requires a few data-dependent input parameter esti-mates as mentioned. After systematically determining these val-ues on a scene subset the runtime for the reconstruction process was roughly one month for the entire data set on a desktop PC uti-lizing a single CPU core. Fully automatic texture mapping by the multi-threaded l3tex+ tool written in C++ was performed on sets of 75 buildings in order to keep the atlas bitmap size below the limit manageable by the graphics card. It took roughly 8.5 hours in total on 2012 server-class hardware. Window classification of the texture atlases using OBIA does not require interaction and occupied two CPU cores of the eCognition workstation for about 15 minutes for a bitmap of 4096 x 4096 pixels at maximum.
ID Reconstructed aream2
ALK area m2
Delta m2
Delta % (ALK=100)
1 94.80 89.81 5.00 105.6
2 67.75 69.98 -2.22 96.8
3 168.03 160.53 7.50 104.7
4 83.58 72.65 10.93 115.0
5 178.62 174.29 4.33 102.5
6 188.01 179.79 8.22 104.6
7 79.36 75.58 3.78 105.0
8 34.73 36.70 -1.97 94.6
9 88.23 81.17 7.07 108.7
10 185.13 191.23 -6.11 96.8
11 89.27 85.97 3.30 103.8
12 182.81 172.86 9.95 105.8
13 107.18 99.90 7.28 107.3
14 56.12 50.60 5.52 110.9
15 75.57 71.48 4.08 105.7
16 111.33 100.50 10.83 110.8
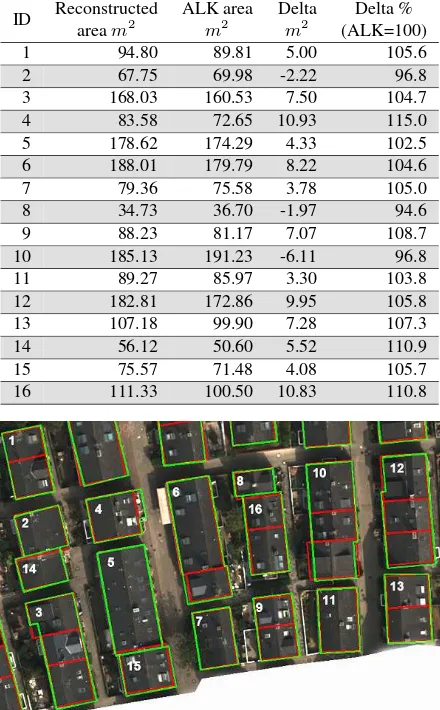
Figure 4. Accuracy of reconstructed building footprints (green) compared to the ALK (red) neglecting inside walls
Because no error-free real-world ground truth can be generated for an objective quality assessment of the texture mapping stage the reconstructed buildings have been rendered using the texture atlases and visually examined. Particular attention has been paid to critical locations like the space between two closely adjacent buildings. Also, the operation of the visibility test and radiomet-ric correction has been evaluated more systematically on an artifi-cial test scene. This ”Perfect World” comprising known geomet-ric primitives colored with public-domain textures from (Kelsey, 2015) and calibration patterns visually illustrates any artifacts im-mediately due to its exact composition. Nevertheless an objective quantification of the quality of texture mapping remains an open issue to be further investigated.
Since no reference data has been available for the windows of the buildings as well ground truth has been obtained manually from the fac¸ade patches of the texture atlas and subsequently opposed to the classification result. Based on this reference a correctness of 67% and a completeness of 77% has been computed on the pixel level which is substantial but not extraordinarily good. The main issue with window extraction is its high dependence on ra-diometric features whereas geometric constraints do not get fully exploited because the texture atlas is not rectified in order to avoid a degradation in resolution due to resampling. Relying solely on spectral properties however fails when for instance windows and neighboring surfaces like shutters get merged. This negatively affects the shape of detected objects and might also cause their omission. Figure 5 shows the results from building reconstruc-tion, texture mapping and window classification on a small subset
of Heligoland, and figure 6 depicts the texture mapping outcome on the artificial test scene.
(a)
(b)
Figure 5. (a) Reconstructed buildings of Heligoland with textures (b) Same buildings with surface semantics and windows
(a) (b) (c) (d)
(e) (f)
Figure 6. Texture mapping the ”Perfect World” (a-d) Radiomet-rically different texture sources (e) Test scene reference (f) Test scene textured with (a-d) as proposed
8. CONCLUSION AND FUTURE WORK
Also, texture mapping will greatly pick up speed by rendering the part of the DSM that falls into the area of the building polygons projected into the respective aerial source bitmap using hardware-accelerated OpenGL instead of a CPU-intensive software ray-caster. In a naive implementation the required shader programs would displace the vertices of the regularly meshed height map along the z axis which however only needs to be done for a small viewport. This is similar to the z-buffer algorithms initially dis-cussed except that not just the reconstructed buildings will be in-cluded but the scene details from the full-resolution DSM. Apart from acceleration measuring the texture quality remains an im-portant but open issue yet. To obtain suitable ground truth that does not suffer from measurement errors artificial but realistic test data similar to the ”Perfect World” that for now only allows to visually validate the functionality of the source image choice, visibility test and radiometric correction is absolutely essential. However, certain assumptions on the resolution and coverage of the texture sources as well as for instance view-independent light-ing and anti-aliaslight-ing have to be made. If this can be implemented and automatized pixel-wise comparisons against one or more ren-dered reference images will become possible yielding i.e. RMS errors and other statistical values.
Moreover, fac¸ade element extraction is currently focusing on win-dows and mostly utilizes radiometric features which limits the achievable classification quality. Extending the OBIA workflow with projective geometry would provide mathematically justified shape constraints for unrectified texture atlases, however, this will require the implementation of custom segmentation and classifi-cation code for the currently used eCognition software. In ad-dition, since genuine 3D point clouds are available from stereo matching anyway, their vertices can be projected onto the recon-structed building surfaces resulting in depth maps for each poly-gon. If the noise can be controlled and the resolution of the DSMs attached to each surface proves to be sufficient adding this infor-mation to the semantic layer will provide OBIA with another in-put that may significantly increase the correctness of the extracted items. Moreover, surface depth maps will enable displacement mapping to be used in the renderer resulting in more realistic vi-sualizations and, if applied to the CityGML output as well, se-mantic descriptions of the modeled buildings that get closer to LOD-3.
REFERENCES
Brauchle, J., Hein, D. and Berger, R., 2015. Detailed and highly accurate 3D models of high mountain areas by the MACS - Hi-malaya aerial camera platform. Int. Archives of Photogrammetry, Remote Sensing and Spatial Information Sciences 40, pp. 1129– 1136.
Bresenham, J. E., 1965. Algorithm for computer control of a digital plotter. IBM Systems Journal 4(1), pp. 25–30.
Dahlke, D., Linkiewicz, M. and Meissner, H., 2015. True 3D building reconstruction: fac¸ade, roof and overhang modelling from oblique and vertical aerial imagery. International Journal of Image and Data Fusion 6(4), pp. 314–329.
Douglas, D. H. and Peucker, T. K., 1973. Algorithms for the reduction of the number of points required to represent a digitized line or its caricature. Cartographica - The International Journal for Geographic Information and Geovisualization 10(2), pp. 112– 122.
Fischler, M. A. and Bolles, R. C., 1981. Random sample con-sensus: A paradigm for model fitting with applications to im-age analysis and automated cartography. Communications of the ACM 24(6), pp. 381–395.
Fisher, Y., 1992. Fractal image compression. Technical Re-port 12, Department of Mathematics, Technion Israel Institute of Technology. SIGGRAPH ‘92 Course Notes.
Frommholz, D., Linkiewicz, M., Meissner, H., Dahlke, D. and Poznanska, A.-M., 2015. Extracting semantically annotated 3D building models with textures from oblique aerial imagery. Int. Archives of Photogrammetry, Remote Sensing and Spatial Infor-mation Sciences XL-3/W2, pp. 53–58.
Frueh, C., Sammon, R. and Zakhor, A., 2004. Automated tex-ture mapping of 3D city models with oblique aerial imagery. 3D Data Processing, Visualization and Transmission Proceedings pp. 396–403.
Haala, N. and Kada, M., 2010. An update on automatic 3D build-ing reconstruction. ISPRS Journal of Photogrammetry and Re-mote Sensing 65, pp. 570–580.
Haala, N., Rothermel, M. and Cavegn, S., 2015. Extracting 3D urban models from oblique aerial images. Joint Urban Remote Sensing Event (JURSE) 2015 Proceedings 38, pp. 1–4.
Hirschm¨uller, H., 2008. Stereo processing by semi-global match-ing and mutual information. IEEE Transactions on Pattern Anal-ysis and Machine Intelligence 30(2), pp. 328–341.
Kelsey, B., 2015. OpenGameArt Artwork Repository homepage. http://opengameart.org. (08-February-2015).
Kruskal, J., 1956. On the shortest spanning subtree and the trav-eling salesman problem. Proceedings of the American Mathe-matical Society 7, pp. 48–50.
Low, K.-L., 2002. Perspective-correct interpolation. Technical writing, Department of Computer Science, University of North Carolina at Chapel Hill.
Mayer, S., 2004. Automatisierte Objekterkennung zur Inter-pretation hochaufl¨osender Bilddaten in der Erdfernerkundung. PhD thesis, Humboldt-Universit¨at zu Berlin, Mathematisch-Naturwissenschaftliche Fakult¨at II.
Panday, U. S. and Gerke, M., 2011. Fitting of parametric building models to oblique aerial images. Int. Archives of Photogram-metry, Remote Sensing and Spatial Information Sciences 38, pp. 233–238.
Reddy, P. R., Amarnadh, V. and Bhaskar, M., 2012. Evaluation of stopping criterion in contour tracing algorithms. International Journal of Computer Science and Information Technologies 3, pp. 3888–3894.
Remondino, F. and Gehrke, M., 2015. Oblique aerial imagery -A review. Photogrammetric Week ’15 12, pp. 75–81.
Roberts, L. G., 1963. Machine Perception of Three-Dimensional Solids. Outstanding Dissertations in the Computer Sciences, Gar-land Publishing, New York.
Smith, M., Hamruni, A. M. and Jamieson, A., 2009. 3-D ur-ban modelling using airborne oblique and vertical imagery. Int. Archives of Photogrammetry, Remote Sensing and Spatial Infor-mation Sciences 38-1-4-7/W5.
Stilla, U., Kolecki, J. and Hoegner, L., 2009. Texture mapping of 3D building models with oblique direct geo-referenced airborne IR image sequences. Int. Archives of Photogrammetry, Remote Sensing and Spatial Information Sciences 38-1-4-7/W5.