A HYBRID GWR-BASED HEIGHT ESTIMATION METHOD FOR BUILDING
DETECTION IN URBAN ENVIRONMENTS
Xuebin Wei*, Xiaobai Yao
Department of Geography, University of Georgia, 210 Field Street, Athens, Georgia, USA 30602 – (xbwei, xyao)@uga.edu
Technical Commission II
KEY WORDS: Building Detection, GWR, Height Prediction, Aerial Photo, Sparse LiDAR Point, Urban Area
ABSTRACT:
LiDAR has become important data sources in urban modelling. Traditional methods of LiDAR data processing for building detection require high spatial resolution data and sophisticated methods. The aerial photos, on the other hand, provide continuous spectral information of buildings. But the segmentation of the aerial photos cannot distinguish between the road surfaces and the building roof. This paper develops a geographically weighted regression (GWR)-based method to identify buildings. The method integrates characteristics derived from the sparse LiDAR data and from aerial photos. In the GWR model, LiDAR data provide the height information of spatial objects which is the dependent variable, while the brightness values from multiple bands of the aerial photo serve as the independent variables. The proposed method can thus estimate the height at each pixel from values of its surrounding pixels with consideration of the distances between the pixels and similarities between their brightness values. Clusters of contiguous pixels with higher estimated height values distinguish themselves from surrounding roads or other surfaces. A case study is conducted to evaluate the performance of the proposed method. It is found that the accuracy of the proposed hybrid method is better than those by image classification of aerial photos along or by height extraction of LiDAR data alone. We argue that this simple and effective method can be very useful for automatic detection of buildings in urban areas.
1. INTRODUCTION
Human activity patterns result in increased complexity and spatial extent of built environments(You and Zhang, 2006). Rapid urbanization leads to city expansions and sprawls, causing land use intensification. Consequently, high density buildings have been constructed in many city centers to accommodate the demands for human activities. The heights and densities of buildings also affect physical urban environmental conditions such as wind, access of sunlight, interior temperatures, etc. (Yu et al., 2010). Therefore, monitoring urban expansion and measuring building height have been gaining much research interests in urban planning and urban study.
Theoretically, ground survey can provide the most accurate measurements of built environments, but it is labor and resource intensive, as well as time consuming. Therefore, high-resolution satellite images and aerial photos are widely adopted in urban studies(Wu and Zhang, 2012). However, urban areas are spatially heterogeneous, and thus image classification is complicated due to variations in shapes and materials of human-made structures (Hoalst-Pullen and Patterson, 2011). Different types of data are hence integrated with aerial photos and satellite images to overcome this problem. For instance, high resolution Synthetic Aperture Radar (SAR) data have been fused with LiDAR data and GIS data to generate 3D city models (Soergel et al., 2005). SPOT images and InSAR data were integrated using a classification and regression tree (CART) algorithm to map an urban impervious surface(Jiang et al., 2009).
Although LiDAR data has become increasingly available, the quality and quantity of the data are not always guaranteed. This has constrained its utilization for building detection. However, there are some unique characteristics of LiDAR data in an urban environment from which we can glean some important information to be integrated with other types of data for building classification. For instance, the heights of a building top show relatively regular patterns and they are highly locally
autocorrelated while globally heterogeneous. This study proposes an effective method that integrates the sparse height information of LiDAR data and spectral information from aerial photos (or other remotely sensed images) in geographically weighted regression (GWR) models. The established GWR models can be used to automatically estimate building heights for the entire study area. A case study is conducted to illustrate the process and to evaluate the effectiveness of the approach. The LiDAR data in this paper were collected at 2-meter point spacing in Florida, USA. Such point density is insufficient for building extraction. Therefore, an aerial photo was obtained for assistance. The GWR models integrates characteristic variables from both data sources to estimate the height at each pixel from the height values of its nearby pixels based on their distances and similarities of spectral characteristics. Clusters of contiguous pixels with higher estimated height values distinguish themselves from surrounding roads or other surfaces. It is found that the hybrid GWR-based method produces better results comparison with those of either the traditional image classification of aerial photos or the classification of LiDAR data alone.
2. LITERATURE REVIEW
and Zhang (You and Zhang, 2006)’s research, the building edge is identified by a Laplacian sharpening operator on CCD image at first. The building contour is then extracted based on a bi-directional projection histogram and further calibrated by a line matching algorithm. LiDAR points and the building contours are finally intersected to generate 3D building models. Kabolizade et al (Kabolizade, Ebadi, and Ahmadi, 2010) improved the Gradient Vector Flow (GVF) snake model to extract the building boundary from an aerial photo image and the LiDAR data. A recursive connected-component identification and indexing algorithm is applied in Yu’s study to delineate the building boundary (Yu et al., 2010). Other methods of building extraction have also been used to extract buildings footprints and heights from LiDAR data and aerial photos. Examples include regression analysis, image classification, linear spectral mixture analysis (LSMA), artificial neural network (ANH) and Object based image analysis (OBIA) (Weng, 2012). Methods for evaluating results of building extraction from the remotely sensed data have been developed and discussed (Awrangjeb, Ravanbakhsh, and Fraser, 2010). In addition to traditional pixel-based image classification, an objected-oriented (OO) classification method following a fractal net evolution approach is introduced to discriminate buildings, vegetation and soil based on the spectral and shape heterogeneity (Zhou and Troy, 2008).
3. METHODOLOGY
In this section, the proposed hybrid height estimation method is introduced, illustrated with a case study. The method first performs the traditional LiDAR data classification and the image classification of air photos for building detection to serve as the benchmark results. A GWR-based height prediction method is then introduced to estimate the building heights. Characteristics extracted from the sparse LiDAR points and the aerial photos are used as explanatory variables in the GWR models. The resulting heights provide basis for building detection.
3.1 Data Description
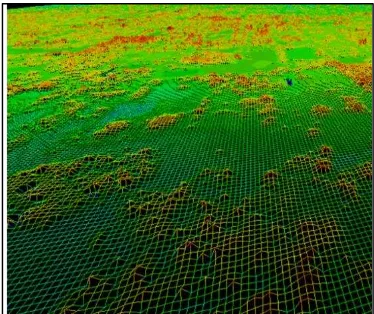
The LiDAR dataset collected in this paper is for Sarasota County, Florida. It consists of 2 lifts of flight lines acquired in 2 sorties using the Leica ALS40 sensor. The data was captured at a flying height of 6,000 feet AMT with a scan rate of 13 Hz and a 25 degree field of view. LiDAR points were collected at approximately 2-meter point spacing (Figure 1). An aerial photo of the same study area with a 0.3 meter spatial resolution is downloaded from the USGS website (Figure 2).
Figure 1. Sparse LiDAR Points in 3D View
Figure 2. Aerial Photo of the Study Area
3.2 LiDAR Data Classification
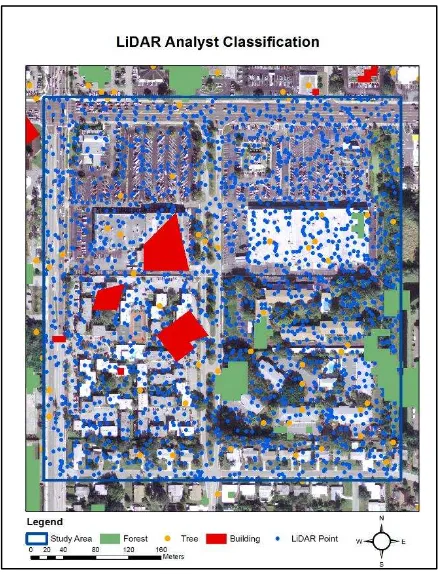
LiDAR points can be classified into bare earth, trees, buildings, and other land cover types based on their height information and number of returns. However, such classification normally requires high quality LiDAR data, and employs sophisticated methods demanding human interventions. For example, LiDAR Analyst software provides good classification solutions (Overwatch Systems, Ltd., 2013) which can produce efficient results for building extraction from LiDAR data. But when the density of data points are relatively low, the results can be disappointing. Figure 3 demonstrates how the LiDAR Analyst tool mistakenly classifies the buildings, trees and forests from the LiDAR points with 2-meter point spacing. Because some small apartments only reflected few LiDAR signals, they were classified as trees or forests in the classification process. This example suggests that low point density is insufficient for building detection by LiDAR data only.
3.3 Image Classification
Figure 3. LiDAR Analyst Classification Result from the Sparse LiDAR Points
3.4 The Proposed Hybrid GWR-Based Building Detection Method
The Geographically Weighted Regression (GWR) is a family of regression models in which the coefficients are allowed to vary spatially. It can be considered a localized regression. The GWR uses locations of sample points for a form of spatially weighted least squares regression, in which the coefficients are determined by examining the set of points within a well-defined neighbourhood of each of the sample points (Smith, Longley, and Goodchild, 2011). In this proposed method for building detection, the underlying idea is that nearby locations with similar spectral characteristics belongs to the same spatial object, and thus may share the same height value.
The major advantage of the method lies is its utilization of unique characteristics of each type of data. Spatial dependence and spatial heterogeneity of the LiDAR data and the aerial photos are considered. The proposed method utilizes both height information from the LiDAR points and spectral characteristics from the aerial photos. By integrating the LiDAR data and the aerial photos, the final GWR model can predict height for each pixel of the aerial photo data. The height values help to separate the buildings from the road segments, and the spectral differences help to distinguish buildings from trees and shadows. Detailed steps are explained below.
Figure 4. Unsupervised Image Classification for Building Extraction
3.4.1 Normalized DSM: A digital surface model (DSM) is the foundation for the computation of building height from LiDAR data. A Normalized DSM (nDSM), which contains relative height information of objects above the ground (Yu et al. , 2010), is constructed from the LiDAR points. The nDSM values from the LiDAR points are considered the heights of spatial features, e.g., height of trees or height of buildings. The calculation is realized in LASTools, a free LiDAR processing tool. The majority of object heights in the study area range from 0 to 39 meters. Extreme height values, which are usually caused by canopies of trees as shown as red points in Figure 5, are filtered in further calculation. The other height values located within the building pixels are considered as building heights. The building height values will serve as the dependent variable in the following step of GWR-based modeling.
Figure 5. Normalized DSM
3.4.3 The GWR Height Estimation Model: Since the LiDAR points are far sparser than the pixels, some pixels have obtained height values from the contained LiDAR points while the majority of the pixels do not contain any LiDAR points at all. However, as a building occupies a cluster of contiguous pixels with similar brightness values, the GWR model is able to predict the building height of pixels based on the brightness values of their surrounding pixels.
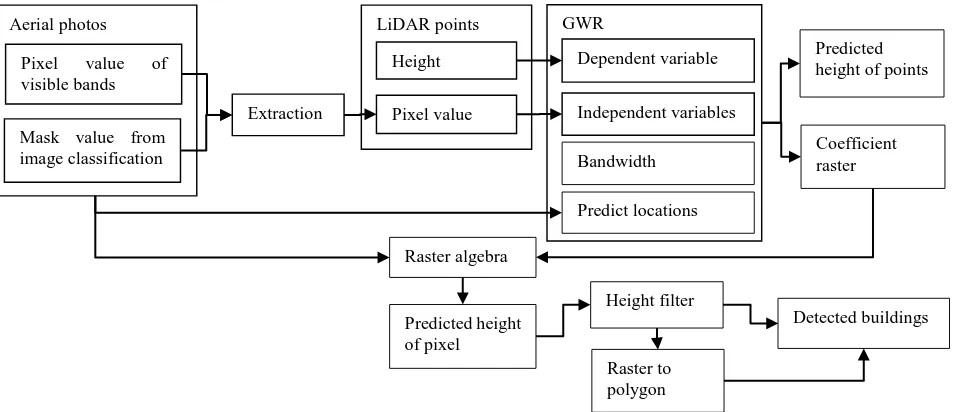
The GWR model (Figure 6) establishes a locally varying relationship between height values and spectral variables. Note that all locations have values of spectral characteristics. The height of each pixel is thus estimated by the brightness values of its surrounding points depending on their distance and the
similarity of their brightness value. The threshold distance is controlled by the bandwidth parameter in the GWR model. The greater the bandwidth is, the further the pixel will be influenced by its neighbors. The brightness values in the red, green and blue bands are set as the independent variables. The classification type in the mask layer, i.e., the class labels from the image classification, is also tested as a possible predictive variable. When used, it is treated as ordinal variables rather than nominal variables in this study assuming that the pixels with a greater class label are more likely belonging to the buildings within a smaller area. Therefore, values from the masks also participant in the GWR regression. The coefficients of the GWR model is locally determined. Because most buildings have widths less than 30 meters in this case study area, the maximal bandwidth in the GWR model is set to 30 meters. As each pixel has its own set of coefficients for the GWR mode, we call the entire spatial coverage of coefficients the coefficient raster. The coefficient raster is calibrated with the original photos in the Raster Algebra function to produce the predicted height raster. A height filter is then applied to extract the pixels belonging to the buildings. The building raster can also be converted to polygons for specific purposes. While height is the dependent variable in the GWR-based modeling process, Table 1 shows the independent variables and the parameter choice. A number of GWR model structures are tested with different choices of predictive variables and parameter settings.
Independent Variable Bandwidth
Predict 1 Mask 30 meter
Predict 2 Red 30 meter
Predict 3 Red; Green; Blue 30 meter
Predict 4 Red; Mask 30 meter
Predict 5 Red; Green; Blue; Mask 30 meter
Predict 6 Red; Green; Blue; Mask 25 meter
Predict 7 Red; Green; Blue; Mask 20 meter
Predict 8 Red; Green; Blue; Mask 15 meter
Predict 9 Red; Green; Blue; Mask 10 meter
Table 1. Parameters in GWR Model
Figure 6. Flowchart of the Proposed Method Aerial photos
Pixel value of visible bands
Mask value from image classification
LiDAR points
Extraction
Height
Pixel value
GWR
Independent variables
Dependent variable Predicted height of points
Coefficient raster
Raster algebra
Predicted height of pixel
Height filter
Detected buildings
Raster to polygon Bandwidth
4. RESULT AND EVALUATION
The model performance statistics are reported in Table 2. It shows that with more independent variables and shorter neighbor bandwidths, the GWR model can explain more variations of the heights and thus generates good fit. The residual is reduced and the Akaike Information Criterion (AIC) is improved in Table 2 when more variables are employed and a shorter bandwidth is applied. The prediction with the mask value only (Predict1) produce similar results as those by single band value (Predict2) when the same bandwidth distance is specified.
The R square of Predict 9 reaches the highest when the height of the pixel is predicted based on all four of the independent variables and the neighborhood bandwidth is only10 meters. This is because the pixels located at a shorter distance will have a higher similarity in brightness value and higher probability that they belong to the same building surface, thus gaining similar height values.
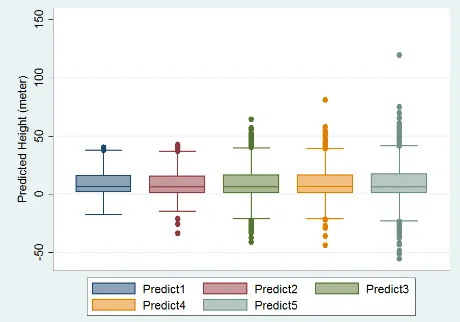
However, as the neighborhood bandwidth is reduced, the effective neighbors with known building heights are decreased and more extreme height values are predicted by the model. A sensitivity analysis was carried out to examine the role of
bandwidth size and the choice of independent variables. Results are shown in Figure 7. For example, in the Predict 1 model which has only one explanatory variable and a bandwidth of 30 meters, the predicted height ranges from 0 to 39 meters, and no extreme height value is beyond 50 meters. As shown in Figure 7(a), adding more explanatory variables leads to more extreme values of predicted heights. The highest value is greater than 100 meters by the Predict 5 model. Similarly, shorter bandwidth size also cause more extreme values to appear, as shown in Figure 7(b). Some extreme height values even approach as high as 400 meters. Those extreme height values will become the noise pixels and should be filtered in the following building classification and 3D model construction.
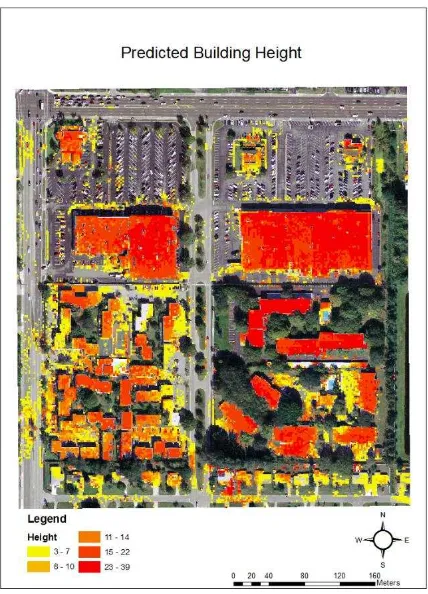
Due to the page limitation, only the result from Predict 5 is presented in this paper. Since a building is normally higher than 3 meters, those pixels whose predicted height is less than 3 meters are filtered (Figure 8). A 3D model of the buildings is constructed (Figure 9). Comparing with the unsupervised classification results (Figure 4), most buildings are successfully distinguished from the road segments by the GWR prediction (Figure 8). In addition, the different structure of the building roofs can be distinguished from the 3D model (Figure 9).
(a). Predicted heights by models with increasing number of independent variables (from left to right) and the same bandwidth size
(b). Predicted heights by models with decreasing bandwidth size (from left to right) and the constant independent variables
Figure 7 Predicted Height Values from Different GWR Model Structures
Residual Squares Effective Number AIC R2 Adjusted R2
Predict1 105,992.80 456.61 14,441.34 0.56 0.44
Predict2 105,839.68 454.55 14,449.69 0.57 0.44
Predict3 21,120.59 134.73 2,570.61 0.60 0.32
Predict4 76,889.58 444.96 10,256.27 0.52 0.29
Predict5 4,717.33 26.86 479.93 0.61 0.25
Predict6 2,776.48 24.83 397.85 0.67 0.28
Predict7 1,977.75 22.99 346.90 0.66 0.12
Predict8 513.78 15.36 257.03 0.78 0.11
Predict9 91.49 9.53 670.23 0.94 0.61
Figure 8. The Predicted Building Height
Figure 9. 3D View of the Detected Buildings
Some pixels of road segments still fail to be filtered since their colors are identical to that of the nearby building surface and they are located close to a tree that may cause a higher predicted height. Those pixels could be further calibrated if a building area criterion is applied or a near infrared band image is adopted.
The results of the detected buildings from the LiDAR data only and those from the GWR model are compared with the manually interpreted results to evaluate their accuracy. As shown in Table 3, GWR-method outperforms the LiDAR data classification in two aspects. First, its overall accuracy (dividing the total correct pixels by the total number of pixels (Congalton, 1991)) is slightly better although both methods present pretty good overall accuracy. Second and most dramatically, results from the proposed GWR-based method shows a much higher agreement with the ground truth data as suggested by the much higher Kappa coefficient. This higher agreement is also confirmation by a visual comparison as shown in Figure 10. Therefore, in
conclusion, the GWR-based height prediction method produces a better result of the building detection than the classification of LiDAR data only. The accuracy evaluation for the image classification is not conducted because the image classification cannot distinguish the road segments from the building at all.
Overall Accuracy
Kappa Coefficient
GWR Result 0.87 0.64
LiDAR Data Only 0.81 0.11
Table 3. Accuracy Evaluation
Figure 10. Predicted Buildings by Different Methods
5. CONCLUSION
LiDAR data classification for building extraction requires high-quality data and sophisticated methods. These have constrained the utilization of sparse LiDAR points for building detection in urban environments. Aerial photo classification, on the other hand, cannot distinguish road surfaces from building roofs. This paper presents a hybrid GWR-based height estimation method for building detection from sparse LiDAR points and aerial photos.
a very promising method and can be applied widely when a fast and automatic processing of building detection needed. However, we do recognize that some road segments are still mistakenly estimated as buildings due to their similarity in spectral characteristics to the nearby building surface and the intervention of surrounding trees. Such ‘noises’ can be further filtered by adopting near inferred images or introducing building area criteria. Other methods for overcoming the problem can be further explored.
The GWR-based building detection method is simple and effective. Comparing with the traditional building extraction method, the GWR model require less human intervention and produce outputs with equivalent or even higher accuracy. The GWR-based method can be applied for automatic detection of buildings where high quality data are unavailable or a simple method is demanded.
6. REFERENCE
Alexander, C., S. Smith-Voysey, C. Jarvis, and K. Tansey. 2009. Integrating building footprints and LiDAR elevation data to classify roof structures and visualise buildings. Computers, Environment and Urban Systems 33 (4):285–292.
Awrangjeb, M., M. Ravanbakhsh, and C. S. Fraser. 2010. Automatic detection of residential buildings using LIDAR data and multispectral imagery. ISPRS Journal of Photogrammetry and Remote Sensing 65:457–467.
Congalton, R. G. 1991. A review of assessing the accuracy of classifications of remotely sensed data. Remote sensing of environment 37 (1):35–46.
Hoalst-Pullen, N., and M. W. Patterson. 2011. Applications and Trends of Remote Sensing in Professional Urban Planning. Geography Compass 5 (5):249–261.
Jiang, L., M. Liao, H. Lin, and L. Yang. 2009. Synergistic use of optical and InSAR data for urban impervious surface mapping: a case study in Hong Kong. International Journal of Remote Sensing 30 (11):2781–2796.
Kabolizade, M., H. Ebadi, and S. Ahmadi. 2010. An improved snake model for automatic extraction of buildings from urban aerial images and LiDAR data. Computers, Environment and Urban Systems 34 (5):435–441.
Malpica, J. A., M. C. Alonso, F. Papi, A. Arozarena, and A. M. D. Agirre. 2013. Change detection of buildings from satellite imagery and lidar data. International Journal of Remote Sensing 34 (5):1652–1675.
Overwatch Systems, Ltd. 2013. LIDAR Analyst. https://www.overwatch.com/products/geospatial/lidar_analyst (last accessed 25 April 2014).
Rutzinger, M., A. K. Pratihast, S. J. Oude Elberink, and G. Vosselman. 2011. Tree modelling from mobile laser scanning data-sets. Photogrammetric Record 26 (135):361–372.
Smith, M. de, P. Longley, and M. Goodchild. 2011. Geospatial Analysis: A comprehensive guide 3 edition. The Winchelsea Press.
Soergel, U., K. Schulz, U. Thoennessen, and U. Stilla. 2005. Integration of 3D data in SAR mission planning and image interpretation in urban areas. Information Fusion 6 (4):301–310.
Stojanova, D., P. Panov, V. Gjorgjioski, A. Kobler, and S. Džeroski. 2010. Estimating vegetation height and canopy cover from remotely sensed data with machine learning. Ecological Informatics 5 (4):256–266.
Weng, Q. 2012. Remote sensing of impervious surfaces in the urban areas: Requirements, methods, and trends. Remote Sensing of Environment 117 (0):34–49.
Wu, K., and H. Zhang. 2012. Land use dynamics, built-up land expansion patterns, and driving forces analysis of the fast-growing Hangzhou metropolitan area, eastern China (1978– 2008). Applied Geography 34 (0):137–145.
You, H., and S. Zhang. 2006. 3D building reconstruction from aerial CCD image and sparse laser sample data. Optics and Lasers in Engineering 44 (6):555–566.
Yu, B., H. Liu, J. Wu, Y. Hu, and L. Zhang. 2010. Automated derivation of urban building density information using airborne LiDAR data and object-based method. Landscape and Urban Planning 98 (3–4):210–219.