Economics Letters 69 (2000) 285–288
www.elsevier.com / locate / econbase
Mean reversion in the real exchange rates
a,b ,
*
Luis A. Gil-Alana
a
¨
¨ ¨
Humboldt Universitat zu Berlin, Institut f ur Statistik und Okonometrie, Berlin, Germany
b
Department of Economics, University of Navarre, Pamplona, Spain
Received 16 June 1999; accepted 30 May 2000
Abstract
Robinson’s [J. Am. Stat. Assoc. 89 (1994) 1420] fractionally-based tests for unit roots and other hypotheses are applied to real exchange rate data between U.S. and five industrialized countries. The results indicate that the series are fractionally integrated with mean reversion if the disturbances are autocorrelated. 2000 Elsevier Science S.A. All rights reserved.
Keywords: Fractional integration; Real exchange rates; Mean reversion
JEL classification: C22
1. Introduction
The work on fractional differencing suggests that many macroeconomic time series might be modelled as I(d ) processes where d can be any real number (see, e.g. Diebold and Rudebusch, 1989; Sowell, 1992; Gil-Alana and Robinson, 1997, etc.). A series is said to be I(d ) if it becomes I(0) after
d
applying the difference operator (12L ) , which can be defined in terms of its binomial expansion as
`
d(d21)
d
d j j ]]] 2
(12L ) 5
O
(21)S D
j L 512dL1 L 2 ? ? ?2!
j50
This type of process belongs to the class of long-memory processes, so-named for their ability to display significant dependence between observations widely separated in time, as opposed to I(0) or short-memory processes, where autocorrelations decay fairly rapid. The distinction between I(d ) processes with different values of d is also important from an economic point of view: If d belongs to the interval (0, 0.5), the process is stationary and mean-reverting; if d belongs to [0.5, 1) is
*Corresponding author. Tel.: 149-3020-935-725; fax: 149-3020-935-712. E-mail address: [email protected] (L.A. Gil-Alana).
286 L.A. Gil-Alana / Economics Letters 69 (2000) 285 –288
nonstationary but still mean reverting, while d$1 means nonstationary and non-mean-reverting. Thus, allowing fractional differencing, we can study a wide range of mean reverting behaviours. In this paper we present some results concerning fractional differencing in the real exchange rate market, using Robinson’s (1994) univariate tests. These tests are briefly described in Section 2. Section 3 applies the tests to historical annual data of real exchange rates between U.S. and five industrialized countries for the 1914–1983 period, using the same dataset as in Cheung and Lai (1993). Section 4 contains some concluding remarks.
2. Tests of fractional integration
Robinson (1994) proposes a very general testing procedure for testing unit roots and other hypotheses in raw time series. Unlike most of unit root tests embedded in autoregressive alternatives, Robinson’s (1994) tests are nested in a fractionally integrated model,
d1u
(12L ) xt5u ,t t51,2, . . . (1)
xt50, t#0, (2)
where d is a given real number; u is an I(0) process with parametric density function f of formt
2 series we observe from t51,2, . . . n. Thus, under the null hypothesis,
H :0 u50 (3)
d
˜
x in (1) is I(d ) and the residuals are ut t5(12L ) x .t
Unless g is a completely known function (e.g., g;1, as when u is white noise) we have to estimatet
2 q
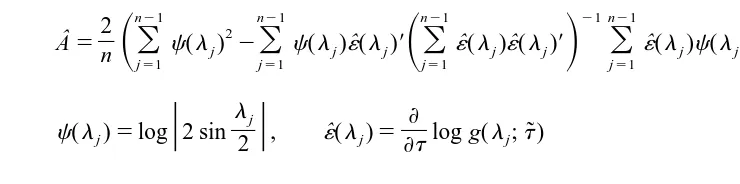
The test statistic, which is derived from the Lagrange multiplier principle is:
L.A. Gil-Alana / Economics Letters 69 (2000) 285 –288 287
n21 n21 n21 21 n21
2 2
ˆ ] ˆ ˆ ˆ ˆ
A5
S
O
c(lj) 2O
c(lj)´(lj)9S
O
´(lj)´(lj)9D
O
´(lj)c(lj)9D
,n j51 j51 j51 j51
lj ≠
U
]U
ˆ ] ˜c(lj)5log 2 sin , ´(lj)5 log g(lj;t)
2 ≠t
.
Robinson (1994) established under regularity conditions that
ˆr→N(0, 1) as n→` d
and thus, an approximate one-sided 100a% test of (3) against the alternative u.0 rejects Ho if
ˆr.z where the probability that a standard normal variate exceeds z isa a a. Conversely, a test of (3)
ˆ
againstu,0 rejects H if ro , 2z . He also showed that the tests are efficient in the Pitman sense,a
21 / 2
that when directed against local alternatives: H :u5dn ford±0, the limit distribution is Normal a
with variance 1 and mean which cannot be exceeded in absolute value by that of any rival regular statistic. Thus, we are under standard situations, unlike most of tests for unit roots where a nonstandard limit distribution and lack of efficiency theory is obtained. A diskette containing the FORTRAN codes for the tests is available from the author on request.
3. The real exchange rates
The data examined are real exchange rates for the period 1914–1989 taken from Cheung and Lai (1993). We look at five bilateral intercountry relations between the U.S. as the home country and Canada, UK, Japan, France and Italy as the foreign countries. We will employ throughout the model (1) and (2), testing (3) for different hypothesized values of d, from 0 through 2.25 with 0.25 increments, and modelling the I(0) disturbances as white noise and autoregressions of orders from 1 to 5.
ˆ
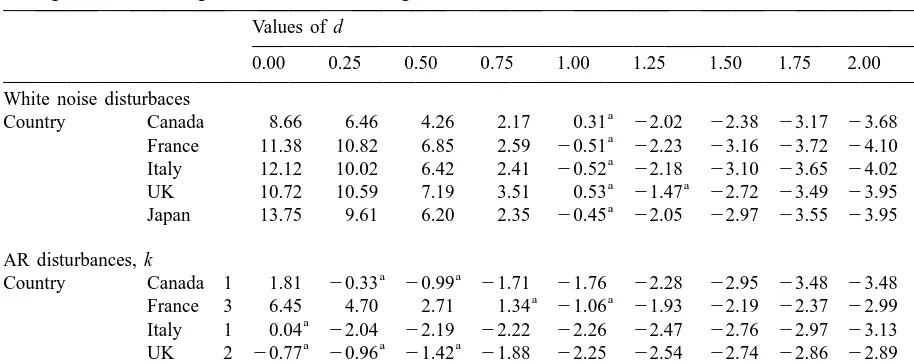
Table 1 resumes the results of r in (4). Assuming white noise disturbances, we observe that the unit root null hypothesis is never rejected, and the only extra non-rejection value occurs for the UK when
d51.25. However, assuming AR(k) disturbances, we see several non-rejections with d,1. Presenta-tion of all the results in this context of weakly autocorrelated disturbances would take up a lot of space. Thus, we present only a subset of them, with a single k for each country across all d, and
ˆ
choosing the k for each series which produces the smallest value of uru across d. This enables better comparisons with the case of white noise disturbances and indicates the strongest support for any one
ˆ
288 L.A. Gil-Alana / Economics Letters 69 (2000) 285 –288
Table 1
Testing the order of integration in the real exchange rate market Values of d
0.00 0.25 0.50 0.75 1.00 1.25 1.50 1.75 2.00 2.25 White noise disturbaces
a
Country Canada 8.66 6.46 4.26 2.17 0.31 22.02 22.38 23.17 23.68 24.00
a
France 11.38 10.82 6.85 2.59 20.51 22.23 23.16 23.72 24.10 24.36
a
Italy 12.12 10.02 6.42 2.41 20.52 22.18 23.10 23.65 24.02 24.29
a a
UK 10.72 10.59 7.19 3.51 0.53 21.47 22.72 23.49 23.95 24.25
a
Japan 13.75 9.61 6.20 2.35 20.45 22.05 22.97 23.55 23.95 24.23 AR disturbances, k
a a
Country Canada 1 1.81 20.33 20.99 21.71 21.76 22.28 22.95 23.48 23.48 23.84
a a
France 3 6.45 4.70 2.71 1.34 21.06 21.93 22.19 22.37 22.99 23.12
a
Italy 1 0.04 22.04 22.19 22.22 22.26 22.47 22.76 22.97 23.13 23.32
a a a
UK 2 20.77 20.96 21.42 21.88 22.25 22.54 22.74 22.86 22.89 22.89
a a a
Japan 1 0.42 20.23 20.05 21.98 22.14 22.65 22.98 23.23 23.47 23.69
a
Non-rejection values of the null hypothesis (3) at the 95% significance level.
4. Conclusions
We can conclude by saying that mean reverting behaviour is observed in the real exchange rate series in all the countries when the disturbances are weakly autocorrelated. The real exchange rate in France seems to be the most nonstationary series, followed by Canada, Japan and the UK, whereas the exchange rate in Italy seems to be the most stationary one, with short memory behaviour.
Acknowledgements
I wish to thank Y.W. Cheung and K.S. Lai for providing the data. Financial support from the European TMR Grant No. ERBFMRFF-CT-98-0213 is also gratefully acknowledged.
References
Cheung, Y.-W., Lai, K.S., 1993. A fractional cointegration analysis of purchasing power parity. Journal of Business and Economic Statistics 11, 103–111.
Diebold, F.X., Rudebusch, G.D., 1989. Long memory and persistence in aggregate output. Journal of Monetary Economics 24, 189–209.
Gil-Alana, L.A., Robinson, P.M., 1997. Testing of unit roots and other nonstationary hypotheses in macroeconomic time series. Journal of Econometrics 80, 241–268.
Robinson, P.M., 1994. Efficient tests of nonstationary hypotheses. Journal of the American Statistical Association 89, 1420–1437.