Phil Lewis, Ph.D., P.E. Assistant Professor
School of Civil and Environmental Engineering Oklahoma State University
Stillwater, OK 74078
Telephone 405-744-5207, Fax 405-744-7554 Email [email protected]
Heni Fitriani, Ph.D.
University of Sriwijaya (Indonesia) Email [email protected]
Yongwei Shan, Ph.D., P.E. Assistant Professor
School of Civil and Environmental Engineering Oklahoma State University
Stillwater, OK 74078
Telephone 405-744-5207, Fax 405-744-7554 Email [email protected]
Submitted for Presentation at the 2015 AASHTO/TRB Conference on Transportation Infrastructure Maintenance and Operations
ABSTRACT
INTRODUCTION
Infrastructure maintenance operations and management are major activities of public equipment fleet owners. Their fleets consist of numerous units of nonroad heavy-duty diesel (HDD) equipment. These fleets consume large quantities of diesel fuel and thus emit large quantities of pollutants and greenhouse gases; thus, the energy and environmental impacts of maintenance operations are significant.
In the past, most fleet managers seldom concerned themselves with the environmental impact of their equipment, specifically air pollutant emissions. As new environmental regulations appear on the horizon, fleet managers can no longer afford to disregard the energy and environmental impacts of their work. They must be able to quantify the fuel use and emissions of their equipment in order to manage them. Furthermore, some fleet owners are investigating using alternative fuels, such as biodiesel, to reduce their dependence on traditional diesel fuel.
The objective of this paper is to compare the pollutant emissions rates of biodiesel and petroleum diesel (referred to simply as diesel) for HDD equipment used for highway maintenance operations. The primary research question for this paper is: Does biodiesel offer reductions in emissions of nitrogen oxides (NOx), hydrocarbons (HC), carbon monoxide (CO), carbon dioxide (CO2), and particulate matter (PM) compared to conventional diesel fuel when used in the same equipment? Specific research questions that are addressed include:
How do mass per time and mass per fuel used pollutant emissions rates compare for biodiesel versus diesel when categorized by equipment type?
How do mass per time and mass per fuel used emissions rates compare for biodiesel versus diesel when categorized by engine tier classification?
What is the percentage change (increase or decrease) in pollutant emissions rates for biodiesel versus diesel?
Background
According to the United States Environmental Protection Agency (EPA), there are approximately two million items of nonroad HDD construction and mining equipment in the United States (1). This equipment consumes about six billion gallons of diesel fuel annually. EPA also estimates that in 2005, HDD construction equipment emitted approximately 657,000 tons of nitrogen oxides (NOx), 1,100,000 tons of carbon monoxide (CO), and 63,000 tons of particulate matter (PM). Each of these pollutants is a criteria pollutant as designated by the EPA National Ambient Air Quality Standards (NAAQS) (2). Other pollutants found in diesel exhaust include hydrocarbons (HC), which is a precursor to ground level ozone (another NAAQS criteria pollutant). Although not a regulated pollutant, carbon dioxide (CO2) is perhaps the most recognized emission from HDD equipment because of its notoriety as a greenhouse gas and its potential global warming effect.
Another concern with diesel emissions is environmental justice. It is possible that many minority and disadvantaged populations may receive disproportionate impacts from diesel emissions (3).
Fleet owners are increasingly considering alternative fuels such as biodiesel to reduce their dependence on foreign oil and to mitigate the environmental impacts associated with traditional diesel fuel. In order to quantify and characterize both biodiesel and diesel emissions, real-world data are needed; however, most fuel use and emissions estimates are based on engine dynamometer data. Although engine dynamometer testing is a reliable source of data, it is performed in a laboratory setting and does not accurately represent the episodic nature of real-world equipment activity. The data presented in this paper are based on real-real-world data collected from in use HDD equipment by an on-board portable emissions measurement system (PEMS).
Scope
The equipment of interest in this paper includes backhoes, motor graders, and wheel loaders. These types of equipment were selected because they are often used for many highway maintenance operations and are frequently the most represented units in a highway maintenance fleet. The case study equipment fleet was owned by the North Carolina Department of Transportation (NCDOT). The fleet was observed performing activities such as light grading, fine grading, excavating, and hauling materials for highway maintenance operations. Real-world fuel use and emissions data were collected for this equipment for both B20 biodiesel and diesel fuels.
RELATED WORK
The most prominent and well-documented dataset of real-world fuel use and emissions measurements from off-road HDD equipment was developed by researchers at North Carolina State University (NC State) from 2005 through 2008. This dataset is widely considered to be the largest publicly-available source of real-world fuel use and emissions data for nonroad construction equipment. The research team utilized PEMS testing to collect, analyze, and characterize real-world engine, fuel use, and emissions data from over thirty items of HDD equipment. The equipment types included backhoes, bulldozers, excavators, motor graders, off-road trucks, track loaders, and wheel loaders. For 15 items of equipment, the team made comparisons of pollutant emissions for petroleum diesel versus B20 biodiesel.
Numerous papers were published based on the aforementioned dataset. Lewis et al. (4)
This paper also compared emission rates for the different EPA engine tier standards of the equipment.
Lewis et al. (8-10) published a series of papers on the impacts of idling on equipment fuel use and emission rates. These papers quantified the change in total activity fuel use and emissions as the ratio of idle time to non-idle time changes. The major finding was that total fuel use and emissions for an activity increases as equipment idle time increases. Ahn et al.(11) used the dataset and previous studies to develop an integrated framework for estimating, benchmarking, and monitoring pollutant emissions from construction activities. Hajji and Lewis
(12) developed a productivity-based estimating tool for fuel use and air pollutant emissions for nonroad construction equipment performing earthwork activities. The methodology for the field data collection in these studies using a PEMS is well-documented by Rasdorf et al.(13). Frey et
al. (14-15) also outlined the methods and procedures for collecting and analyzing data for
construction equipment activity, fuel use, and emissions; thus, the methodology may be easily duplicated by those with the necessary expertise and implementation.
METHODOLOGY
This section addresses the research approach that was used to develop the dataset of fuel use and emissions rates of HDD maintenance equipment. Fifteen units of equipment including five backhoes, six motor graders, and four wheel loaders were tested under real-world conditions as they performed highway maintenance operations. Each unit of equipment was tested once with diesel fuel and once with B20 biodiesel; thus, a one-to-one comparison of the two fuel types under similar conditions was possible. The field data collection procedures are described. A discussion of the equipment engine attributes for the case study fleet is provided. The analysis methods for developing the fuel use and emissions rates are presented.
Field Data Collection
The basis of the field data collection efforts was an on-board portable emissions measurment system (PEMS) that was used to gather engine, fuel use, and emissions data directly from in-use HDD equipment. The PEMS was secured to the body of the equipment and sensors were connected to the engine to collect engine performance data related to engine speed, intake air temperature, and engine load. Exhaust sample probes were inserted into the tailpipe of the equipment to collect emissions data for NOx, HC, CO, and PM. All of these data were collected on a second-by-second basis, thus providing a high resolution timeline of engine performance, fuel use, and emissions data. A minimum of three hours of second-by-second data were targeted for collection from each item of equipment that was tested.
When the original field data (referred to as “raw data”) had been collected, it underwent a rigorous quality assurance process to determine whether any errors or problems existed, such as unusual engine performance values or negative emissions values. If any errors were found, they were corrected when possible. If the errors could not be corrected, then the data were deemed invalid and removed from the dataset. The purpose of the quality assurance process was to produce a valid set of data (referred to as “processed data”) for analyzing engine performance, fuel use, and emissions for each item of equipment.
Engine Attributes
consume more fuel and thus produce more emissions. Engine size was represented by the engine’s rated horsepower and the engine displacement. This information was collected in the field from the engine itself and was verified with the engine manufacturer’s specifications.
As engines increase in age, their performance may deteriorate and they may use more fuel at a partial load than they would have previously at full load (16). Consequently, engines may produce more emissions as they get older. Engine age was represented by the engine model year, which is the year that the engine was manufactured. Engine hours of operation are another attribute that can be used to measure engine age; however, insufficient data was collected for engine hours and therefore is not reported.
Engine tier is a hybrid attribute based on engine size and engine age. Tier classifications are based on the horsepower rating and the model year of the equipment’s engine. Engine tiers are emissions standards adopted by the EPA in 1994 for all new nonroad diesel engines (17). Diesel engines manufactured after a specified date must meet the performance levels specified in the standards. The EPA engine tier classifications include successive Tier 1, Tier 2, Tier 3, Tier 4 Transitional, and Tier 4 Final, which are effective in reducing emissions in a phased sequence from 1996 to 2013.
Engine performance affects the fuel use and emissions rates of construction equipment. The PEMS collected second-by-second engine data through a sensor array that was connected to the equipment’s engine. The variables that were monitored included engine speed measured in revolutions per minute (RPM), engine intake air temperature (IAT) measured in Celsius degrees (°C), and pressure-based engine load measured by manifold absolute pressure (MAP) in units of kilopascals (kPa).
Average Emissions Rates
Second-by-second equipment fuel use was computed by the PEMS on a mass per time basis of grams per second (g/s), based on the measured engine variables and exhaust composition. The average fuel use for each item of equipment was reported in units of gallons of fuel used per hour (gal/h). The PEMS also measured the second-by-second emissions rate of each pollutant on a mass per time basis of grams per second (g/s). The average mass per time emissions rate of each pollutant for each item of equipment was reported in units of grams per hour (g/h). The mass per fuel used emissions rates were established by a carbon balance based on the exhaust composition and the fuel properties. The average of the mass per fuel used emissions rates for each item of equipment was reported in units of grams per gallon of fuel used (g/gal).
The mass per time and mass per fuel used emissions rates were categorized according to equipment type and also according to engine tier. Emissions rates categorized by equipment type are useful because they are based on similar duty cycles. Emissions rates based on engine tier are useful because they are based on engine manufacturing specifications aimed at reducing emissions. The percentage change in average emissions rates for B20 biodiesel versus diesel were computed for each of the 15 items of equipment on both a mass per time and mass per fuel used basis.
RESULTS
Field Data Collection
Overall, almost 45 hours of data were collected for the case study equipment fueled with diesel. This included approximately 12 hours for backhoes (BH), 17 hours for motor graders (MG), and 16 hours for wheel loaders (WL). Approximately 48 hours of data were collected from the same items of equipment fueled with B20 biodiesel including about 16 hours for each of the three equipment types. These values represent approximately 90% of the total raw data that remained after the quality assurance process.
The PEMS measured accurate emissions for NOx, CO, and CO2. The emissions rates of these pollutants are of the same magnitude of those found in other data sources, such as the EPA NONROAD model (1). The HC data tend to be biased low and the reported emissions rates may be low by a factor of two. The PM detection method for the PEMS is analogous to opacity. The field measurements are useful for relative comparisons of PM emissions rates for different fuels, equipment types, or engine tier but not for characterization of the absolute magnitude of PM emissions. The PM data reported here could be low by an order of magnitude according to previous comparisons of the opacity-based measurements to other PM data. Batelle (18)
provides a detailed evaluation of the reporting accuracy of the PEMS used for this data collection effort.
Engine Attributes
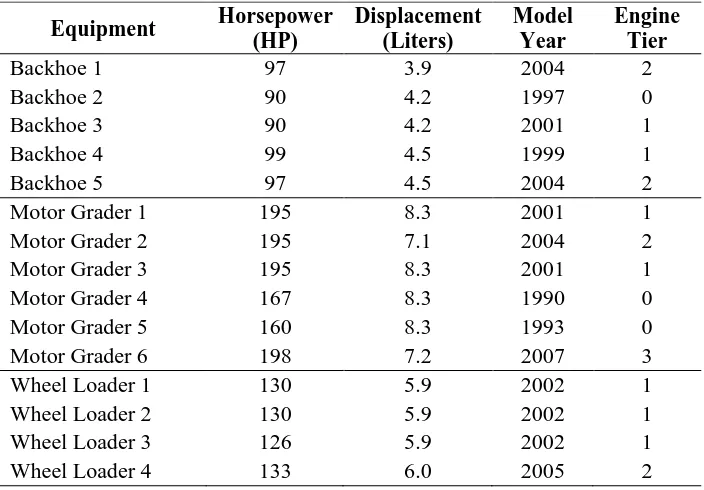
Table 1 summarizes the HDD equipment specifications and the quantity of data that was collected for each item of equipment. Engine tier refers to the EPA regulation imposed on engine manufacturers aimed at reducing emission rates of NOx, HC, CO, and PM. There were three Tier 0 units, seven Tier 2 units (almost half of the case study fleet), four Tier 2 units, and only one Tier 3 unit (MG 6). The horsepower rating and displacement values were quantitatively similar for all items in a particular equipment type. For example, all backhoes were in the 90-100 hp range, all motor graders were in the 160-200 hp range, and all wheel loaders were in the 125-130 hp range. The model years ranged from 1990 (MG 4) to 2007 (MG 6).
Average Emissions Rates
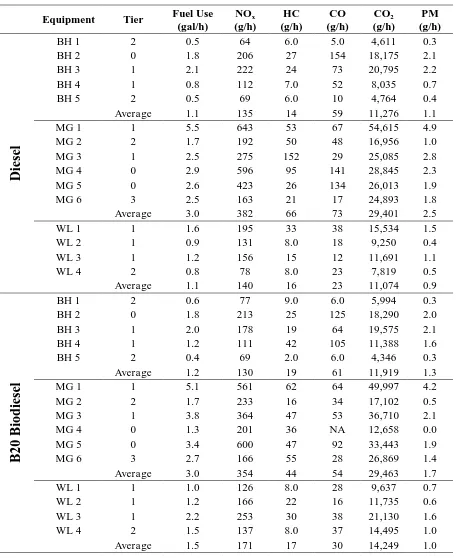
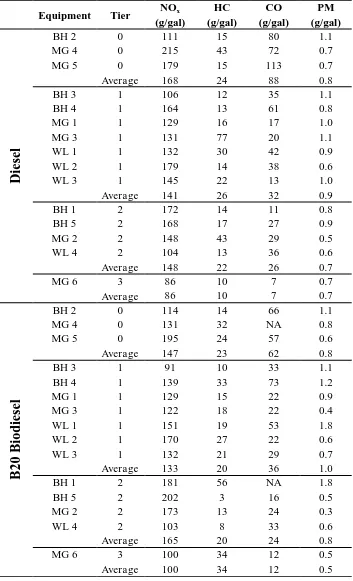
Table 2 summarizes the mass per time average emissions rates by equipment type for both diesel and B20 biodiesel. For both fuel types, motor graders had the highest average emissions of all pollutants. The only exception was that backhoes had the highest average emissions rate of CO when fueled with B20 biodiesel. In most cases, the average emissions rates for backhoes and wheel loaders were quantitatively similar. It should also be noted that motor graders had the highest average horsepower rating (185 hp), displacement (7.9 liters), and fuel use (3.0 gal/h) of the three equipment types. This finding indicates that equipment with larger engines consume more fuel and emit more pollutants over a specified timescale and it holds true for both diesel and B20 biodiesel.
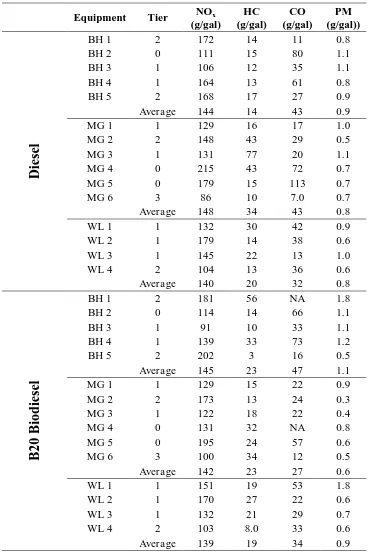
duty cycles that may impose episodic or unstable engine loads on the equipment. Although not shown specifically in Table 3, the average mass per fuel used emissions rate for CO2 for diesel was approximately 9,900 g/gal (+/- 2%) and approximately 9,700 g/gal (+/- 5%) for B20 biodiesel.
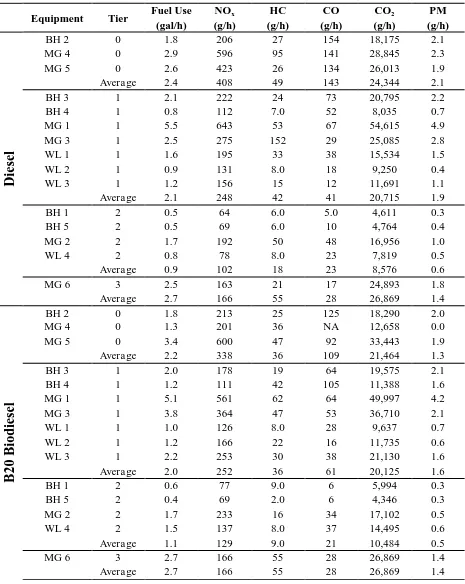
Perhaps a better way to categorize and compare emissions rates for different equipment types is by engine tier. Categorizing by engine tier allows comparison of equipment with engines that have the same EPA emissions standards. Tables 4 and 5 summarize the mass per time and mass per fuel used emissions rates by engine tier, respectively. For most pollutants, the average emissions rate for each pollutant decreases as the engine tier increases on both a mass per time and a mass per fuel used basis for both diesel and B20 biodiesel. This finding implies that the EPA engine tier standards have been effective in reducing emissions from nonroad HDD equipment; however, there are some interesting deviations in this finding. In Table 4 (mass per time), there is no change in B20 biodiesel average emissions of HC from Tier 0 to Tier 1. There is also a slight increase in B20 biodiesel average emissions of PM from Tier 0 to Tier 1. Notice that the Tier 3 emissions of all pollutants for both diesel and B20 biodiesel are higher than the average Tier 2 emissions; however, the Tier 3 emissions rates are based on only one item of equipment (MG 6). Similar findings are recognized in Table 5 (mass per fuel used). For both diesel and B20 biodiesel, there is an increase in average NOx emissions from Tier 1 to Tier 2. Likewise, there is very little change in PM emissions among tiers for both fuel types.
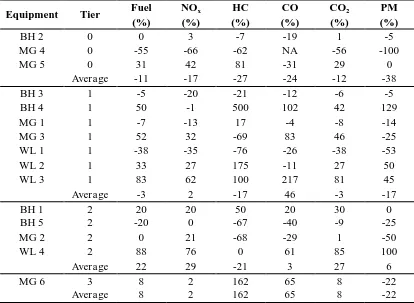
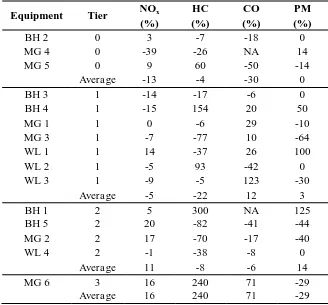
Tables 6 and 7 compare average emissions rates of B20 biodiesel to diesel on a mass per time and mass per fuel used basis, respectively. The results are categorized by engine tier. For these tables, a positive number indicates the percentage increase in the emissions rate of B20 biodiesel relative to the diesel emissions rate; a negative number represents the percentage decrease in the B20 biodiesel emissions rate relative to the diesel emissions rate. In Table 6 (mass per time), B20 biodiesel for Tier 0 has reduced emissions on average for all pollutants compared to diesel. This is not the case, however, for Tiers 1-3. For Tier 1, B20 biodiesel has reduced emissions for HC, CO2, and PM but an increase in emissions of NOx and CO. For Tier 2, B20 biodiesel has reduced emissions for HC only but increased emissions for the other pollutants. In Table 7 (mass per fuel used), B20 biodiesel has reduced emissions on average for all pollutants except PM, which shows no change compared to the diesel emissions rate. For Tier 1, B20 biodiesel shows reduced emissions on average for NOx and HC but increased emissions for CO and PM. For Tier 2, B20 biodiesel shows reduced emissions for HC and CO but increased emissions for NOx and PM. In both Tables 6 and 7, B20 biodiesel shows increased emissions on average for all Tier 3 pollutants except for PM; however, this is based on one item of equipment.
CONCLUSIONS AND RECOMMENDATIONS
The primary conclusion of this paper is that B20 biodiesel does offer a reduction in pollutant emissions rates compared to diesel in some cases. For the 15 items of equipment that were tested, B20 biodiesel resulted in either a reduction or no change in the mass per fuel used emissions rate of NOx for eight equipment units. For HC, a reduction occurred in 10 equipment units. For CO, a reduction occurred in seven units. For PM, a reduction or no change occurred in 10 units. In general, B20 biodiesel showed emissions reductions in about half of the equipment that was tested; thus, B20 biodiesel does have potential to reduce the environmental impact of highway maintenance equipment fleets.
The work presented here provides a solid foundation for developing a benchmarking dataset of fuel use and emissions information for HDD maintenance equipment; however, more research needs to be done. The research that produced these results must be continued to observe more equipment of the same type in order to refine the current data and also gather data from other non-represented equipment types. The equipment that was observed represents a range of engine attributes related to engine size, engine age, and engine tier; however, large populations of equipment exist outside of these ranges. Additional data must be collected from equipment outside of these ranges to represent more of the total maintenance equipment population. As this data is collected, the benchmarking dataset will grow and provide a useful tool for fleet managers to use to make informed decisions regarding the energy and environmental impacts of their fleets.
ACKNOWLEDGEMENT
REFERENCES
1. EPA. “User’s Guide for the Final NONROAD 2005 Model,” United States Environmental Protection Agency, EPA420-R-05-013, Washington, DC, 2005.
2. EPA. “National Ambient Air Quality Standards (NAAQS),” United States Environmental Protection Agency, www.epa.gov/air/criteria. Information viewed on October 27, 2014. 3. EPA. “National Clean Diesel Campaign: Basic Information,” United States Environmental
Protection Agency, www.epa.gov/cleandiesel/basicinfo. Information viewed on October 27, 2014.
4. Lewis, P., Rasdorf, W., Frey, H.C., Pang, S-H., and Kim, K., "Requirements and Incentives for Reducing Construction Vehicle Emissions and Comparison of Non-road Diesel Engine Emissions Sources," Journal of Construction Engineering and Management, American Society of Civil Engineers, 135 (5), 341-351, 2009.
5. Lewis, P., Frey, H.C., and Rasdorf, W., "Development and Use of Emissions Inventories for Construction Vehicles," Transportation Research Record: Journal of the Transportation Research Board, National Research Council, Washington, D.C., 2123, 46-53, 2009.
6. Frey, H.C., Rasdorf, W., and Lewis, P., “Comprehensive Field Study of Fuel Use and Emissions of Nonroad Diesel Construction Equipment,” Transportation Research Record: Journal of the Transportation Research Board, National Research Council, Washington, DC, 2158, 69-76, 2010.
7. Frey, H.C., Rasdorf, W., Kim, K., Pang, S-H., and Lewis, P., "Comparison of Real World Emissions of Backhoes, Front-End Loaders, and Motor Graders for B20 Biodiesel vs. Petroleum Diesel and for Selected Engine Tiers," Transportation Research Record: Journal of the Transportation Research Board, National Research Council, Washington, DC, 2058, 33-42, 2008.
8. Lewis, P., Rasdorf, W., Frey, H.C., Leming, M., "Effects of Engine Idling on NAAQS Criteria Pollutant Emissions from Nonroad Diesel Construction Equipment," Transportation Research Record: Journal of the Transportation Research Board, National Research Council, Washington, DC, 2270, 67-75, 2012.
9. Lewis, P., Leming, M., and Rasdorf, W., “Impact of Idling on Fuel Use and CO2 Emissions of Nonroad Diesel Construction Equipment,” Journal of Management in Engineering Special
Issue: Engineering Management for Sustainable Development, American Society of Civil
Engineers, 28(1), 31-38, 2012.
10.Lewis, P., Leming, M., Frey, H.C., and Rasdorf, W., "Assessing the Effects of Operational Efficiency on Pollutant Emissions of Nonroad Diesel Construction Equipment," Transportation Research Record: Journal of the Transportation Research Board, National Research Council, Washington, DC, 2233, 11-18, 2011.
11.Ahn, C., Lewis, P., Golparvar-Fard, M. and Lee, S., “Toward an Integrated Framework for Estimating, Benchmarking, and Monitoring the Pollutant Emissions of Construction Operations,” Journal of Construction Engineering and Management Special Issue:
Sustainability in Construction, American Society of Civil Engineers, 139(12) A4013003,
12.Hajji, A. and Lewis, P., “Development of productivity-based estimating tool for energy and air emissions from earthwork construction activities,” Smart and Sustainable Built Environment, Emerald Group Publishing Limited, 2(1), 84-100, 2013.
13.Rasdorf, W., Frey, H.C., Lewis, P., Kim, K., Pang, S-H., and Abolhassani, S., "Field Procedures for Real-World Measurements of Emissions from Diesel Construction Vehicles," Journal of Infrastructure Systems, American Society of Civil Engineers, 16 (3), 216-225, 2010.
14.Frey, H. C., Rasdorf, W., Pang, S. H., Kim, K., Abolhasani, S., and Lewis, P., “Methodology for Activity, Fuel Use, and Emissions Data Collection and Analysis for Nonroad Construction Equipment,” Proceedings of the Air and Waste Management Association Annual Conference, AWMA, Pittsburgh, PA, 2007.
15.Frey, H.C., Rasdorf, W., Pang, S., Kim, K., and Lewis, P., "Methods for Measurement and Analysis of In-Use Emissions of Nonroad Construction Equipment," Proceedings of the EPA Emissions Inventory Conference, Environmental Protection Agency, Raleigh, NC, 2007. 16.Nichols, H. and D. Day. Moving the Earth: The Workbook of Excavation, The
McGraw-Hill Companies, Inc., New York, NY, 2005.
17.EPA. Exhaust and Crankcase Emission Factors for Nonroad Engine Modeling -Compression-Ignition. EPA-420-P-04-009, NR-009c, U.S. Environmental Protection Agency, Ann Arbor, MI, 2004.
18.Battelle. Environmental Technology Verification Report: Clean Air Technologies
LIST OF TABLES
TABLE 1 Summary of Equipment Attributes
TABLE 2 Mass per Time Emissions Rates by Equipment Type TABLE 3 Mass per Fuel Used Emissions Rates by Equipment Type TABLE 4 Mass per Time Emissions Rates by Engine Tier
TABLE 5 Mass per Fuel Used Emissions Rates by Engine Tier
TABLE 1 Summary of Equipment Attributes
Equipment Horsepower
(HP)
Displacement (Liters)
Model Year
Engine Tier
Backhoe 1 97 3.9 2004 2
Backhoe 2 90 4.2 1997 0
Backhoe 3 90 4.2 2001 1
Backhoe 4 99 4.5 1999 1
Backhoe 5 97 4.5 2004 2
TABLE 6 B20 Biodiesel vs. Diesel: Change in Mass per Time Emissions Rates (Percentage Increase or Decrease)
Equipment Tier Fuel Use NOx HC CO CO2 PM
(%) (%) (%) (%) (%) (%)
BH 2 0 0 3 -7 -19 1 -5
MG 4 0 -55 -66 -62 NA -56 -100
MG 5 0 31 42 81 -31 29 0
Average -11 -17 -27 -24 -12 -38 BH 3 1 -5 -20 -21 -12 -6 -5 BH 4 1 50 -1 500 102 42 129 MG 1 1 -7 -13 17 -4 -8 -14 MG 3 1 52 32 -69 83 46 -25 WL 1 1 -38 -35 -76 -26 -38 -53 WL 2 1 33 27 175 -11 27 50 WL 3 1 83 62 100 217 81 45 Average -3 2 -17 46 -3 -17
BH 1 2 20 20 50 20 30 0
BH 5 2 -20 0 -67 -40 -9 -25
MG 2 2 0 21 -68 -29 1 -50
WL 4 2 88 76 0 61 85 100
Average 22 29 -21 3 27 6
MG 6 3 8 2 162 65 8 -22
TABLE 7 B20 Biodiesel vs. Diesel: Change in Mass per Fuel Used Emissions Rates (Percentage Increase or Decrease)
Equipment Tier NOx HC CO PM
(%) (%) (%) (%)
BH 2 0 3 -7 -18 0
MG 4 0 -39 -26 NA 14
MG 5 0 9 60 -50 -14
Average -13 -4 -30 0 BH 3 1 -14 -17 -6 0 BH 4 1 -15 154 20 50
MG 1 1 0 -6 29 -10
MG 3 1 -7 -77 10 -64 WL 1 1 14 -37 26 100
WL 2 1 -5 93 -42 0
WL 3 1 -9 -5 123 -30 Average -5 -22 12 3
BH 1 2 5 300 NA 125
BH 5 2 20 -82 -41 -44 MG 2 2 17 -70 -17 -40
WL 4 2 -1 -38 -8 0