23
CHAPTER 4
RESULTS
4.1 Molecular Genetic Analysis of Indonesian LCA Patients
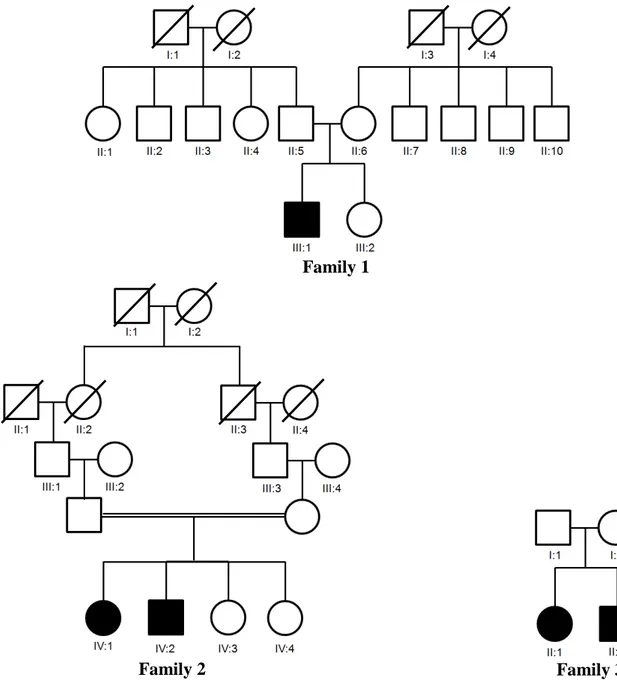
A total of 4 patients from three unrelated families were included in this study (Figure
7). Family II was consanguineous family with two affected family members. Patient II:2 (8
years old) in family 3 could not be participated in this study because his parents refused to
give their consent for this children.
Figure 7. Pedigrees of the families analyzed in this study. Three Indonesian families were participated in this study. Black square (male) and black circle (female) represent affected family member.
\
Family 1
24
4.1.1 Clinical Findings
All of the patients have a severe visual loss before the first year of life. Funduscopy
examination revealed retinal degeneration in all of them. Patients also developed sensory
nystagmus and amaurotic pupils. Moreover, Franceschetti oculo-digital sign were found in
three out of four patients. Patient number IV:1 and IV:2 from family 2 were also discovered to
have a deep-set eyes, probably due to this specific behavior.
4.1.2 Molecular Findings
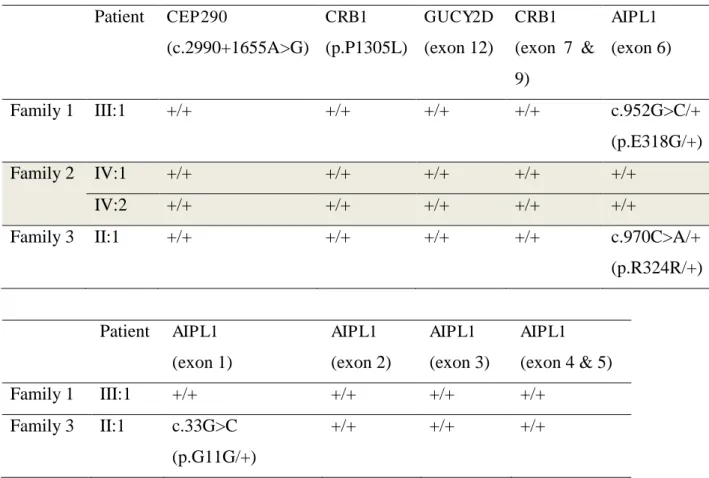
Table 6. Molecular findings of Indonesian LCA patients.
Patient CEP290 investigation in AIPL1 exon 1-5 identified another synonymous variant in AIPL1 exon 1.
The results for the ARMS PCR for c.2991+1655A>G mutation in CEP290 and
p.P1305L in CRB1 gene were wild-type. Sanger sequencing of exon 7 & 9 of CRB1 and exon
12 of GUCY2D only revealed wild-type variants. We discovered potential novel variant in
AIPL1gene, p.E318G and p.R324R in exon 6 of two patients. Subsequently, sequencing
performed in the remaining exons of AIPL1 gene (exon 1-5) uncovered new synonymous
25
in Table 6. The p.E318G mutation has a phyloP score of 4.64 and Grantham score of 29. The
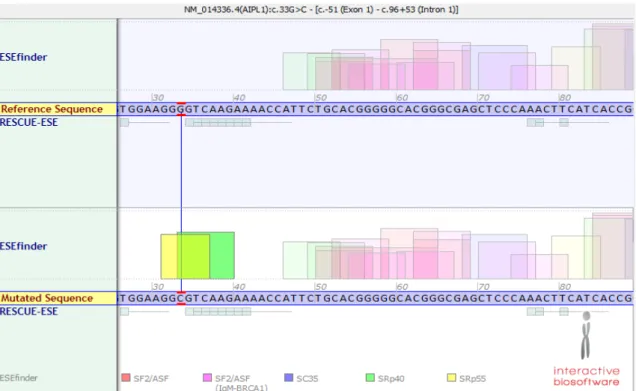
c.970C>A/p.R324R was predicted to diminish SC35 splicing protein and p.G11G mutation
was predicted to recruit splicing factors, thus creating a putative new splice site (Figure 8 &
9).
Figure 8. Splicing prediction for c.33G>C variant in AIPL1. Using Alamut software, it is predicted that this variant recruits SRp55 and SRp40 proteins.
26
Both c.33G>C and c.970C>A variants were further screened using RFLP in the ~190
Indonesian control sample. Although it seems that variant c.33G>C only appeared in the LCA
patients, confirmation study in the cDNA levels is needed. The result from c.970C>A RFLP
screening is inconclusive since many of the samples showed unspecific digested products.
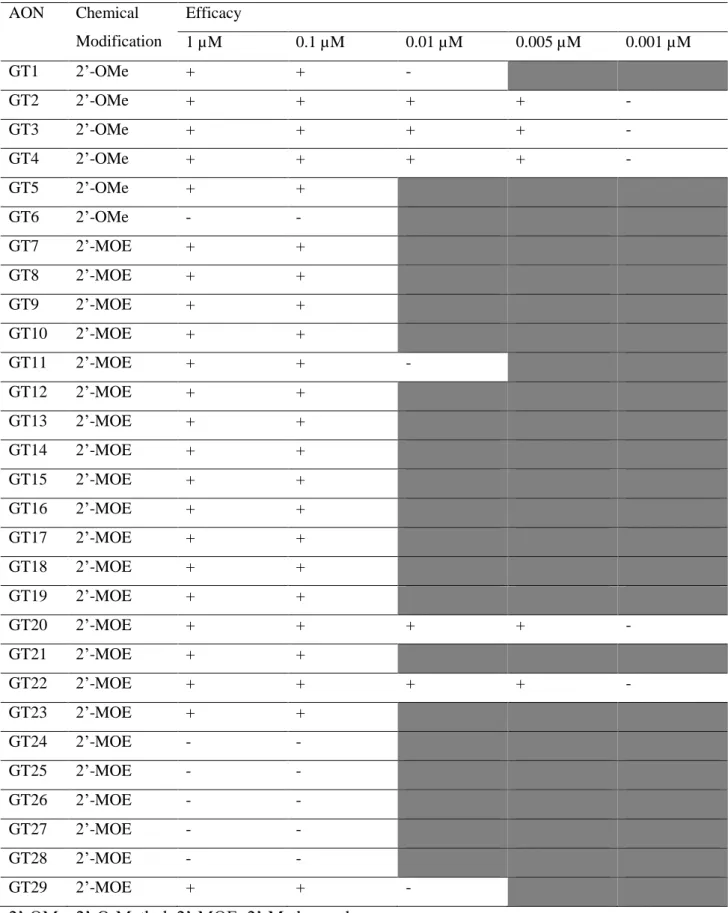
4.2 AON Optimization for CEP290-associatedLCA Treatment
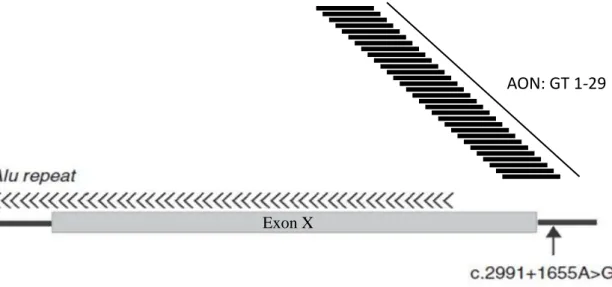
In order to optimize the AON treatment for c.2991+1655A>G mutation in CEP290
gene, 29 AONs targeting different regions around the mutation were tested (Figure 10) using
several dilutions. To measure the efficacy, transcriptional analysis was performed by
RT-PCR. The best three AONs at RNA levels were subsequently tested at protein and cilium
levels.
Figure 10. Schematic representation of AONs. The number of AON tested in this study is 29 (GT1-GT29), located in different places around deep intronic mutation (c.2991+1655A>G) in CEP290 gene. GT1-GT6 used a
2’-OMe while GT7-29 used a 2’-MOE as a chemical modification.
4.2.1 Transcriptional Analysis
Fibroblasts cells derived from CEP290-associated patient were used. Transfection of
AONs was done in several dilution steps: 1 µM, 0.1 µM, 0.01 µM, 0.005 µM, and 0.001 µM.
The AON efficiency was assessed by measuring the ratio between aberrant and total transcript
in each dilution. From the 1 µM concentration, we identified that some of the AONs were
already not effective in restoring the aberrant transcript. Only those AONs that showed some
degree of rescue were further diluted.
AON: GT - 9
27
Table 7. Efficacy of AONs in serial dilutions.
28
When we continued with lower dilution, the number of AON that work efficiently in
restoring the aberrant transcript was also reduced. We found that the number of AONs that
worked at 0.1 µM concentration was the same as those at the concentration of 1 µM. From
now onwards, the 0.1 µM dilution will be called optimal dilution. Additionally, at 0.001 µM,
no AON worked (Table 7).
The lowest effective concentration identified in small number of AONs was 0.005 µM,
and we called it sub-optimal concentration. The three best AON in the sub-optimal condition
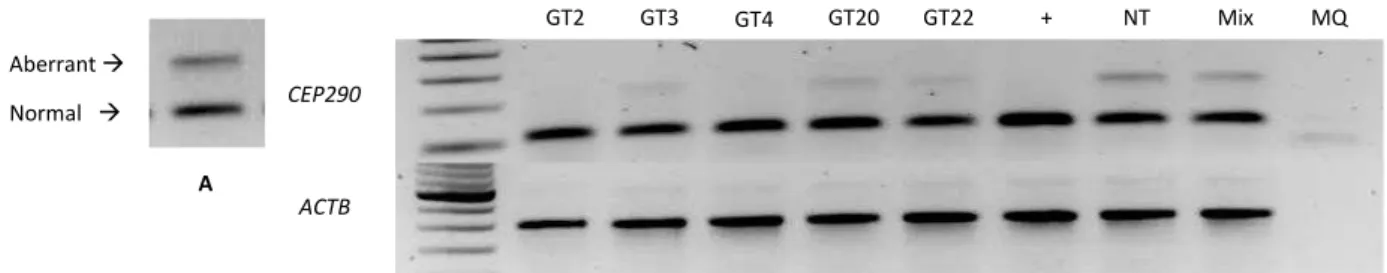
were selected to evaluate the effect at the protein and cilium levels. These AONs were: GT2,
GT4, and GT22. GT3 at 0.1 µM was used as a control since the characteristic was already
known before (Figure 11).
Figure 11. Transcriptional Analysis. A. CEP290-associated LCA cells showed aberrant and normal transcript that can be assessed by PCR encompassing exon 26-27 at cDNA levels. B. Transcriptional analysis of the best 5 AON at 0.005 µM concentration.
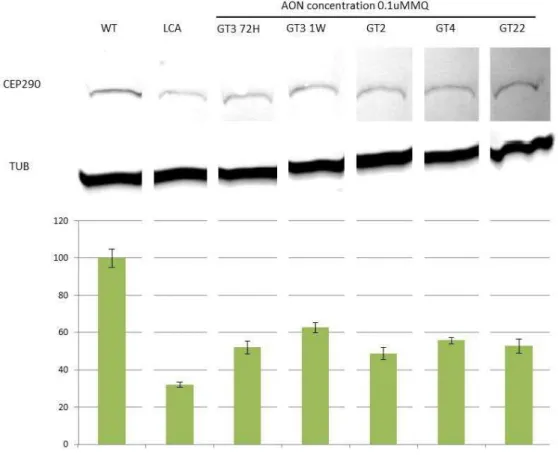
4.2.2 Western Blot and Protein Quantification
Western blot was performed to assess the effect of AON transfection at protein levels.
To determine the efficiency of AONs, the quantity of protein were compared between
non-treated LCA cells and AON-non-treated LCA cells vs wild-type (WT) cells. In order to do that, we
used antibody targeting C-terminal part of CEP290, which is truncated in the mutant allele.
Quantification of CEP290 protein was done by measuring the CEP290 band using ImageJ.
Tubulin was used to normalize the result. Quantification was done in five series, to see if the
29
This study also proved that longer duration of AON treatment increases the protein
levels. Fibroblast cells treated with GT3 for 6 days showed significantly higher CEP290
protein levels than cells treated with same AON for only 3 days (51,93% vs 62,55%).
Figure 12. Immunodetection and protein quantification of GT2, GT4, and GT22. Western blot of CEP290 protein from wild-type (WT) fibroblast cells, non-treated fibroblast cells from LCA patient (LCA) and LCA fibroblast cells treated with GT3, GT2, GT4, and GT22. Bar chart showed the quantification of Western blot using ImageJ software. The measurement was performed five times, with the error bars showing standard deviation. Tubulin was used to normalize the result.
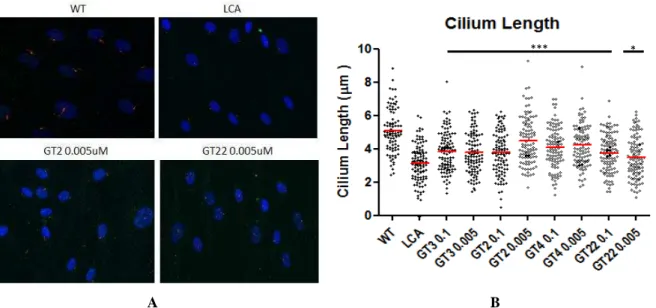
4.2.3 Immunocytochemistry
Wild-type fibroblast cells from seven independent experiments were used together
with CEP290-associated LCA fibroblast cells. The three best AONs selected from previous
transcriptional analyses (GT2, GT4, GT22) were used along with GT3 (positive control).
Antibody against CEP290 protein used in this experiment is the same as the one used for the
Western blot analyses. Cilium length measurements were performed using an antibody
targeting acetylated tubulin, which represent the axonemes of primary cilia (Figure 13A). The
30
Student’s t-test was used for statistical analysis. The mean of non-treated cells cilium length was significantly reduced compare to wild-type cells (3,116 µm vs 5,076 µm). Fibroblast cells
treated with GT2, GT3, GT4, and GT22 showed increased cilium lengths compare to
untreated LCA cells both in optimal and sub-optimal condition (Figure 13B).
A B
Figure 13. A. Immunocytochemistry using 4’, 6-diamidino-2-phenylindole (DAPI, blue stain), rabbit polyclonal anti-CEP290 (green stain), and mouse monoclonal anti-acetylated Tubulin (red stain). B. Statistical analysis of cilium length analysis showed that all of the AON-treated LCA cells have a statistically significant longer cilia than the non-treated LCA cells (*p-value <0.05, ***p-value <0.001).