Rampant TechPress
Tuning Third-party Vendor
Oracle systems
Tuning when you can't touch the
code
Notice
Tuning Third-party Vendor Oracle
systems
Tuning when you can't touch the code
By Mike Ault
Copyright © 2003 by Rampant TechPress. All rights reserved.
Published by Rampant TechPress, Kittrell, North Carolina, USA
Series Editor: Don Burleson
Production Editor: Teri Wade
Cover Design: Bryan Hoff
Oracle, Oracle7, Oracle8, Oracle8i, and Oracle9i are trademarks of Oracle Corporation. Oracle In-Focus is a registered Trademark of Rampant TechPress.
Many of the designations used by computer vendors to distinguish their products are claimed as Trademarks. All names known to Rampant TechPress to be trademark names appear in this text as initial caps.
The information provided by the authors of this work is believed to be accurate and reliable, but because of the possibility of human error by our authors and staff, Rampant TechPress cannot guarantee the accuracy or completeness of any information included in this work and is not responsible for any errors, omissions, or inaccurate results obtained from the use of information or scripts in this work.
Visit www.rampant.cc for information on other Oracle In-Focus books.
Table Of Contents
Notice ... ii
Publication Information ... iii
Table Of Contents ... iv
Introduction ... 1
Tuning Overview ... 1
What Can Be Done?... 2
Optimizing Oracle Internals ... 3
Database Buffer Tuning... 3
Database Writer Tuning... 6
Shared Pool Tuning ... 8
What is the shared pool?... 8
Monitoring and Tuning the Shared Pool ... 10
Putting it All In Perspective... 17
What to Pin ... 22
The Shared Pool and MTS... 24
Large Pool Sizing ... 25
A Matter Of Hashing ... 26
Monitoring Library and Data Dictionary Caches ... 30
In Summary ... 32
Tuning Checkpoints... 33
Tuning Redo Logs ... 34
Redo Log Sizing ... 35
Tuning Oracle Sorts... 42
Optimizer Modes ... 44
Tuning the Multi-part Oracle8 Buffer Cache ... 45
Use of the Default Pool... 45
Use of The KEEP Pool ... 45
Use of the RECYCLE Pool ... 46
Tuning the Three Pools... 46
Adding Resources... 47
Tuning Tables and Indexes ... 48
Table Rebuilds... 48
Rebuilding Indexes ... 49
Adjusting Index Cost in Oracle8 ... 52
Bitmapped Index Usage*... 52
Function Based Indexes... 55
Reverse Key Indexes ... 57
Index Organized Tables... 58
Partitioned Tables and Indexes... 59
Partitioned Indexes ... 61
Parallel Query... 62
Oracle8 Enhanced Parallel DML ... 62
Managing Multiple Buffer Pools in Oracle8 ... 66
Use of the Default Pool... 66
Use of The KEEP Pool ... 66
Use of the RECYCLE Pool ... 67
Sizing the Default Pool... 67
Sizing the Keep Pool ... 67
Sizing the Recycle Pool ... 68
Using Outlines in Oracle8i ... 69
Creation of a OUTLINE object ... 70
Altering a OUTLINE ... 71
Dropping an OUTLINE... 72
Use of the OUTLN_PKG To Manage SQL Stored Outlines... 72
DROP_UNUSED ... 72
DROP_BY_CAT ... 73
UPDATE_BY_CAT... 74
Summary... 75
Using Oracle8i Resource Plans and Groups ... 76
Creating a Resource Plan... 76
DBMS_RESOURCE_MANAGER Package... 82
DBMS_RESOURCE_MANGER Procedure Syntax... 84
Syntax for the CREATE_PLAN Procedure:... 84
Syntax for the UPDATE_PLAN Procedure: ... 84
Syntax for the DELETE_PLAN Procedure: ... 85
Syntax for the DELETE_PLAN Procedure: ... 85
Syntax for the CREATE_RESOURCE_GROUP Procedure:... 85
Syntax for the UPDATE_RESOURCE_GROUP Procedure: ... 85
Syntax for the DELTE_RESOURCE_GROUP Procedure:... 86
Syntax for the CREATE_PLAN_DIRECTIVE Procedure:... 86
Syntax for the UPDATE_PLAN_DIRECTIVE Procedure: ... 87
Syntax for the DELETE_PLAN_DIRECTIVE Procedure: ... 88
Syntax for CREATE_PENDING_AREA Procedure: ... 88
Syntax of the VALIDATE_PENDING_AREA Procedure: ... 88
Usage Notes For the Validate and Submit Procedures: ... 89
Syntax of the CLEAR_PENDING_AREA Procedure: ... 89
Syntax of the SUBMIT_PENDING_AREA Procedure: ... 90
Syntax of the SET_INITIAL_CONSUMER_GROUP Procedure:... 90
Syntax of the SWITCH_CONSUMER_GROUP_FOR_ SESS Procedure: ... 90
Syntax of the SWITCH_CONSUMER_GROUP_FOR_ USER Procedure: ... 91
DBMS_RESOURCE_MANAGER_PRIVS Package ... 91
DBMS_RESOURCE_MANGER_PRIVS Procedure Syntax ... 91
Syntax for the GRANT_SYSTEM_PRIVILEGE Procedure:... 91
Syntax for the REVOKE_SYSTEM_PRIVILGE Procedure:... 92
Syntax of the GRANT_SWITCH_CONSUMER_GROUP Procedure: ... 92
Usage Notes... 93
Syntax of the REVOKE_SWITCH_CONSUMER_GROUP Procedure:... 93
Usage Notes... 93
Introduction
In many Oracle shops today third-party applications are the norm. The major problem for DBAs with these third-party applications is that you are not allowed to alter the source code of the SQL used within the application. Many times the application will generate SQL statements in an ad-hoc manner that further complicates the tuning picture. This paper will attempt to provide insights into how to tune Oracle when you can’t touch the code.
Tuning Overview
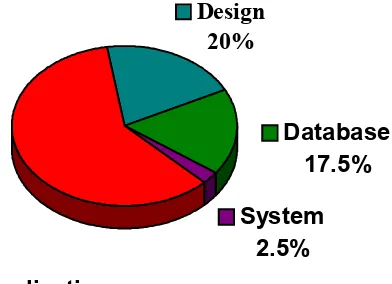
Everyone who has been in the Oracle DBA profession for any length of time has seen the graph in figure 1. This graph shows the percentage gains, on the average, from tuning various aspects of the Oracle database environment.
Design
20%
Database
17.5%
Application
60%
System
2.5%
Figure 1: Performance Gains from Tuning
third-party application such as those provided by SAP, PeopleSoft, Baen, Siebel or Oracle Financials, the DBA is often forced to ignore bad design and SQL since touching the code is forbidden. This leaves us with the 20% of gains that can be reached through the tuning of the database and the system.
However, it should be noted that the graph in figure 1 is not applicable to all cases and carries many unseen qualifications with it. The graph assumes that the system and database have been set up by a reasonably qualified Oracle DBA. Of course this is not always the case and in many locations a qualified Oracle DBA isn’t hired until performance problems manifest themselves, this is usually just as the system goes live and a full user load is experienced.
What Can Be Done?
Depending on the Oracle version there are tuning options available to the DBA that don’t involve tweaking the SQL. Table 1 shows the main tuning options available by Oracle version.
Oracle Version: 7.3.x 8.0.x 8.1.xOptimize Internals X X X
Optimizer Modes X X X Add Resources X X X Tune Tables and Indexes X X X Parallel Query X X X Better Indexes X X Index Only Tables X X Partitioning X X New INI features X X Subpartitioning X Outlines X Resource Groups X
Table 1: Tuning Options by Oracle Version
Optimizing Oracle Internals
When beginning to tune a third-party database where the code can’t be touched you should generally begin with making sure that the memory and database internals are optimized for performance. If Oracle doesn’t have enough memory, processes or other resources, the other tuning options won’t make much difference generally speaking. The options for internals tuning are:
• Database Buffer Tuning
• Database Writer Tuning
• Shared Pool Tuning
• Checkpoints
• Redo Logs
• Rollback Segments
• Sort Area Size
Let’s examine each of these areas.
Database Buffer Tuning
When we refer to database buffer tuning we are actually discussing the tuning of the memory used to store data used by Oracle processes. All data that passes to users and then back to the database passes through buffers. If there aren’t enough db block buffers there is a significant hit on performance. Likewise if the database base block buffers aren’t of the correct size then they can’t be efficiently utilized.
Generally it is suggested that the database block buffer size be set to at least 8192 (8k). This size of 8k allows for optimal storage of data and index information on most Oracle platforms. The product of db_block_size and db_block_buffers should be no less than 5-10% of the total physical data size (including indexes) for the system. Usually the product of db_block_size and db_block_buffers will be larger than 5-10% of the physical database size, but this is a good general starting point. Of course the size of the buffer area and other shared global area components, should not exceed 50-60% of the available physical memory or swapping will result.
One gross indicator of database buffer health is called the hit ratio. The hit ratio is expressed as a percent and is calculated using the formula:
Traditionally the information for calculating the database block buffers hit ratio is taken from the V$SYSSTATS view. However, in versions 7.3.4 and higher of the database the “physical reads” parameter was altered to include “direct reads” which skews the hit ratio in the downward direction. In Oracle8i the statistic “direct reads” is also recorded so you can subtract the “direct reads” from the “physical reads” to get the correct value with which to calculate hit ratio. However, Oracle has provided the V$BUFFER_POOL_STATISTICS view if the DBA runs the CATPERF.SQL script in the latest releases in which uncontaminated values for “physical reads” are available and this view should be used where it is available.
Hit ratio should generally be as close to 100% as is possible to achieve, however, in some cases artificially high values can be received if nonselective indexes are used in queries. Hit ratio is not the best indicator of performance of the database block buffers.
It is suggested that hit ratio be monitored to give a quick look at performance, however tuning decisions should be made on a more detailed analysis of the buffer area. Using cursors PL/SQL can be used to track hit ratios as is shown in figure 2.
CURSOR get_stat(stat IN VARCHAR2) IS SELECT name,value FROM v$sysstat WHERE name = stat;
Supply the cursor with the variables:
'db block gets‘,'consistent gets‘, 'physical reads‘, ‘direct reads’ h_ratio := (1-(p_reads-d_reads)/(db_gets + con_gets)))*100; Or use the cursor:
CURSOR get_hratio IS
SELECT name, (1-(physical_reads/(db_block_gets+consistent_gets)))*100 H_RATIO
FROM v$buffer_pool_statistics;
Notice the cursor returns a pool name as well, in Oracle8 and above multiple buffer pools are allowed.
Figure 2: Example Hit Ratio Calculations
More detailed information about the database blcok buffers is contained in the V$BH view. The V$BH view of the X$BH table is available in newer versions of Oracle. In earlier versions the view had to be created using the CATPARR.SQL script.
example select, from: “ORACLE Performance Tuning Tips & Techniques”, Richard Niemiec, Oracle Press, is shown in figure 3.
CREATE VIEW BLOCK_STATUS AS SELECT DECODE(state, 0, ‘FREE’,
1, DECODE(lrba_seq,0, ‘AVAILABLE’, ‘BEING USED’), 3, ‘BEING USED’, state) “BLOCK STATUS”,
COUNT(*) “COUNT” FROM x$bh
GROUP BY
decode(state,0,’FREE’,1,decode(lrba_seq,0,’AVAILABLE’, ’BEING USED’),3,’BEING USED’,state);
Figure 3: Example X$BH Select
If 10-25% buffers are free after 2 hours of use, good. If your database doesn’t show at least 10-25% of the database block buffers free, then you should consider increasing the value of DB_BLOCK_BUFFERS in 10-25% increments. An alternative select using the X$BH from NOTE:1019635.6 on Metalink is shown in figure 4.
create view buffer_status2 as select
decode(greatest(class,10),10,decode(class,1,'Data',2
,'Sort',4,'Header',to_char(class)),'Rollback') "Class", sum(decode(bitand(flag,1),1,0,1)) "Not Dirty",
sum(decode(bitand(flag,1),1,1,0)) "Dirty",
sum(dirty_queue) "On Dirty",count(*) "Total" from x$bh
group by decode(greatest(class,10),10,decode(class,1,'Data',2 ,'Sort',4,'Header',to_char(class)),'Rollback') /
Figure 4: Example Select Against X$BH From Metalink
One thing to note about the scripts in Figures 3 and 4 is that they must be run from the SYS user, both create views that can then be used by other users with appropriate grants.
Another source of information about possible database block buffer problems is the V$WAITSTAT view that summarizes the counts of the various wait conditions occurring in the database. Figure 5 shows an example select against this view.
SELECT
class,"COUNT" FROM
v$waitstat WHERE
class = ‘data block’;
It must be stated that data block waits by themselves do not indicate that an increase in database block buffers is required. Data block waits can also be caused by improperly set INITRANS and FREELISTS on heavily used tables. However, in my experience a major portion of data block waits are directly attributable to insufficient database block buffers in systems where a significant number of data block waits are experienced (100 waits is not significant, 10000 are.) If you have high hit ratios (in the high 90’s) and experience data block waits with the V$BH view showing 10-25% free buffers, then the waits are probably due to INITRANS and FREELISTS, otherwise they point at insufficient database block buffers.
Using the techniques discussed the DBA should be able to properly tune the size of the DB_BLOCK_BUFFERS parameter to ensure adequate memory is available for the databases data needs. As with virtually all other tuning aspects, the setting for DB_BLOCK_BUFFERS will have to adjusted as the amount of data in the database increases or decreases and the user data requirements change.
Database Writer Tuning
Database writer tuning involves two basic areas, first, how often writes are accomplished and how much is written in each write and second, how many writer processes are designated to service the database output requirements. The V$SYSSTAT view should also be used to calculate the value for the average length of the dirty write queue, values larger than 100 show need for more DB_BLOCK_BUFFERS or DB_WRITERS or a need to increase the size of the DB_BLOCK_WRITE_BATCH (which becomes an undocumented parameter beginning with Oracle8.)
Figure 6 shows a select taken from “Oracle Performance Tuning” , Mark Gurry and Peter Corrigan, O’Reilly Press.
SELECT
DECODE (name, ‘summed dirty write queue length’, value)/ DECODE (name, ‘write requests’, value) “Write Request Length” FROM v$sysstat
WHERE name IN ( ‘summed dirty queue length’, ‘write requests’) and value>0;
Figure 6: Example Select for Dirty Queue Length
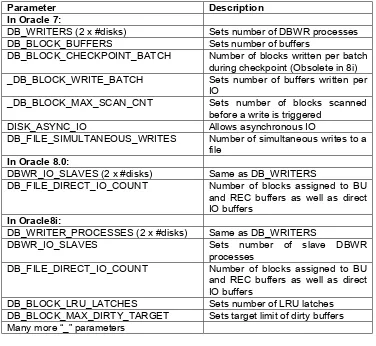
Parameter Description In Oracle 7:
DB_WRITERS (2 x #disks) Sets number of DBWR processes
DB_BLOCK_BUFFERS Sets number of buffers
DB_BLOCK_CHECKPOINT_BATCH Number of blocks written per batch during checkpoint (Obsolete in 8i)
_DB_BLOCK_WRITE_BATCH Sets number of buffers written per
IO
_DB_BLOCK_MAX_SCAN_CNT Sets number of blocks scanned
before a write is triggered
DISK_ASYNC_IO Allows asynchronous IO
DB_FILE_SIMULTANEOUS_WRITES Number of simultaneous writes to a file
In Oracle 8.0:
DBWR_IO_SLAVES (2 x #disks) Same as DB_WRITERS
DB_FILE_DIRECT_IO_COUNT Number of blocks assigned to BU
and REC buffers as well as direct IO buffers
In Oracle8i:
DB_WRITER_PROCESSES (2 x #disks) Same as DB_WRITERS
DBWR_IO_SLAVES Sets number of slave DBWR
processes
DB_FILE_DIRECT_IO_COUNT Number of blocks assigned to BU
and REC buffers as well as direct IO buffers
DB_BLOCK_LRU_LATCHES Sets number of LRU latches
DB_BLOCK_MAX_DIRTY_TARGET Sets target limit of dirty buffers Many more “_” parameters
Table 2: Initialization Parameters for DBWR Tuning (Duplicate parameters removed)
Whether you use DB_WRITERS, DBWR_IO_SLAVES or DB_WRITER_PROCESSES usually you won’t need more than 2 processes per disk used for Oracle. Generally speaking if you exceed twice your number of CPUs for the number of DBWR processes you will get diminishing returns. In Oracle8i if you have multiple DB_WRITER_PROCESSES you can’t have multiple DBWR_IO_SLAVES. You must also have at least one DBWR_BLOCK_LRU_LATCH for each DBWR process. If you set DBWR_IO_SLAVES in Oracle8i then the values for ARCH_IO_SLAVES and LGWR_IO_SLAVES are set to 4 each and DB_WRITER_PORCESSES is set to 1 silently.
The undocumented parameters (those preceded by an “_” underscore probably shouldn’t be reset. In some cases reducing the value of _DB_BLOCK_WRITE_BATCH may reduce waits for the DBWR processes.
DB_BLOCK_CHECKPOINT_BATCH sets the number of blocks the database writer process(es) write with each checkpoint write. A small value allows threading of other writes but causes longer checkpoint times. A large value gets checkpoints completed faster but holds up other writes. If you set this value to high Oracle will silently set it to the value of the database writer write batch.
DB_BLOCK_MAX_DIRTY_TARGET specifies the number of buffers that are allowed to be dirty before DBRW will write them all out to disk. This limits the required time for instance recovery after a crash but low values will cause DBRW to perform extra work.
DB_FILE_SIMULTANEOUS_WRITES should be set to 4 times the number of disks in your stripe sets. When striping is not used set it to 4.
DISK_ASYNC_IO is only used when asynchronous writes are not stable on your system. Generally DISK_ASYNC_IO defaults to TRUE only set it to false if the previously mentioned condition is true. If you must set DISK_ASYNC_IO to FALSE, configure multiple DBRW or DBRW_IO_SLAVES to simulate asynchronous IO.
One indication of DBWR problems is excessive BUFFER WAITS from V$WAITSTAT. You can check this with a look at buffer waits from Gurry and Corrigan:
SELECT name, value FROM v$sysstat WHERE name=‘free buffer waits’;
Shared Pool Tuning
Perhaps one of the least understood areas of Oracle Shared Global Area optimization is tuning the shared pool. The generally accepted tuning methodology involves throwing memory into the pool until the problem goes under. In this section of the paper we will examine the shared pool and define a method for tuning the shared pool that uses measurement, not guesswork to drive the tuning methodologies.
What is the shared pool?
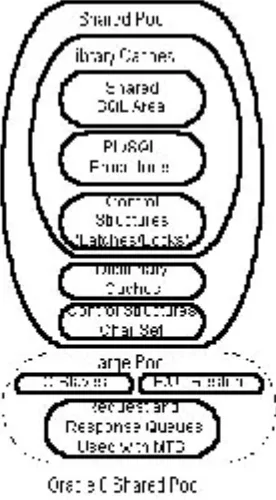
improperly sized then overall database performance will suffer, sometimes dramatically. Figure 7 diagrams the shared pool structure located inside the various Oracle SGAs.
Figure 7: Oracle 7 and Oracle 8 Shared Pool Structures
As you can see from examining the structures pictured in Figure 7, the shared pool is separated into many substructures. The substructures of the shared pool fall into two broad areas, the fixed size areas that for a given database at a given point in time stay relatively constant in size and the variable size areas that grow and shrink according to user and program requirements.
The shared pool is used for objects that can be shared among all users such as table definitions, reusable SQL (although non-reusable SQL is also stored there), PL/SQL packages, procedures and functions. Cursor information is also stored in the shared pool. At a minimum the shared pool must be sized to accommodate the needs of the fixed areas plus a small amount of memory reserved for use in parsing SQL and PL/SQL statements or ORA-07445 errors will result.
Monitoring and Tuning the Shared Pool
Let me begin this section by stating that the default values for the shared pool size initialization parameters are almost always too small by at least a factor of four. Unless your database is limited to the basic scott/tiger type schema and your overall physical data size is less than a couple of hundred megabytes, even the "large" parameters are far too small. What parameters control the size of the shared pool? Essentially only one, SHARED_POOL_SIZE. The other shared pool parameters control how the variable space areas in the shared pool are parsed out, but not overall shared pool size. In Oracle8 a new area, the large pool, controlled by the LARGE_POOL_SIZE parameter is also present. Generally speaking I suggest you start at a shared pool size of 40 megabytes and move up from there. The large pool size will depend on the number of concurrent users, number of multi-threaded server servers and dispatchers and the sort requirements for the application. Sizes of larger than 140-200 megabytes rarely result in performance improvement. The major problem with the shared pool is over population resulting in too many SQL areas to be efficiently managed. Usually when you exceed 5000-7000 SQL areas performance in the shared pool tends to degrade.
What should be monitored to determine if the shared pool is too small? For this you need to wade into the data dictionary tables, specifically the V$SGASTAT and V$SQLAREA views. Figure 8 shows a report that shows how much of the shared pool is in use at any given time the script is run.
REM Script to report on shared pool usage REM
column shared_pool_used format 9,999.99 column shared_pool_size format 9,999.99 column shared_pool_avail format 9,999.99 column shared_pool_pct format 999.99 @title80 'Shared Pool Summary'
spool rep_out\&db\shared_pool select
least(max(b.value)/(1024*1024),sum(a.bytes)/(1024*1024)) shared_pool_used,
max(b.value)/(1024*1024) shared_pool_size,
greatest(max(b.value)/(1024*1024),sum(a.bytes)/(1024*1024))-(sum(a.bytes)/(1024*1024)) shared_pool_avail,
((sum(a.bytes)/(1024*1024))/(max(b.value)/(1024*1024)))*100 avail_pool_pct
where (a.pool='shared pool' and a.name not in ('free memory')) and
b.name='shared_pool_size'; spool off
ttitle off
Figure 8: Example Script to Show SGA Usage
The script in Figure 8 should be run periodically during times of normal and high usage of your database. The results will be similar to Figure 9. If your shared_pool_pct figures stay in the high nineties then you may need to increase the size of your shared pool, however, this isn't always the case.
Date: 11/18/98 Page: 1 Time: 04:16 PM Shared Pool Summary SYSTEM ORTEST1 database SHARED_POOL_USED SHARED_POOL_SIZE SHARED_POOL_AVAIL SHARED_POOL_PCT --- --- --- --- 3.66 38.15 34.49 9.60
Figure 9: Example Output From Script In Figure 8.
To often all that is monitored is how much of the shared pool is filled, no one looks how is it filled; with good reusable SQL or bad throw away SQL. You must examine how the space is being used before you can decide whether the shared pool should be increased in size, decreased in size or perhaps a periodic flush schedule set up with the size remaining the same. So how can we determine what is in the shared pool and whether it is being properly reused or not? Let's look at a few more reports.
rem FUNCTION: Creates summary of v_$sqlarea and dba_users for use in rem sqlmem.sql and sqlsummary.sql reports
rem rem
create or replace view sql_summary as select
username, sharable_mem, persistent_mem, runtime_mem from
sys.v_$sqlarea a, dba_users b where
a.parsing_user_id = b.user_id; rem
Figure 10: Example SQL Script to Create A View to Monitor Pool Usage By User
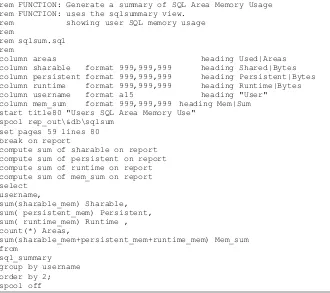
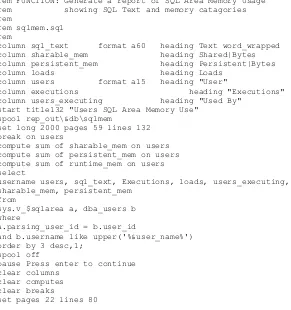
Once the SQL_SUMMARY view is created the script in Figure 11 is run to generate a summary report of SQL areas used by user. This shows the distribution of SQL areas and may show you that some users are hogging a disproportionate amount of the shared pool area. Usually, a user that is hogging a large volume of the shared pool is not using good SQL coding techniques which is generating a large number of non-reusable SQL areas.
rem
rem FUNCTION: Generate a summary of SQL Area Memory Usage rem FUNCTION: uses the sqlsummary view.
rem showing user SQL memory usage rem
rem sqlsum.sql rem
column areas heading Used|Areas column sharable format 999,999,999 heading Shared|Bytes column persistent format 999,999,999 heading Persistent|Bytes column runtime format 999,999,999 heading Runtime|Bytes column username format a15 heading "User" column mem_sum format 999,999,999 heading Mem|Sum start title80 "Users SQL Area Memory Use"
spool rep_out\&db\sqlsum set pages 59 lines 80 break on report
compute sum of sharable on report compute sum of persistent on report compute sum of runtime on report compute sum of mem_sum on report select
username,
sum(sharable_mem) Sharable, sum( persistent_mem) Persistent, sum( runtime_mem) Runtime , count(*) Areas,
sum(sharable_mem+persistent_mem+runtime_mem) Mem_sum from
pause Press enter to continue clear columns
clear breaks
set pages 22 lines 80 ttitle off
Figure 11: Example SQL Script To Report On SQL Area Usage By User
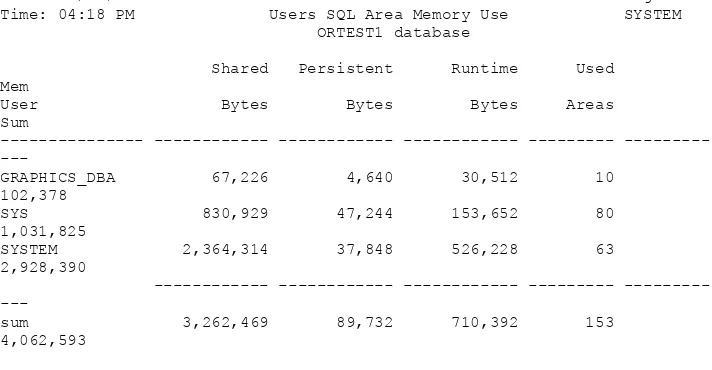
Example output from the script in Figure11 is shown in Figure 12. In the example report no one user is really hogging the SQL area. If you have a particular user that is hogging SQL areas, the report in Figure 12 will show you what SQL areas they have and what is in them. This report on the actual SQL area contents can then be used to help teach the user how to better construct reusable SQL statements.
Date: 11/18/98 Page: 1 Time: 04:18 PM Users SQL Area Memory Use SYSTEM ORTEST1 database Shared Persistent Runtime Used Mem
User Bytes Bytes Bytes Areas Sum
--- --- --- --- ---
GRAPHICS_DBA 67,226 4,640 30,512 10 102,378
SYS 830,929 47,244 153,652 80 1,031,825
SYSTEM 2,364,314 37,848 526,228 63 2,928,390
--- --- --- ---
sum 3,262,469 89,732 710,392 153 4,062,593
3 rows selected.
Figure 12: Example Output From Figure 11
rem
rem FUNCTION: Generate a report of SQL Area Memory Usage rem showing SQL Text and memory catagories rem
rem sqlmem.sql rem
column sql_text format a60 heading Text word_wrapped column sharable_mem heading Shared|Bytes column persistent_mem heading Persistent|Bytes column loads heading Loads
column users format a15 heading "User"
column executions heading "Executions" column users_executing heading "Used By"
start title132 "Users SQL Area Memory Use" spool rep_out\&db\sqlmem
set long 2000 pages 59 lines 132 break on users
compute sum of sharable_mem on users compute sum of persistent_mem on users compute sum of runtime_mem on users select
username users, sql_text, Executions, loads, users_executing, sharable_mem, persistent_mem
from
sys.v_$sqlarea a, dba_users b where
a.parsing_user_id = b.user_id
and b.username like upper('%&user_name%') order by 3 desc,1;
spool off
pause Press enter to continue clear columns
clear computes clear breaks
set pages 22 lines 80
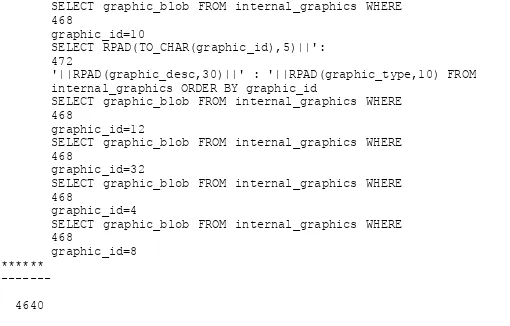
Figure 13: Example Script To Show Active SQL Areas For a User
Date: 11/18/98
Page: 1
Time: 04:19 PM Users SQL Area Memory Use SYSTEM
ORTEST1 database Shared Persistent
User Text Executions Loads Used By Bytes Bytes
---- - --- --- ---
GRAPHICS_DBA BEGIN dbms_lob.read (:1, :2, :3, :4); END; 2121 1 0 10251 488
alter session set nls_language= 'AMERICAN' nls_territory= 7 1 0 3975 408
'AMERICA' nls_currency= '$' nls_iso_currency= 'AMERICA' nls_numeric_characters= '.,' nls_calENDar= 'GREGORIAN' nls_date_format= 'DD-MON-YY' nls_date_language= 'AMERICAN' nls_sort= 'BINARY' BEGIN :1 := dbms_lob.getLength (:2); END; 6 1 0 9290 448
SELECT graphic_blob FROM internal_graphics WHERE 2 1 0 5863 468
graphic_id=10 SELECT RPAD(TO_CHAR(graphic_id),5)||': 1 1 0 7101 472
'||RPAD(graphic_desc,30)||' : '||RPAD(graphic_type,10) FROM internal_graphics ORDER BY graphic_id SELECT graphic_blob FROM internal_graphics WHERE 1 1 0 6099 468
graphic_id=12 SELECT graphic_blob FROM internal_graphics WHERE 1 1 0 6079 468
graphic_id=32 SELECT graphic_blob FROM internal_graphics WHERE 1 1 0 6074 468
graphic_id=4 SELECT graphic_blob FROM internal_graphics WHERE 1 1 0 5962 468
graphic_id=8 *************** --- ---
sum 67226 4640
Figure 14: Report Output Example For a Users SQL Area
One warning about the script in figure 13, the report it generates can run to several hundred pages for a user with a large number of SQL areas. What things should you watch for in a user's SQL areas? First, watch for the non-use of bind variables, bind variable usage is shown by the inclusion of variables such as ":1" or ":B" in the SQL text. Notice that in the example report in Figure 8 the first four statements use bind variables, and, consequently are reusable. Non-bind usage means hard coded values such as 'Missing' or '10' are used. Notice that for most of the rest of the statements in the report no bind variables are used even though many of the SQL statements are nearly identical. This is one of the leading causes of shared pool misuse and results in useful SQL being drown in tons of non-reusable garbage SQL.
The problem with non-reusable SQL is that it must still be looked at by any new SQL inserted into the pool (actually it's hash value is scanned). While a hash value scan may seem a small cost item, if your shared pool contains tens of thousands of SQL areas this can be a performance bottleneck. How can we determine, without running the report in Figure 13 for each of possibly hundreds of users, if we have garbage SQL in the shared pool?
REM
REM View to sort SQL into GOOD and GARBAGE REM
CREATE OR REPLACE VIEW sql_garbage AS SELECT
b.username users,
SUM(a.sharable_mem+a.persistent_mem) Garbage, TO_NUMBER(null) good
FROM
sys.v_$sqlarea a, dba_users b WHERE
(a.parsing_user_id = b.user_id and a.executions<=1) GROUP BY b.username
UNION SELECT DISTINCT b.username users, TO_NUMBER(null) garbage, SUM(c.sharable_mem+c.persistent_mem) Good FROM
dba_users b, sys.v_$sqlarea c WHERE
(b.user_id=c.parsing_user_id and c.executions>1) GROUP BY b.username;
Figure 15: Example Script to Create the SQL_GARBAGE View
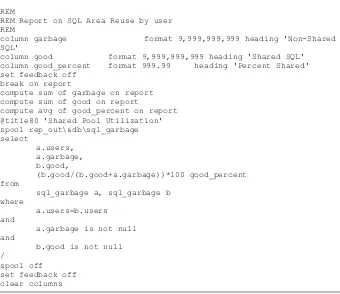
REM
REM Report on SQL Area Reuse by user REM
column garbage format 9,999,999,999 heading 'Non-Shared
SQL'
column good format 9,999,999,999 heading 'Shared SQL' column good_percent format 999.99 heading 'Percent Shared' set feedback off
break on report
compute sum of garbage on report compute sum of good on report
compute avg of good_percent on report @title80 'Shared Pool Utilization' spool rep_out\&db\sql_garbage select
a.users, a.garbage, b.good,
(b.good/(b.good+a.garbage))*100 good_percent
from
sql_garbage a, sql_garbage b where
a.users=b.users and
a.garbage is not null and
b.good is not null /
clear breaks clear computes
Figure 16: Example Report Script For SQL Reuse Statistics
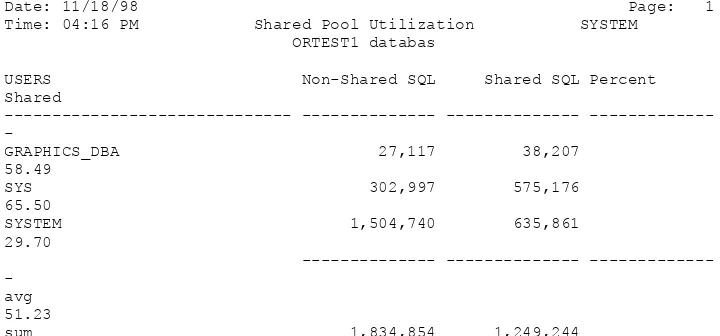
The report script in Figure 16 shows at a glance (well, maybe a long glance for a system with hundreds of users) which users aren't making good use of reusable SQL. An example report output is shown in Figure 17.
Date: 11/18/98 Page: 1 Time: 04:16 PM Shared Pool Utilization SYSTEM ORTEST1 databas USERS Non-Shared SQL Shared SQL Percent Shared
---- - - ---
GRAPHICS_DBA 27,117 38,207 58.49
SYS 302,997 575,176 65.50
SYSTEM 1,504,740 635,861 29.70
- - ---
avg 51.23
sum 1,834,854 1,249,244
Figure 17: Example Report From Showing SQL Reuse Statistics
Notice in Figure 17 that the GRAPHICS_DBA user only shows 58.49% shared SQL use based on memory footprints. From the report in Figure 14 we would expect a low reuse value for GRAPHICS_DBA. The low reuse value for the SYSTEM user is due to its use as a monitoring user, the monitoring SQL is designed to be used once per day or so and was not built with reuse in mind.
Putting it All In Perspective
So what have we seen so far? We have examined reports that show both gross and detailed shared pool usage and whether or not shared areas are being reused. What can we do with this data? Ideally we will use the results to size our shared pool properly. Let's set out a few general guidelines for shared pool sizing:
Guideline 1: If gross usage of the shared pool in a non-ad-hoc environment
Guideline 2: If the shared pool shows a mixed ad-hoc and reuse environment establish a shared pool size large enough to hold the fixed size portions, pin reusable packages and establish a comfort level above this required level of pool fill. Establish a routine flush cycle to filter non-reusable code from the pool.
Guideline 3: If the shared pool shows that no reusable SQL is being used
establish a shared pool large enough to hold the fixed size portions plus a few megabytes (usually not more than 40) and allow the shared pool modified least recently used (LRU) algorithm to manage the pool.
In guidelines 1, 2 and 3, start at around 40 megabytes for a standard size system. Notice in guideline 2 it is stated that a routine flush cycle should be instituted. This flies in the face of what Oracle Support pushes in their shared pool white papers, however, they work from the assumption that proper SQL is being generated and you want to reuse the SQL present in the shared pool. In a mixed environment where there is a mixture of reusable and non-reusable SQL the non-reusable SQL will act as a drag against the other SQL (I call this shared pool thrashing) unless it is periodically removed by flushing. Figure 18 shows a PL/SQL package which can be used by the DBMS_JOB job queues to periodically flush the shared pool only when it exceeds a specified percent full.
CREATE OR REPLACE PROCEDURE flush_it( p_free IN NUMBER, num_runs IN NUMBER) IS --
CURSOR get_share IS SELECT
LEAST(MAX(b.value)/(1024*1024),SUM(a.bytes)/(1024*1024)) FROM v$sgastat a, v$parameter b
WHERE (a.pool='shared pool' AND a.name <> ('free memory')) AND b.name = 'shared_pool_size'; --
CURSOR get_var IS
SELECT value/(1024*1024) FROM v$parameter
WHERE name = 'shared_pool_size'; --
-- Following cursors from Steve Adams Nice_flush --
CURSOR reused_cursors IS
SELECT address || ',' || hash_value FROM sys.v_$sqlarea
WHERE executions > num_runs; cursor_string varchar2(30); --
CURSOR cached_sequences IS
SELECT sequence_owner, sequence_name FROM sys.dba_sequences
CURSOR candidate_objects IS
SELECT kglnaobj, decode(kglobtyp, 6, 'Q', 'P') FROM sys.x_$kglob
WHERE inst_id = userenv('Instance') AND
kglnaown = 'SYS' AND kglobtyp in (6, 7, 8, 9); object_name varchar2(128);
object_type char(1); --
-- end of Steve Adams Cursors --
todays_date DATE; mem_ratio NUMBER; share_mem NUMBER;
variable_mem NUMBER;
cur INTEGER;
sql_com VARCHAR2(60); row_proc NUMBER; --
BEGIN
OPEN get_share; OPEN get_var;
FETCH get_share INTO share_mem; FETCH get_var INTO variable_mem; mem_ratio:=share_mem/variable_mem; IF mem_ratio>p_free/100 THEN --
-- Following keep sections from Steve Adams nice_flush --
BEGIN
OPEN reused_cursors; LOOP
FETCH reused_cursors INTO cursor_string; EXIT WHEN reused_cursors%notfound;
sys.dbms_shared_pool.keep(cursor_string, 'C'); END LOOP; END; BEGIN OPEN cached_sequences; LOOP
FETCH cached_sequences INTO sequence_owner, sequence_name; EXIT WHEN cached_sequences%notfound;
sys.dbms_shared_pool.keep(sequence_owner || '.' || sequence_name, 'Q'); END LOOP; END; BEGIN OPEN candidate_objects; LOOP
FETCH candidate_objects INTO object_name, object_type; EXIT WHEN candidate_objects%notfound;
sys.dbms_shared_pool.keep('SYS.' || object_name, object_type); END LOOP;
END; --
-- end of Steve Adams section --
cur:=DBMS_SQL.OPEN_CURSOR;
DBMS_SQL.PARSE(cur,sql_com,dbms_sql.v7); row_proc:=DBMS_SQL.EXECUTE(cur);
DBMS_SQL.CLOSE_CURSOR(cur); END IF;
END flush_it;
Figure 18: Example Script to Run a Shared Pool Flush Routine
The command set to perform a flush on a once every 30 minute cycle when the pool reaches 95% full would be:
VARIABLE x NUMBER; BEGIN
dbms_job.submit(
:X,'BEGIN flush_it(95); END;',SYSDATE,'SYSDATE+(30/1440)’); END;
/ COMMIT;
(Always commit after assigning a job or the job will not be run and queued)
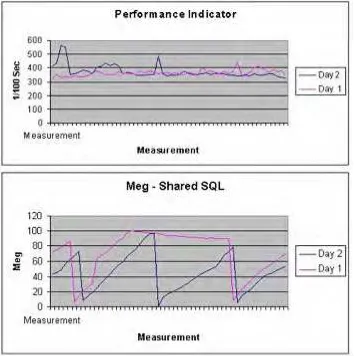
Figure 19: Graphs Showing Effects of Flushing
10 to 20 percent. Depending on the environment I have seen improvements of up to 40-50 percent.
One thing that made the analysis difficult was that on day 2 there were several large batch jobs run which weren’t run on day 1. The results still show that flushing has a positive effect on performance when the database is a mixed SQL environment with a large percentage of non-reusable SQL areas.
Guideline 3 also brings up an interesting point, you may already have over allocated the shared pool, in this case guideline 3 may result in you decreasing the size of the shared pool. In this situation the shared pool has become a cesspool filled with nothing but garbage SQL. After allocating enough memory for dictionary objects and other fixed areas and ensuring that the standard packages and such are pinned, you should only maintain a few megabytes above and beyond this level of memory for SQL statements. Since none of the code is being reused you want to reduce the hash search overhead as much as possible, you do this by reducing the size of the available SQL area memory so as few a number of statements are kept as possible.
What to Pin
In all of the guidelines stated so far I mention that the memory is usually allocated above and beyond that needed for fixed size areas and pinned objects. How do you determine what to pin? Generally speaking any package, procedure, function or cursor that is frequently used by your application should be pinned into the shared pool when the database is started. I suggest adding a “null” startup function to every in house generated package it essentially looks like Figure 20.
FUNCTION start_up RETURN number IS Ret NUMBER:=1; BEGIN
Ret:=0 RETURN ret; END start_up;
Figure 20: Example Null Startup Function
How do you determine what packages, procedures of functions to pin? Actually, Oracle has made this easy by providing the V$DB_OBJECT_CACHE view that shows all objects in the pool, and, more importantly, how they are being utilized. The script in Figure 21 provides a list of objects that have been loaded more than once and have executions greater than one. Some example output from this script is shown in figure 22. A rule of thumb is that if an object is being frequently executed and frequently reloaded it should be pinned into the shared pool.
rem
rem FUNCTION: Report Stored Object Statistics rem
column owner format a11 heading Schema
column name format a30 heading Object|Name
column namespace heading Name|Space
column type heading Object|Type
column kept format a4 heading Kept
column sharable_mem format 999,999 heading Shared|Memory column executions format 999,999 heading Executes set lines 132 pages 47 feedback off
@title132 'Oracle Objects Report' break on owner on namespace on type spool rep_out/&db/o_stat
select
OWNER, NAMESPACE, TYPE, NAME,
SHARABLE_MEM, LOADS,
EXECUTIONS, LOCKS, PINS, KEPT from
v$db_object_cache where
type not in (
'NOT LOADED','NON-EXISTENT','VIEW','TABLE','SEQUENCE') and executions>0 and loads>1 and kept='NO' order by owner,namespace,type,executions desc; spool off
set lines 80 pages 22 feedback on clear columns
clear breaks ttitle off
Figure 21: Script to Show Objects Which Should Be Kept
Date: 11/20/98 Page: 1
Time: 09:59 AM Oracle Objects Report AULTM
AGCD database Name Object Object Shared
Schema Space Type Name Memory LOADS Executes LOCKS PINS Kept
-- --- -- - --- --- ----
SYS BODY PACKAGE BODY DBMS_EXPORT_EXTENSION 6,957 1 1,338 1 0 NO
DBMS_SQL 11,016 1 50 1 0 NO
DBMS_SYS_SQL 21,428 1 50 1 0 NO
DBMS_DEFER_IMPORT_INTERNAL 4,070 1 50 1 0 NO
STANDARD 26,796 1 50 1 0 NO
DBMS_APPLICATION_INFO 4,585 1 8 1 0 NO
DBMS_OUTPUT 8,799 1 1 1 0 NO
TABLE/PROCEDURE PACKAGE DBMS_EXPORT_EXTENSION 12,269 1 1,355 1 0 NO
DBMS_DEFER_IMPORT_INTERNAL 10,662 1 51 1 0 NO
DBMS_SQL 6,960 1 50 1 0 NO
STANDARD 118,556 1 50 1 0 NO
DBMS_SYS_SQL 7,472 1 50 1 0 NO
DBMS_APPLICATION_INFO 11,569 1 9 1 0 NO
DBMS_OUTPUT 13,391 1 1 1 0 NO
Figure 22: Example Output From the Script In Figure 21.
Unfortunately in my active instance I already have the objects pinned that are required, but the example report in Figure 22 taken from one of my less active instances still shows the concept. Note that you only have to pin the package, not the package and package body.
Guideline 4: Determine usage patterns of packages, procedures, functions and cursors and pin those that are frequently used.
The Shared Pool and MTS
The use of the multi-threaded server option (MTS) in Oracle requires a sometimes dramatic increase in the size of the shared pool. This increase in the size of the shared pool caused by MTS is due to the addition of the user global areas required for sorting and message queues. If you are using MTS you should monitor the V$SGASTAT values for MTS related memory areas and adjust the shared pool memory allocations accordingly.
area if MTS is being used. This prevents the fragmentation problems that have been reported in shared pools when MTS is used without allocating the large pool. The parallel query option (PQO) in Oracle8 also makes use of the large pool area, depending on the number of users and degree of parallel, the large pool may require over 200 megabytes by itself in a PQO environment.
Large Pool Sizing
Sizing the large pool can be complex. The large pool, if configured must be at least 600 kilobytes in size. Usually for most MTS applications 600k is enough. However, if PQO is also used in your Oracle8 environment then the size of the large pool will increase dramatically. The V$SGASTAT dynamic performance view has a new column in Oracle8, POOL. The POOL column in the V$SGASTAT view is used to contain the pool area where that particular type of object is being stored. By issuing a summation select against the V$SGASTAT view a DBA can quickly determine the size of the large pool area currently being used.
SELECT name, SUM(bytes) FROM V$SGASTAT WHERE pool='LARGE POOL' GROUP BY ROLLUP(name);
The above select should be used when an "ORA-04031:Unable to allocate 16084 bytes of shared memory ("large pool", "unknown object", "large pool hea", "PX large pool") " error is received during operation with a large pool configured (the number of bytes specified may differ). When the above select is run, the resulting summary number of bytes will indicate the current size of the pool and show how close you are to your maximum as specified in the initialization parameter LARGE_POOL_SIZE. Generally increasing the large_pool by up to 100% will eliminate the ORA-04031 errors.
Oracle8i provides for automated sizing of the large pool. If PARALLEL_AUTOMATIC_TUNING is set to TRUE or if PARALLEL_MAX_SERVERS is set to a non-zero value then the LARGE_POOL_SIZE will be calculated, however, it can be over-ridden with a manually specified entry in the initialization file. Indeed, if an ORA-27102: Out of Memory error is received when you set either of these parameters (or both) you must either manually set LARGE_POOL_SIZE or reduce the value for PARALLEL_MAX_SERVERS. The following formula determines the set point for the LARGE_POOL_SIZE if it is not manually set:
(DOP^2*(4I-1)+2*DOP*3+4*DOP(I-1))*PEMS*USERS
Where
DOP – Degree of Parallel calculated from #CPU/NODE * #NODES
PEMS – Parallel execution message size – set with
PARALLEL_EXECUTION_MESSAGE_SIZE initialization parameter,
usually defaults to 2k or 4k but can be larger.
USERS – Number of concurrent users using parallel query
For a 2k PEMS with 4 concurrent users for a steadily increasing value for DOP the memory size is a quadratic function ranging from around 4 meg for 10 CPUs to 120 meg with 70 CPUs. This memory requirement is demonstrated in Figure 23.
Figure 23: Example Chart for 2k PEMS and 4 Concurrent Users Showing Memory Requirements as Number of CPUs Increases
On my NT4.0 Oracle8i, 8.1.3 test system I have 2 CPUs, set at 2 threads per cpu (DOP of 4) and then 4 threads per cpu (DOP of 8), message buffer of 4k and I performed multiple tests increasing the PARALLEL_MAX_SERVERS initialization parameter to see what the resulting increase in LARGE_POOL_SIZE would be, the results were:
PARALLEL_MAX_SERVERS DOP 4 LARGE_POOL_SIZE DOP 8 LARGE_POOL_SIZE
4 685,024 bytes
685,024 bytes
857,056 bytes 857,056 bytes
16 1,151,968 bytes
1,545,184 bytes
Notice that for a small number of CPUs the large pool size increase from an increase in parallel max servers isn't affected by changes in the number of parallel threads until the value of threads is large in respect to the number of CPUs.
For non-PQO systems a general rule of thumb is 5K of memory for each MTS user for the large pool area.
Guideline 5: In Oracle7when using MTS increase the shared pool size to
accommodate MTS messaging and queuing as well as UGA requirements. In Oracle8 use the Large Pool to prevent MTS from effecting the shared pool areas.
A Matter Of Hashing
statement are identical). This is another argument for using stored procedures and functions to perform operations and for the use of bind variables. In 8.0 the hash value is calculated on the first 100 and last 100 characters reducing the chances of multiple identical hash values for different SQL statements. In 8i the hash is calculated on the entire SQL text so multiple identical hashes should never occur.
If the number of large, nearly identical statements is high, then the number of times the parser has to compare a new SQL statement to existing SQL statements with the same hash value increases. This results in a higher statement overhead and poorer performance. You should identify these large statements and encourage users to re-write them using bind variables or to proceduralize them using PL/SQL. The report in Figure 24 will show if you have a problem with multiple statements being hashed to the same value.
Rem:
rem: FUNCTION: Shows by user who has possible rem: SQL reuse problems
rem:
column total_hash heading 'Total Hash|Values'
column same_hash heading 'SQL With|Same
Hash'
column u_hash_ratio format 999.999 heading 'SQL Sharing|Hash' start title80 'Shared Hash Value Report'
spool rep_out\&&db\shared_hash.lst break on report
compute sum of total_hash on report compute sum of same_hash on report select
a.username,
count(b.hash_value) total_hash,
count(b.hash_value)-count(unique(b.hash_value)) same_hash,
(count(unique(b.hash_value))/count(b.hash_value))*100 u_hash_ratio from
dba_users a,
v$sqlarea b
where
a.user_id=b.parsing_user_id group by
a.username; clear computes
Figure 24: Example Script to Report on Hashing Problems
Date: 11/20/98 Page: 1 Time: 11:40 AM Shared Hash Value Report AULTM DCARS database
Total Hash SQL With SQL Sharing USERNAME Values Same Hash Hash --- --- --- --- AULTM 129 0 100.000 DCARS 6484 58 99.105 MCNAIRT 20 0 100.000 PASSMAP 2 0 100.000 QDBA 109 0 100.000 RCAPS 270 0 100.000 RCOM 342 7 97.953 REPORTS1 28 0 100.000 SECURITY_ADMIN 46 0 100.000 SYS 134 0 100.000 --- ---
sum 7564 65
Figure 25: Hash Report
A quick glance at the report in Figure 25 shows that we need to look at the DCARS user to correct hashing problems they might be having and improve the reuse of SQL in the shared pool. However, look at the number of hash areas this user has accumulated, 6,484, if I run the report from Figure 13 it will out weigh the paper version of the Oracle documentation set. A faster way to find the hash values would be to do a self join and filter out the hash values that are duplicate. Sounds easy enough, but remember, the V$ tables have no rowids so you can’t use the classic methods, you have to find another column that will be different when the HASH_VALUE column in V$SQLAREA is the same. Look at the select in Figure 26.
select distinct a.hash_value from v$sqlarea a, v$sqlarea b, dba_users c where a.hash_value=b.hash_value and
a.parsing_user_id = c.user_id
and c.username='DCARS' and change to user you are concerned about
a.FIRST_LOAD_TIME != b.FIRST_LOAD_TIME
Figure 26: Example Select To Determine Duplicate Hash Values
Figure 27 has an example output from the above select.
DCARS:column hash_value format 99999999999 DCARS:set echo on
DCARS: select distinct a.hash_value from v$sqlarea a, v$sqlarea b, 2 dba_users c
3 where a.hash_value=b.hash_value and 4 a.parsing_user_id = c.user_id 5 and c.username='DCARS' and
HASH_VALUE --- -1595172473 -1478772040 -1344554312 -941902153 -807684425 -507978165 -270812489 441376718 784076104 979296206 1765990350 1945885214
Figure 26: Example Hash Select Output
Once you have the hash value you can pull the problem SQL statements from either V$SQLAREA or V$SQLTEXT very easily, look at Figure 27.
DCARS:select sql_text from v$sqlarea where hash_value='441376718';
SQL_TEXT
--- SELECT region_code, region_dealer_num, consolidated_dealer_num, dealer_name, dealer_status_code, dealer_type_code, mach_credit_code, parts_credit_code FROM dealer WHERE region_code = '32' AND
region_dealer_num = '6433'
SELECT region_code, region_dealer_num, consolidated_dealer_num, dealer_name, dealer_status_code, dealer_type_code, mach_credit_code, parts_credit_code FROM dealer WHERE region_code = '56' AND
region_dealer_num = '6273'
Figure 27: Example of Statements With Identical Hash Values But Different SQL
Long statements require special care to see that bind variables are used to prevent this problem with hashing. Another help for long statements is to use views to store values at an intermediate state thus reducing the size of the variable portion of the SQL. Notice in the example select in Figure 27 that the only difference between the two identically hashed statements is that the “region_code” and “region_dealer_num” comparison values are different, if bind variables had been used in these statements there would only have been one entry instead of two.
Monitoring Library and Data Dictionary
Caches
I've spent most of this article looking at the shared SQL area of the shared pool. Let's wrap up with a high level look at the library and data dictionary caches. The library cache area is monitored via the V$LIBRARYCACHE view and contains the SQL area, PL/SQL area, table, index and cluster cache areas. The data dictionary caches contain cache area for all data dictionary related definitions.
The script in Figure 28 creates a report on the library caches. The items of particular interest in the report generated by the script in Figure 28 (shown in Figure 29) are the various ratios.
rem
rem Title: libcache.sql rem
rem FUNCTION: Generate a library cache report rem
column namespace heading "Library Object" column gets format 9,999,999 heading "Gets"
column gethitratio format 999.99 heading "Get Hit%" column pins format 9,999,999 heading "Pins" column pinhitratio format 999.99 heading "Pin Hit%" column reloads format 99,999 heading "Reloads" column invalidations format 99,999 heading "Invalid" column db format a10
set pages 58 lines 80
start title80 "Library Caches Report" define output = rep_out\&db\lib_cache spool &output
select
namespace, gets,
gethitratio*100 gethitratio,
pins,
pinhitratio*100 pinhitratio,
RELOADS, INVALIDATIONS from
v$librarycache /
spool off
pause Press enter to continue set pages 22 lines 80
ttitle off undef output
Figure 28: Example Script To Monitor The Library Caches
because of the few accesses of that type of object. Notice that the Pin Hit% is also greater than 90% (except for indexes) this is also to be desired. The other goals of tuning this area are to reduce reloads to as small a value as possible (this is done by proper sizing and pinning) and to reduce invalidations. Invalidations happen when for one reason or another an object becomes unusable. However, if you must use flushing of the shared pool reloads and invalidations may occur as objects are swapped in and out of the shared pool. Proper pinning can reduce the number of objects reloaded and invalidated.
Guideline 7: In a system where there is no flushing increase the shared pool size in 20% increments to reduce reloads and invalidations and increase hit ratios.
Date: 11/21/98 Page: 1 Time: 02:51 PM Library Caches Report SYSTEM ORTEST1 database
Library Object Gets Get Hit% Pins Pin Hit% Reloads Invalid --- --- --- --- --- --- --- SQL AREA 46,044 99.17 99,139 99.36 24 16 TABLE/PROCEDURE 1,824 84.59 6,935 93.21 3 0 BODY 166 93.98 171 91.23 0 0 TRIGGER 0 100.00 0 100.00 0 0 INDEX 27 .00 27 .00 0 0 CLUSTER 373 98.12 373 97.59 0 0 OBJECT 0 100.00 0 100.00 0 0 PIPE 0 100.00 0 100.00 0 0
Figure 29: Example Of The Output From Library Caches Report
The data dictionary caches used to be individually tunable through several initialization parameters, now they are internally controlled. The script in Figure 30 should be used to monitor the overall hit ratio for the data dictionary caches.
rem
rem title: ddcache.sql
rem FUNCTION: report on the v$rowcache table rem HISTORY: created sept 1995 MRA
rem
start title80 "DD Cache Hit Ratio" spool rep_out\&db\ddcache
SELECT (SUM(getmisses)/SUM(gets)) RATIO FROM V$ROWCACHE
/
spool off
pause Press enter to continue ttitle off
The output from the script in Figure 30 is shown in Figure 31.
Date: 11/21/98 Page: 1 Time: 02:59 PM DD Cache Hit Ratio SYSTEM ORTEST1 database
RATIO --- .01273172
Figure 31: Example Output From Data Dictionary Script
The ratio reported from the script in Figure 30 should always be less than 1. The ratio corresponds to the number of times out of 100 that the database engine sought something from the cache and missed. A dictionary cache miss is more expensive than a data block buffer miss so if your ratio gets near 1 increase the size of the shared pool since the internal algorithm isn't allocating enough memory to the data dictionary caches.
Guideline 8: In any shared pool, if the overall data dictionary cache miss ratio exceeds 1 percent, increase the size of the shared pool.
In Summary
In section of the tuning paper we have discussed ways to monitor for what objects should be pinned, discussed multi-threaded server , looked at hashing problems and their resolution as well as examined classic library and data dictionary cache tuning. Including the guidelines from last months article we have established 8 guidelines for tuning the Oracle shared pool:
Guideline 1: If gross usage of the shared pool in a non-ad-hoc environment
exceeds 95% (rises to 95% or greater and stays there) establish a shared pool size large enough to hold the fixed size portions, pin reusable packages and procedures. Gradually increase shared pool by 20% increments until usage drops below 90% on the average.
Guideline 2: If the shared pool shows a mixed ad-hoc and reuse environment, establish a shared pool size large enough to hold the fixed size portions, pin reusable packages and establish a comfort level above this required level of pool fill. Establish a routine flush cycle to filter non-reusable code from the pool.
Guideline 3: If the shared pool shows that no reusable SQL is being used
megabytes (usually not more than 40) and allow the shared pool modified least recently used (LRU) algorithm to manage the pool. (also see guideline 8)
Guideline 4: Determine usage patterns of packages, procedures, functions and cursors and pin those that are frequently used.
Guideline 5: In Oracle7when using MTS increase the shared pool size to
accommodate MTS messaging and queuing as well as UGA requirements. In Oracle8 use the Large Pool to prevent MTS from effecting the shared pool areas.
Guideline 6: Use bind variables, PL/SQL (procedures or functions) and views to reduce the size of large SQL statements to prevent hashing problems.
Guideline 7: In a system where there is no flushing increase the shared pool size in 20% increments to reduce reloads and invalidations and increase object cache hit ratios.
Guideline 8: In any shared pool, if the overall data dictionary cache miss ratio exceeds 1 percent, increase the size of the shared pool.
Using these guidelines and the scripts and techniques you should be well on the way towards a well tuned and well performing shared pool.
Tuning Checkpoints
Checkpoints provide for concurrency in an Oracle database. Checkpoints write out timestamp and SCN information as well as dirty blocks to the database files.Pre-7.3.4 the checkpoint process was optional, now it is required.
Checkpoints provide for rolling forward after a system crash. Data is applied from the time of the last checkpoint forward from the redo entries. Checkpoints also provide for reuse of redo logs. When a redo log is filled the LGWR process automatically switches to the next available log. All data in the now inactive log is written to disk by an automatic checkpoint. This frees the log for reuse or for archiving.
Checkpoints occur when a redo log is filled, when the INIT.ORA parameter LOG_CHECKPOINT_INTERVAL ORACLE7 is reached (Total bytes written to a redo log), or the elapsed time has reached the INIT.ORA parameter LOG_CHECKPOINT_TIMEOUT expressed in seconds or every three seconds, or when an ALTER SYSTEM command is issued with the CHECKPOINT option specified.
required recovery times. To reduce checkpoints to only happen on log switches, set LOG_CHECKPOINT_INTERVAL to larger than your redo log size, and set LOG_CHECKPOINT_TIMEOUT to zero.
If checkpoints still cause performance problems, set the INIT.ORA parameter CHECKPOINT_PROCESS to TRUE to start the CKPT process running. This will free the DBWR from checkpoint duty and increase performance. The INIT.ORA parameter PROCESSES may also have to be increased. Note that on Oracle8 and greater the checkpoint process is not optional and is started along with the other Oracle instance processes.
Another new option with Oracle8i is the concept of fast-start checkpointing. In order to configure fast-start checkpointing you set the initialization parameter FAST_START_IO_TARGET. The FAST_START_IO_TARGET parameter sets the number of IO operations that Oracle will attempt to limit itself to before writing a checkpoint. This feature is only available with Oracle 8i Enterprise Edition.
Other initialization parameters that control checkpointing are:
LOG_BUFFER_SIZE – should be set such that there aren’t large numbers of small writes and the overall write tiome isn’t too long, usually not more than 1 megabyte.
LOG_SMALL_ENTRY_MAX_SIZE (Gone in 8i) sets the size in bytes for the largest copy to the redo buffers that occurs under the redo allocation latch. Decreasing the size of this parameter will reduce contention for the redo allocation latch.
LOG_SIMULTANEOUS_COPIES (Gone to “_” in 8i) set to twice the number of CPUs to reduce contention for the redo copy latches by increasing the number of latches.
LOG_ENTRY_PREBUILD_THRESHOLD( Gone to “_” in 8.0, gone in 8i) sets the number of bytes of redo to gather before copying to the log buffer. For multi-CPU systems increasing this value can be beneficial.
Tuning Redo Logs
To tune redo logs you should:
Actually tune LGWR process to optimize log writes
LGWR writes when log buffers 1/3 full, or on COMMIT
Be sure logs are not in contention with each other or other files
To Determine average transaction size as far as redo buffer writes:
(redo size + redo wastage)
--- Redo writes
Use data from V$SYSSTAT. Size your log buffers to near this size, error on too much rather than too little.
Size actual redo logs such that they switch every thirty minutes, or based on the amount of data you can afford to lose (loss of the active redo log results in loss of its data.)
Redo logs maintain a complete history of data and database changing transactions. Redo logs are critical for recovery and operation of the Oracle database system. Unfortunately redo logs are another structure that is difficult to tune before an application system goes active. The majority of tuning efforts with redo logs deal with two important issues:
1. Minimize the impact of the redo log/archive log/checkpoint processes on database performance.
2. Maximize recoverability of the database
At times these two goals may be in opposition since by maximizing recoverability (by reducing time to recovery for example) you will cause a performance impact. I am afraid you will have to balance these two goals while dealing with redo log tuning, however one thing to remember is that you will (hopefully) spend much more time dealing with an operational database than you will recovering a database so in the greater scheme of things perhaps optimizing for performance is the major goal you should attempt to reach.
Redo Log Sizing
The size of a redo log depends on the transaction volume within your database. Unfortunately there are no magic formulae to apply that will give you a size value, it is completely empirically derived. Oracle requires at least two groups with one redo log member per group for Oracle to start. If you have archive logging enabled this should b pushed to a minimum of three groups of one redo log member each. I prefer a minimum of five groups of two mirrored members each for archive logging.
can they afford to lose? The value they give you for data will probably relate to a time interval such as “we can lose an hours worth of data but no more”. If you are given a time interval then you need to size the logs such that a log switch happens approximately at that interval during normal usage.
Log switch information is contained in the various versions of the v$log_hist or v$log_history views. Log switch information is also contained in the alert log. Once you establish how much data you can afford to lose (based on a time interval) monitor your views or alert log to find how often log switches are happening and adjust the size up or down to meet your requirement. Figure 32 shows a script to generate log switch statistics.
REM NAME :log_hist.sql
REM PURPOSE:Provide info on logs for last 24 hour since last log switch REM USE : From SQLPLUS
REM Limitations : None REM
COLUMN thread# FORMAT 999 HEADING 'Thrd#' COLUMN sequence# FORMAT 99999 HEADING 'Seq#'
COLUMN first_change# HEADING 'Low#'
COLUMN next_change# HEADING 'High#'
COLUMN first_time HEADING 'Accessed'
SET LINES 80
@title80 "Log History Report" SPOOL rep_out\&db\log_hist REM
SELECT thread#, sequence#, first_change#,next_change#,
TO_CHAR(a.first_time,'dd-mon-yyyy hh24:mi:ss') first_time FROM
v$log_history a WHERE
a.first_time >
(SELECT b.first_time-1
FROM v$log_history b WHERE b.next_change# =
(SELECT MAX(c.next_change#) FROM v$log_history c)); SPOOL OFF
SET LINES 80 CLEAR COLUMNS TTITLE OFF
PAUSE Press enter to continue
Figure 32: Script to Generate redo Log Switch Information
Date: 04/02/99 Page: 1 Time: 09:58 AM Log History Report SYSTEM DMDB database
Thrd# Seq# Low# High# Accessed
--- --- --- --- --- 1 71 66879 66977 30-mar-1999 11:13:04 1 72 66977 67066 30-mar-1999 11:13:28 1 73 67066 67160 30-mar-1999 11:13:43 1 74 67160 67229 30-mar-1999 11:13:53 1 75 67229 67303 30-mar-1999 11:14:02
. . .
1 248 104705 104716 30-mar-1999 16:04:57 1 249 104716 104723 30-mar-1999 16:13:46 1 250 104723 105257 30-mar-1999 16:13:47 1 251 105257 105963 30-mar-1999 16:28:36 181 rows selected.
Press enter to continue
Figure 33: Output From Redo Log Switch Script
Of course, without knowing the current size of the redo logs the above information does us little good, the script in figure 34 will document the size of your redo logs and the location of their files.
REM NAME: log_file.sql
REM FUNCTION: Report on Redo Logs Physical files REM
COLUMN group# FORMAT 999999 COLUMN member FORMAT a40
COLUMN meg FORMAT 9,999
REM
SET LINES 80 PAGES 60 FEEDBACK OFF VERIFY OFF START title80 'Redo Log Physical Files' BREAK ON group#
SPOOL rep_out\&db\rdo_file REM
SELECT
a.group#,a.member,b.bytes,b.bytes/(1024*1024) meg FROM
sys.v_$logfile a, sys.v_$log b WHERE
a.group#=b.group# ORDER BY
group#; SPOOL OFF CLEAR COLUMNS CLEAR BREAKS TTITLE OFF
SET PAGES 22 FEEDBACK ON VERIFY ON PAUSE Press enter to continue
The output from the above script is shown in figure 35.
Date: 04/02/99 Page: 1 Time: 10:10 AM Redo Log Physical Files SYSTEM DMDB database
GROUP# MEMBER BYTES MEG --- --- --- --- 1 C:\ORACLE1\ORTEST1\REDO\LOG4DMDB.ORA 1048576 1 2 D:\ORACLE2\ORTEST1\REDO\LOG3DMDB.ORA 1048576 1 3 E:\ORACLE3\ORTEST1\REDO\LOG2DMDB.ORA 1048576 1 4 F:\ORACLE4\ORTEST1\REDO\LOG1DMDB.ORA 1048576 1 Press enter to continue
Figure 35: Example Output of Redo Log File Report
Based on our desire to maximize performance and meet recoverability guidelines (only lose a maximum of an hours data) we need to increase the size of the above redo logs since they are switching about every ten seconds.
Another item to adjust that deals with redo logs is the size of the log buffer. The log buffer is written to in a circular fashion and as the buffer fills (actually at about a third full) the LGWR process starts to write it out to the redo log. Too small a log buffer setting and you will incur excessive IO to the redo logs and work the LGWR to death, too large a value and the writes are delayed. I usually suggest no larger a size than 1 megabyte for the log_buffer parameter and that the size be either equal to or an equal divisor of the actual redo log size. Unless you have very small redo logs the default value for log_buffers supplied by Oracle is too small.
Tuning Rollback Segments
It is difficult if not impossible to proactively tune rollback segments. The reason for this difficulty in the tuning of rollback segments is that they depend on the size of transactions for their sizing information and you usually won't know the