75 LAMPIRAN A
HASIL UJI KERAGAMAN BOBOT TABLET LIKUISOLID IBUPROFEN
Hasil Uji Keragaman Bobot Tablet Formula A No
76
Hasil Uji Keragaman Bobot Tablet Formula B No
77
Hasil Uji Keragaman Bobot Tablet Formula C No
Replikasi I Replikasi II Replikasi III Bobot
Hasil Uji Keragaman Bobot Tablet Formula D
No
78 LAMPIRAN B
HASIL UJI KESERAGAMAN KANDUNGAN TABLET LIKUISOLID IBUPROFEN
Hasil Uji Keseragaman Kandungan Tablet Formula A Replikasi I Abs W sampel (mg) C sampel
(µg/ml)
C teoritis
(µg/ml) Kadar (%) 0,534 764,6 287,90 286,73 100,41 0,524 763,1 282,45 286,16 98,70 0,528 763,0 284,63 286,13 99,48 0,531 763,8 286,26 286,43 99,94 0,52 756,8 280,27 283,8 98,75 0,533 770,2 287,36 288,83 99,49 0,541 768,3 291,72 288,11 101,25 0,528 773,5 284,63 290,06 98,13 0,527 767,8 284,08 287,93 98,67 0,526 764,7 283,54 286,76 98,88 Rata-rata 99,37
SD 0,95
79
Hasil Uji Keseragaman Kandungan Tablet Formula A ReplikasiII Abs W sampel (mg) C sampel Rata-rata 99,77
SD 0,74
KV 0,74
Hasil Uji Keseragaman Kandungan Tablet Formula A Replikasi III Abs W sampel
Rata-rata 99,81
SD 1,01
80
Hasil Uji Keseragaman Kandungan Tablet Formula B Replikasi I Abs W sampel Rata-rata 100,01
SD 1,06
KV 1,06
Hasil Uji Keseragaman Kandungan Tablet Formula B Replikasi II Abs W sampel
Rata-rata 100,09 SD 1,12
81
Hasil Uji Keragaman Kandungan Tablet Formula B ReplikasiIII Abs W sampel (mg) C sampel Rata-rata 100,64
SD 1,11
KV 1,11
Hasil Uji Keseragaman Kandungan Tablet Formula C Replikasi I Abs W sampel (mg) C sampel
Rata-rata 99,39
SD 1,01
82
Hasil Uji Keseragaman Kandungan Tablet Formula C ReplikasiII Abs W sampel Rata-rata 98,94
SD 0,74
KV 0,74
Hasil Uji Keseragaman Kandungan Tablet Formula C Replikasi III Abs W sampel (mg) C sampel Rata-rata 98,94
SD 0,97
83
Hasil Uji Keseragaman Kandungan Tablet Formula D Replikasi I Abs W sampel (mg) C sampel
Rata-rata 99,66
SD 1,30
KV 1,30
Hasil Uji Keseragaman Kandungan Tablet Formula D Replikasi II Abs W sampel (mg) C sampel Rata-rata 101,10
SD 1,22
84
Hasil Uji Keseragaman Kandungan Tablet Formula D Replikasi III Abs W sampel (mg) C sampel
(µg/ml)
C teoritis
(µg/ml) Kadar (%) 0,552 788,6 297,72 295,73 100,67 0,556 803,1 299,90 301,16 99,58 0,553 799,4 298,26 299,78 99,50 0,561 788,6 302,63 295,73 102,33 0,559 806,2 301,54 302,33 99,74 0,558 798,7 300,99 299,51 100,49 0,552 799,2 297,72 299,70 99,34 0,562 789,6 303,17 296,10 102,39 0,559 801,3 301,54 300,49 100,35 0,563 789,6 303,72 296,10 102,57 Rata-rata 100,70
SD 1,28
LAMPIRAN C
HASIL PENETAPAN KADAR TABLET LIKUISOLID IBUPROFEN
Formula Rep Absorbansi Csampel (μg/ml)
Cteoritis (μg/ml)
Kadar (%)
Rata-rata ±
SD KV
I 0,553 298,26 300,11 99,38 100,30 0,82
A II 0,559 301,54 299,96 100,52 ±
III 0,562 303,17 300,23 100,98 0,82
I 800,8 0,551 297,17 300,30 98,64 0,39
B II 799,7 0,549 296,08 299,89 ±
III 795,0 0,543 292,81 298,13 0,38
I 795,6 0,543 292,81 298,35 98,64 0,57
C II 795,4 0,545 293,90 298,28 ±
III 799,9 0,552 297,72 299,96 0,56
I 799,7 0,553 298,26 299,89 98,58 0,78
D II 796,3 0,544 293,35 298,61 ±
III 796,5 0,543 292,81 298,69 0,77 0,82
90 LAMPIRAN E
CONTOH PERHITUNGAN
Contoh perhitungan indeks kompresibilitas dan Hausner ratio:
91 Contoh perhitungan akurasi & presisi:
Absorbansi = 0,558 → y = 0,0018x + 0,0061
Konsentrasi sebenarnya = 300,99 ppm Konsentrasi teoritis = 300,45 ppm
% perolehan kembali = (konsentrasi sebenarnya / konsentrasi teoritis) x 100%
92
Formula A replikasi 1 pada t = 10 menit % obat terlepas =
Contoh perhitungan AUC pada disolusi:
Rumus:
Formula A replikasi 1 Wtn-1 = 106,9
Luas □ = 60 x penetapan kadar x dosis
93 = 12035,6
% ED Formula A replikasi 1= (∑ AUC / luas □) x 100%
94 LAMPIRAN F
HASIL UJI STATISTIK KEKERASAN TABLET LIKUISOLID IBUPROFEN ANTAR FORMULA
Oneway
Descriptives
Kekerasan
N Mean Std.
Deviation Std. Error
95% Confidence
Interval for
Mean Minimum Maximum
Lower
Bound Upper
Bound
Formula A 3 7.2900 1.45523 .84018 3.6750 10.9050 5.61 8.16
Formula B 3 8.1767 .24379 .14075 7.5711 8.7823 7.90 8.36
Formula C 3 7.7567 .41621 .24030 6.7227 8.7906 7.36 8.19
Formula D 3 7.3600 .89168 .51481 5.1449 9.5751 6.62 8.35
Total 12 7.6458 .84197 .24306 7.1109 8.1808 5.61 8.36
Test of Homogeneity of Variances Kekerasan
Levene Statistic df1 df2 Sig.
95 ANOVA Kekerasan
Sum of Squares df Mean Square F Sig. Between Groups 1.507 3 .502 .639 .611 Within Groups 6.291 8 .786
Total 7.798 11
96 LAMPIRAN G
HASIL UJI STATISTIK KERAPUHAN TABLET LIKUISOLID IBUPROFEN ANTAR FORMULA
Oneway
Descriptives
Kerapuhan
N Mean Std.
Deviation Std. Error
95% Confidence
Interval for
Mean Minimum Maximum
Lower
Bound Upper
Bound
Formula A 3 .4400 .07000 .04041 .2661 .6139 .37 .51
Formula B 3 .1067 .04041 .02333 .0063 .2071 .06 .13
Formula C 3 .1433 .03215 .01856 .0635 .2232 .12 .18
Formula D 3 .1433 .04041 .02333 .0429 .2437 .12 .19
Total 12 .2083 .14640 .04226 .1153 .3014 .06 .51
Test of Homogeneity of Variances
Kerapuhan
Levene Statistic df1 df2 Sig.
97 ANOVA Kerapuhan
Sum of Squares df
Mean
Square F Sig. Between Groups .217 3 .072 31.502 .000 Within Groups .018 8 .002
Total .236 11
Multiple Comparisons Kerapuhan
LSD
(I) Formula (J) Formula
Mean Difference
(I-J) Std. Error Sig.
95% Confidence Interval Lower Bound Upper Bound Formula A Formula B .33333* .03916 .000 .2430 .4236
Formula C .29667* .03916 .000 .2064 .3870
Formula D .29667* .03916 .000 .2064 .3870
Formula B Formula A -.33333* .03916 .000 -.4236 -.2430 Formula C -.03667 .03916 .376 -.1270 .0536 Formula D -.03667 .03916 .376 -.1270 .0536 Formula C Formula A -.29667* .03916 .000 -.3870 -.2064
Formula B .03667 .03916 .376 -.0536 .1270
Formula D .00000 .03916 1.000 -.0903 .0903 Formula D Formula A -.29667* .03916 .000 -.3870 -.2064
Formula B .03667 .03916 .376 -.0536 .1270
Formula C .00000 .03916 1.000 -.0903 .0903 *. The mean difference is significant at the 0.05 level.
99 LAMPIRAN H
HASIL UJI STATISTIK WAKTU HANCUR TABLET LIKUISOLID IBUPROFEN ANTAR FORMULA
Oneway
Descriptives Waktu_hancur
N Mean Std.
Deviation Std. Error
95% Confidence Interval for
Mean Minimum Maximum
Lower
Test of Homogeneity of Variances
Waktu_hancur
Levene Statistic df1 df2 Sig.
100 ANOVA Waktu_hancur
Sum of
Squares df
Mean
Square F Sig. Between Groups .162 3 .054 2.157 .171 Within Groups .201 8 .025
Total .363 11
101 LAMPIRAN I
HASIL UJI STATISTIK PENETAPAN KADAR TABLET LIKUISOLID IBUPROFEN ANTAR FORMULA
Descriptives
Penetapan_Kadar
N Mean Std.
Deviation Std. Error
95% Confidence
Interval for
Mean Minimum Maximum
Lower
Bound
Upper
Bound
Formula A 3 100.293 .8237 .4755 98.247 102.339 99.38 100.98
Formula B 3 98.636 .3787 .2186 97.695 99.577 98.22 98.96
Formula C 3 98.640 .5631 .3251 97.241 100.038 98.14 99.25
Formula D 3 98.576 .7721 .4458 96.658 100.494 98.03 99.46
Total 12 99.036 .9436 .2724 98.437 99.636 98.03 100.98
Test of Homogeneity of Variances Penetapan_Kadar
Levene Statistic df1 df2 Sig.
102 ANOVA Penetapan_Kadar
Sum of
Squares df
Mean
Square F Sig. Between Groups 6.324 3 2.108 3.651 .033 Within Groups 3.471 8 .434
Total 9.795 11
103 LAMPIRAN J
HASIL UJI STATISTIK DISOLUSI BERDASARKAN %ED60 TABLET LIKUISOLID IBUPROFEN ANTAR FORMULA
Descriptives
% ED60
N Mean Std.
Deviation Std. Error
95% Confidence
Interval for
Mean Minimum Maximum
Lower
Bound
Upper
Bound
Formula A 3 62.7133 .31086 .17947 61.9411 63.4855 62.39 63.01
Formula B 3 70.9033 .44061 .25438 69.8088 71.9979 70.61 71.41
Formula C 3 74.5967 .04619 .02667 74.4819 74.7114 74.57 74.65
Formula D 3 77.2500 .16371 .09452 76.8433 77.6567 77.11 77.43
Total 12 71.3658 5.72922 1.65388 67.7257 75.0060 62.39 77.43
Test of Homogeneity of Variances % ED60
Levene Statistic df1 df2 Sig.
104 ANOVA % ED60
Sum of
Squares df Mean Square F Sig. Between Groups 360.424 3 120.141 1503.176 .000 Within Groups .639 8 .080
Total 361.063 11
Multiple Comparisons % ED60
LSD
(I) Formula (J) Formula Mean Difference
(I-J) Std. Error Sig.
95% Confidence Interval Lower Bound Upper Bound Formula A Formula B -8.19000* .23083 .000 -8.7223 -7.6577
Formula C -11.88333* .23083 .000 -12.4156 -11.3510 Formula D -14.53667* .23083 .000 -15.0690 -14.0044 Formula B Formula A 8.19000* .23083 .000 7.6577 8.7223
Formula C -3.69333* .23083 .000 -4.2256 -3.1610 Formula D -6.34667* .23083 .000 -6.8790 -5.8144 Formula C Formula A 11.88333* .23083 .000 11.3510 12.4156 Formula B 3.69333* .23083 .000 3.1610 4.2256 Formula D -2.65333* .23083 .000 -3.1856 -2.1210 Formula D Formula A 14.53667* .23083 .000 14.0044 15.0690 Formula B 6.34667* .23083 .000 5.8144 6.8790 Formula C 2.65333* .23083 .000 2.1210 3.1856 *. The mean difference is significant at the 0.05 level.
106 LAMPIRAN K
HASIL UJI STATISTIK KONSTANTA LAJU DISOLUSI TABLET LIKUISOLID IBUPROFEN ANTAR FORMULA
Descriptives
K_disolusi
N Mean Std.
Deviation Std. Error
95% Confidence
Interval for
Mean Minimum Maximum
Lower
Bound
Upper
Bound
Formula A 3 .054367 .0021595 .0012468 .049002 .059731 .0521 .0564
Formula B 3 .077100 .0071547 .0041308 .059327 .094873 .0701 .0844
Formula C 3 .085733 .0033561 .0019376 .077396 .094070 .0825 .0892
Formula D 3 .093467 .0038136 .0022018 .083993 .102940 .0903 .0977
Total 12 .077667 .0157742 .0045536 .067644 .087689 .0521 .0977
Test of Homogeneity of Variances K_disolusi
Levene Statistic df1 df2 Sig.
107 ANOVA K_disolusi
Sum of
Squares df
Mean
Square F Sig. Between Groups .003 3 .001 42.024 .000 Within Groups .000 8 .000
Total .003 11
Multiple Comparisons K_disolusi
LSD
(I) Formula (J) Formula Mean Difference
(I-J) Std. Error Sig.
95% Confidence Interval Lower Bound Upper Bound Formula A Formula B -.0227333* .0036892 .000 -.031241 -.014226
Formula C -.0313667* .0036892 .000 -.039874 -.022859 Formula D -.0391000* .0036892 .000 -.047607 -.030593 Formula B Formula A .0227333* .0036892 .000 .014226 .031241 Formula C -.0086333* .0036892 .047 -.017141 -.000126 Formula D -.0163667* .0036892 .002 -.024874 -.007859 Formula C Formula A .0313667* .0036892 .000 .022859 .039874 Formula B .0086333* .0036892 .047 .000126 .017141 Formula D -.0077333 .0036892 .069 -.016241 .000774 Formula D Formula A .0391000* .0036892 .000 .030593 .047607 Formula B .0163667* .0036892 .002 .007859 .024874 Formula C .0077333 .0036892 .069 -.000774 .016241 *. The mean difference is significant at the 0.05 level.
109 LAMPIRAN L
HASIL IBUPROFEN TERLARUT DALAM PEG 400 DAN AQUADEST SELAMA 24 JAM
110 LAMPIRAN M
HASIL UJI KURVA BAKU
ƩX2 ƩXY ƩY2 N Residual SS RDF Replikasi 1 562312,5 1029,5153 1,8853 6 4,45.10-4 3 Replikasi 2 561195,9 1038,6682 1,9226 6 2,13. 10-4 3 Replikasi 3 560078,9 1040,2193 1,9342 6 2,266. 10-3 3
Pooled regression 2,91. 10-3 9
Common regression 1683587 3108,4028 5,7422 3,13.10-3 11
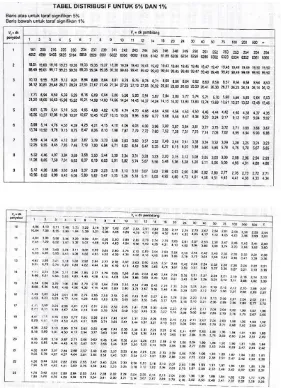
F hitung = 0,3287 < Ftabel0,05(3,9)= 4,26, karena F hitung lebih kecil dari F tabel maka tidak ada perbedaan bermakna antar persamaan regresi.
112 LAMPIRAN N
114 LAMPIRAN O
115 LAMPIRAN P
116 LAMPIRAN Q
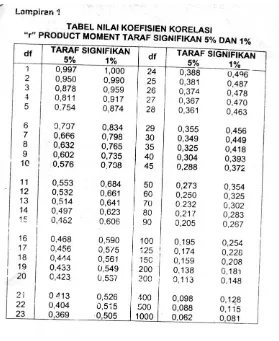
117 LAMPIRAN R
TABEL UJI R
118 LAMPIRAN S
119