68
LAMPIRAN A
HASIL UJI KERAGAMAN BOBOT TABLET LIKUISOLID IBUPROFEN
Hasil Uji Keragaman Bobot Tablet Formulasi A
No
Replikasi I Replikasi II Replikasi III Bobot
Tablet (mg)
Y (%)
Bobot Tablet (mg)
Y (%)
Bobot Tablet (mg)
Y (%)
1 764,6 99,25 756,8 99,96 758,9 101,12
2 763,1 99,06 775,3 102,41 774,2 103,16
3 763,0 99,05 754,9 99,71 756,2 100,76
4 763,8 99,15 757,9 100,11 756,7 100,83
5 756,8 98,24 760 100,39 755,8 100,71
6 770,2 99,98 764,2 100,94 756,3 100,77
7 768,3 99,73 759,9 100,37 770,3 102,64
8 773,5 100,41 755,8 99,83 754,8 100,57
9 767,8 99,67 763,2 100,81 749,9 99,92
10 764,7 99,27 762,5 100,72 745,6 99,35
Rata-rata 765,58 99,38 761,05 100,52 757,87 100,98
PK (%) 99,38 100,52 100,98
SD 0,60 0,78 1,14
KV 0,60 0,78 1,13
69
Hasil Uji Keragaman Bobot Formulasi B
No
Replikasi I Replikasi II Replikasi III Bobot
Tablet (mg)
Y (%)
Bobot Tablet (mg)
Y (%)
Bobot Tablet (mg)
Y (%)
1 798,6 99,33 811,7 99,38 798,7 98,16
2 791,6 98,46 798,7 97,79 788,9 96,95
3 799,1 99,39 799,8 97,93 812,3 99,83
4 812,9 101,11 830 101,63 821,4 100,95
5 798,8 99,35 798,6 97.,78 820,5 100,83
6 819,2 101,89 822,1 100,66 813,7 100,00
7 807,6 100,45 813,4 99,59 817 100,40
8 821,2 102,14 831,2 101,77 799,2 98,22
9 800,9 99,61 808,9 99,04 829,1 101,89
10 819,1 101,88 805,5 98,63 820 100,77
Rata-rata 806,90 100,36 811,99 99,42 812,08 99,80
PK (%) 100,36 99,42 99,80
SD 1,32 1,50 1,54
70
Hasil Uji Keragaman Bobot Formula C
No
Replikasi I Replikasi II Replikasi III Bobot
Tablet (mg)
Y (%)
Bobot Tablet (mg)
Y (%)
Bobot Tablet (mg)
Y (%)
1 812,1 99,59 809,5 100,58 799,2 99,25
2 819 100,43 817,6 101,58 793 98,48
3 807,8 99,06 800,2 99,42 789,9 98,10
4 813,4 99,74 809,3 100,55 803,1 99,73
5 799,9 98,09 798,3 99,19 816,7 101,42
6 798,2 97,88 812,2 100,91 813,5 101,03
7 802,2 98,37 811,1 100,78 809,1 100,48
8 811,3 99,49 809 100,52 799,4 99,28
9 799,1 97,99 798,2 99,17 811,2 100,74
10 817,6 100,26 820,1 101,90 805,2 100,00
Rata-rata 808,06 99,09 808,55 100,46 804,03 99,85
PK (%) 99,09 100,46 99,85
SD 0.95 0,94 1,09
71
Hasil Uji Keragaman Bobot Formula D
No
Replikasi I Replikasi II Replikasi III Bobot
Tablet (mg)
Y (%)
Bobot Tablet (mg)
Y (%)
Bobot Tablet (mg)
Y (%)
1 801,2 99,99 798,6 98,27 811,2 100,60
2 804,1 100,35 789,9 97,20 803,1 99,59
3 800,8 99,94 799,3 98,35 815,2 101,09
4 810 101,09 803,6 98,88 800,3 99,24
5 809,6 101,04 800,9 98,55 806,2 99,98
6 799,7 99,80 807,6 99,37 798,7 99,05
7 810,3 101,12 800,4 98,49 799,2 99,11
8 798,9 99,70 815,2 100,31 789,6 97,92
9 796,2 99,37 812,7 100,00 801,3 99,37
10 802,9 100,20 809,2 99,57 809,3 100,36
Rata-rata 803,37 100,26 803,74 98,90 803,41 99,63
PK (%) 100,26 98,90 99,63
SD 0,63 0,93 0,91
72
LAMPIRAN B
HASIL UJI KESERAGAMAN KANDUNGAN TABLET LIKUISOLID IBUPROFEN
Hasil uji Keseragaman Kandungan Tablet Formula A Replikasi I
Abs W sampel (mg) C sampel (µg/ml) C teoritis (µg/ml) Kadar (%)
0,534 764,6 287,90 286,73 100,41
0,524 763,1 282,45 286,16 98,70
0,528 763 284,63 286,13 99,48
0,531 763,8 286,26 286,43 99,94
0,52 756,8 280,27 283,80 98,75
0,533 770,2 287,36 288,83 99,49
0,541 768,3 291,72 288,11 101,25
0,528 773,5 284,63 290,06 98,13
0,527 767,8 284,08 287,93 98,67
0,526 764,7 283,54 286,76 98,88
Rata-rata 99,37
SD 0,95
KV 0,95
Hasil Uji Keseragaman Kandungan Tablet Formula A ReplikasiII
Abs W sampel (mg) C sampel (µg/ml) C teoritis (µg/ml) Kadar (%)
0,522 756,8 281,36 283,80 99,14
0,541 775,3 291,72 290,74 100,34
0,519 754,9 279,72 283,09 98,81
0,532 757,9 286,81 284,21 100,91
0,53 760 285,72 285,00 100,25
0,526 764,2 283,54 286,58 98,94
0,527 759,9 284,08 284,96 99,69
0,521 755,8 280,81 283,43 99,08
0,531 763,2 286,26 286,20 100,02
0,533 762,5 287,36 285,94 100,50
Rata-rata 99,77
SD 0,74
73
Hasil Uji Keseragaman Kandungan Tablet Formula A Replikasi III
Abs W sampel (mg) C sampel (µg/ml) C teoritis (µg/ml) Kadar (%)
0,522 758,9 281,36 284,59 98,86
0,536 774,2 288,99 290,33 99,54
0,523 756,2 281,90 283,58 99,41
0,534 756,7 287,90 283,76 101,46
0,522 755,8 281,36 283,43 99,27
0,531 756,3 286,26 283,61 100,94
0,526 770,3 283,54 288,86 98,16
0,525 754,8 282,99 283,05 99,98
0,52 749,9 280,27 281,21 99,66
0,523 745,6 281,90 279,60 100,82
Rata-rata 99.81
SD 1.01
KV 1.01
Hasil Uji Keseragaman Kandungan Tablet Formula B Replikasi I
Abs W sampel (mg) C sampel (µg/ml) C teoritis (µg/ml) Kadar (%)
0,552 798,6 297,72 299,48 99,41
0,55 791,6 296,63 296,85 99,92
0,552 799,1 297,72 299,66 99,35
0,554 812,9 298,81 304,84 98,02
0,550 798,8 296,63 299,55 99,02
0,567 819,2 305,90 307,20 99,58
0,560 807,6 302,08 302,85 99,75
0,566 821,2 305,35 307,95 99,16
0,551 800,9 297,17 300,34 98,95
0,562 819,1 303,17 307,16 98,70
Rata-rata 99,19
SD 0,55
74
Hasil Uji Keseragaman Kandungan Tablet Formula B Replikasi II
Abs W sampel (mg) C sampel (µg/ml) C teoritis (µg/ml) Kadar (%)
0,562 811,7 303,17 304,39 99,60
0,552 798,7 297,72 299,51 99,40
0,551 799,8 297,17 299,93 99,08
0,565 830 304,81 311,25 97,93
0,556 798,6 299,90 299,48 100,14
0,568 822,1 306,44 308,29 99,40
0,566 813,4 305,35 305,03 100,11
0,580 831,2 312,99 311,70 100,41
0,559 808,9 301,54 303,34 99,41
0,561 805,5 302,63 302,06 100,19
Rata-rata 99,57
SD 0,72
KV 0,73
Hasil Uji Keragaman Kandungan Tablet Formula B ReplikasiIII
Abs W sampel (mg) C sampel (µg/ml) C teoritis (µg/ml) Kadar (%)
0,550 798,7 296,63 299,51 99,04
0,551 788,9 297,17 295,84 100,45
0,560 812,3 302,08 304,61 99,17
0,566 821,4 305,35 308,03 99,13
0,570 820,5 307,53 307,69 99,95
0,571 813,7 308,08 305,14 100,96
0,569 817 306,99 306,38 100,20
0,554 799,2 298,81 299,70 99,70
0,573 829,1 309,17 310,91 99,44
0,562 820 303,17 307,50 98,59
Rata-rata 99,66
SD 0,73
75
Hasil Uji Keseragaman Kandungan Tablet Formula C Replikasi I
Abs W sampel (mg) C sampel (µg/ml) C teoritis (µg/ml) Kadar (%)
0,568 812,1 306,44 304,54 100,63
0,570 819 307,53 307,13 100,13
0,566 807,8 305,35 302,93 100,80
0,560 813,4 302,08 305,03 99,03
0,561 799,9 302,63 299,96 100,89
0,559 798,2 301,54 299,33 100,74
0,555 802,2 299,35 300,83 99,51
0,554 811,3 298,81 304,24 98,22
0,553 799,1 298,26 299,66 99,53
0,566 817,6 305,35 306,60 99,59
Rata-rata 99,91
SD 0,88
KV 0,89
Hasil Uji Keseragaman Kandungan Tablet Formula C Replikasi II
Abs W sampel (mg) C sampel (µg/ml) C teoritis (µg/ml) Kadar (%)
0,566 809,5 305,35 303,56 100,59
0,572 817,6 308,63 306,60 100,66
0,551 800,2 297,17 300,08 99,03
0,552 809,3 297,72 303,49 98,10
0,559 798,3 301,54 299,36 100,73
0,566 812,2 305,35 304,58 100,26
0,564 811,1 304,26 304,16 100,03
0,560 809 302,08 303,38 99,57
0,554 798,2 298,81 299,33 99,83
0,570 820,1 307,53 307,54 100,00
Rata-rata 99,88
SD 0,82
76
Hasil Uji Keseragaman Kandungan Tablet Formula C Replikasi III
Abs W sampel (mg) C sampel (µg/ml) C teoritis (µg/ml) Kadar (%)
0,552 799,2 297,72 299,70 99,34
0,556 793 299,90 297,38 100,85
0,552 789,9 297,72 296,21 100,51
0,559 803,1 301,54 301,16 100,12
0,569 816,7 306,99 306,26 100,24
0,571 813,5 308,08 305,06 100,99
0,559 809,1 301,54 303,41 99,38
0,551 799,4 297,17 299,78 99,13
0,566 811,2 305,35 304,20 100,38
0,552 805,2 297,72 301,95 98,60
Rata-rata 99,95
SD 0,80
KV 0,80
Hasil Uji Keseragaman Kandungan Tablet Formula D ReplikasiI
Abs W sampel (mg) C sampel (µg/ml) C teoritis (µg/ml) Kadar (%)
0,549 801,2 296,08 300,45 98,55
0,551 804,1 297,17 301,54 98,55
0,551 800,8 297,17 300,30 98,96
0,562 810 303,17 303,75 99,81
0,568 809,6 306,44 303,60 100,94
0,548 799,7 295,54 299,89 98,55
0,567 810,3 305,90 303,86 100,67
0,550 798,9 296,63 299,59 99,01
0,552 796,2 297,72 298,58 99,71
0,556 802,9 299,90 301,09 99,61
Rata-rata 99,44
SD 0,87
77
Hasil Uji Keseragaman Kandungan Tablet Formula D Replikasi II
Abs W sampel (mg) C sampel (µg/ml) C teoritis (µg/ml) Kadar (%)
0,552 798,6 297,72 299,48 99,41
0,556 789,9 299,90 296,21 101,24
0,550 799,3 296,63 299,74 98,96
0,561 803,6 302,63 301,35 100,42
0,559 800,9 301,54 300,34 100,40
0,558 807,6 300,99 302,85 99,39
0,560 800,4 302,08 300,15 100,64
0,562 815,2 303,17 305,70 99,17
0,559 812,7 301,54 304,76 98,94
0,563 809,2 303,72 303,45 100,09
Rata-rata 99,87
SD 0,80
KV 0,80
Hasil Uji Keseragaman Kandungan Tablet Formula D Replikasi III
Abs W sampel (mg) C sampel (µg/ml) C teoritis (µg/ml) Kadar (%)
0,552 811,2 297,72 304,20 97,87
0,556 803,1 299,90 301,16 99,58
0,550 815,2 296,63 305,70 97,03
0,561 800,3 302,63 300,11 100,84
0,559 806,2 301,54 302,33 99,74
0,558 798,7 300,99 299,51 100,49
0,560 799,2 302,08 299,70 100,79
0,562 789,6 303,17 296,10 102,39
0,559 801,3 301,54 300,49 100,35
0,563 809,3 303,72 303,49 100,08
Rata-rata 99,92
SD 1,52
78
LAMPIRAN C
HASIL IBUPROFEN TERLARUT DALAM TWEEN 80 DAN AIR SELAMA 24 JAM
Dalam Tween 80 W sampel
(gram) Abs.
Cs (μg/ml)
Cs x FP (μg/ml)
Rata-rata (mg/ml)
10,4973 0,452 243,18 243179,63
11,0759 0,444 238,82 238816,55 247,00
11,5237 0,481 259,00 258995,77
Dalam air W sampel
(gram) Abs.
C s (μg/ml)
Cs x FP (μg/ml)
Rata-rata (mg/ml)
9,8812 0,072 35,93 179,67
9,2858 0,063 31,03 155,13 0,17
79
LAMPIRAN D
HASIL PENETAPAN KADAR TABLET LIKUISOLID IBUPROFEN
FORMULA A
Replikasi Massa (mg) Abs
C sampel (ppm) C teoritis (ppm) % Kadar
Rata-rata SD KV
1 800,3 0,553 298,26 300,11 99,38
2 799,9 0,559 301,54 299,96 100,52 100,30 0,82 0,82
3 800,6 0,562 303,17 300,23 100,98
FORMULA B
Replikasi Massa (mg) Abs
C sampel (ppm) C teoritis (ppm) % Kadar
Rata-rata SD KV
1 799,7 0,558 300,99 299,89 100,37
2 799,9 0,553 298,26 299,96 99,43 99,87 0,47 0,47
3 799,8 0,555 299,35 299,93 99,81
FORMULA C
Replikasi Massa (mg) Abs
C sampel (ppm) C teoritis (ppm) % Kadar
Rata-rata SD KV
1 799,6 0,551 297,17 299,85 99,11
2 800,3 0,559 301,54 300,11 10,.47 99,81 0,68 0,69
80
FORMULA D
Replikasi Massa
(mg) Abs
C sampel
(ppm) C teoritis
(ppm) % Kadar
Rata-rata SD KV
1 800,5 0,558 300,99 300,19 100,27
2 799,7 0,55 296,63 299,89 98,91 99,61 0,68 0,68
81
LAMPIRAN E
HASIL UJI DISOLUSI TABLET LIKUISOLID IBUPROFEN
FORMULA A Replikasi t
(menit) A
C (µg/ml)
Wt (mg)
%obat terlepas
AUC (µg menit / ml)
I
10 0,224 118,83 106,9 53,31 534,74
20 0,249 132,47 119,2 59,43 1130,84
30 0,275 146,65 132,0 65,79 1256,01
45 0,33 176,64 159,0 79,25 2182,20
60 0,347 185,91 167,3 83,41 2447,26
7551,06
II
10 0,225 119,38 107,4 53,56 537,20
20 0,251 133,56 120,2 59,92 1138,21
30 0,278 148,28 133,5 66,53 1268,28
45 0,329 176,10 158,5 79,01 2189,57
60 0,349 187,01 168,3 83,90 2450,94
7584,19
III
10 0,223 118,29 106,5 53,07 532,29
20 0,247 131,38 118,2 58,94 1123,48
30 0,279 148,83 133,9 66,77 1260,92
45 0,325 173,92 156,5 78,03 2178,52
60 0,343 183,73 165,4 82,43 2414,13
82
FORMULA B
Replikasi t
(menit) A C (µg/ml) Wt (mg)
%obat terlepas
AUC (µg menit / ml)
I
10 0,281 149,92 134,9 67,55 674,6
20 0,32 171,19 154,1 77,14 1445,0
30 0,346 185,37 166,8 83,52 1604,5
45 0,361 193,55 174,2 87,21 2557,7
60 0,377 202,28 182,0 91,14 2671,8
8953,7
II
10 0,282 150,46 135,4 67,80 677,1
20 0,319 170,64 153,6 76,89 1445,0
30 0,341 182,64 164,4 82,30 1589,8
45 0,364 195,19 175,7 87,95 2550,3
60 0,378 202,82 182,5 91,39 2686,5
8948,7
III
10 0,285 152,10 136,9 68,53 684,5
20 0,322 172,28 155,1 77,63 1459,7
30 0,349 187,01 168,3 84,26 1616,8
45 0,363 194,64 175,2 87,70 2576,1
60 0,374 200,64 180,6 90,41 2668,1
9005,2
83
FORMULA C
Replikasi t
(menit) A
C (µg/ml)
Wt (mg)
%obat terlepas
AUC (µg menit / ml)
I
10 0,288 153,74 138,4 68,97 1481,8
20 0,328 175,55 158,0 78,76 1656,0
30 0,359 192,46 173,2 86,35 1781,2
45 0,379 203,37 183,0 91,24 2774,9
60 0,387 207,73 187,0 93,20 1402,2
9096,1
II
10 0,286 152,65 137,4 68,49 1481,8
20 0,33 176,64 159,0 79,25 1658,5
30 0,358 191,91 172,7 86,10 1776,3
45 0,378 202,82 182,5 91,00 2763,9
60 0,385 206,64 186,0 92,71 1394,8
9075,3
III
10 0,285 152,10 136,9 68,24 1476,9
20 0,329 176,10 158,5 79,01 1638,9
30 0,351 188,10 169,3 84,39 1764,0
45 0,38 203,91 183,5 91,49 2774,9
60 0,386 207,18 186,5 92,95 1398,5
84
FORMULA D Replikasi t
(menit) A
C (µg/ml)
Wt (mg)
%obat terlepas
AUC (µg menit / ml)
I
10 0,293 156,46 140,8 70,20 1521,1
20 0,339 181,55 163,4 81,45 1695,3
30 0,364 195,19 175,7 87,57 1815,6
45 0,388 208,28 187,4 93,44 2826,4
60 0,392 210,46 189,4 94,42 1420,6
9279,0
II
10 0,295 157,55 141,8 70,69 1528,4
20 0,34 182,10 163,9 81,70 1707,6
30 0,368 197,37 177,6 88,55 1822,9
45 0,387 207,73 187,0 93,20 2819,1
60 0,391 209,91 188,9 94,18 1416,9
9294,9
III
10 0,297 158,65 142,8 71,18 1528,4
20 0,338 181,01 162,9 81,21 1697,8
30 0,366 196,28 176,6 88,06 1822,9
45 0,389 208,82 187,9 93,69 2837,5
60 0,394 211,55 190,4 94,91 1427,9
85
LAMPIRAN F CONTOH PERHITUNGAN
Contoh perhitungan indeks kompresibilitas dan Hausner ratio:
Formula A :
Berat gelas = 111,29 g (W1) Berat gelas + granul = 148,3 g (W2) V1 = 100 ml
V2 = 84 ml
Bj nyata = 1 1 2 ) ( V W W = = 0,3701
Bj mampat =
2 1 2 ) ( V W W = = 0,4460
% kompresibilitas = 100%
. . 1 x mampat Bj nyata Bj
= 16%
Formula A: HR =
= 1,19
Contoh perhitungan akurasi & presisi:
Absorbansi = 0,558 → y = 0,0018x + 0,0061 Konsentrasi sebenarnya = 300,99 ppm Konsentrasi teoritis = 300,45 ppm
% perolehan kembali = (kons. sebenarnya / kons. teoritis) x 100% % Bahan aktif (mg) Matriks (mg) Dapar fosfat 0,2M pH7,2 Ad Pipet Dapar fosfat 0,2M pH7,2 Ad Konsentrasi (ppm)
100 200 600 100 1,5 10 300
86
= (300,99/ 300,45) x 100%
= 100,18%
Untuk menghitung % KV = x100%
X
SD
=
= 1,01 %
Contoh perhitungan % obat terlepas:
% obat terlepas = 100%
100
dosis PK
Wt
Formula A replikasi 1 pada t = 10 menit % obat terlepas =
% 31 , 53 % 100 200 100 100,30
106,9
Contoh perhitungan AUC pada disolusi:
Rumus:
Formula A replikasi 1 Wtn-1 = 106,9 Wtn = 119,2 tn = 20 menit tn-1 = 10 menit
AUC = (20 10)
2 2 , 119 9 ,
1006
x
= 534,74
Luas □ = 60 x penetapan kadar x dosis = 60 x 100,30% x 200 mg = 12035,6
87
= (7551,06/12035,6) x 100% = 62,74 %
LAMPIRAN G
HASIL UJI F KURVA BAKU
REPLIKASI I
KONSENTRASI ABSORBANSI X2 Y2 XY
75,45 0,129 5692,703 0,0166 9,7330
100,6 0,178 10120,36 0,0317 17,9068
201,2 0,359 40481,44 0,1289 72,2308
301,8 0,563 91083,24 0,3170 169,9134
402,4 0,728 161925,8 0,5300 292,9472
503 0,928 253009 0,8612 466,784
REPLIKASI II
KONSENTRASI ABSORBANSI X2 Y2 XY
75,38 0,144 5682,144 0,0207 10,8547
100,5 0,184 10100,25 0,0338 18,492
201 0,378 40401 0,1429 75,978
301,5 0,568 90902,25 0,3226 171,252
402 0,742 161604 0,5506 298,284
88 REPLIKASI III
KONSENTRASI ABSORBANSI X2 Y2 XY
75,3 0,169 5670,09 0,0286 12,7257
100,4 0,211 10080,16 0,0445 21,1844
200,8 0,386 40320,64 0,1490 77,5088
301,2 0,571 90721,44 0,3260 171,9852
401,6 0,747 161282,6 0,5580 299,9952
502 0,91 252004 0,8281 456,82
ƩX2 ƩXY ƩY2
N Residual
SS RDF
Replikasi I 562312,5 1029,5153 1,8853 6 4,45.10-4 3 Replikasi II 561195,9 1038,6682 1,9226 6 2,13. 10-4 3 Replikasi III 560078,9 1040,2193 1,9342 6 2,266. 10-3 3
Pooled
regression 2,91. 10
-3 9 Common
regression 1683587 3108,4028 5,7422 3,13.10
-3
11
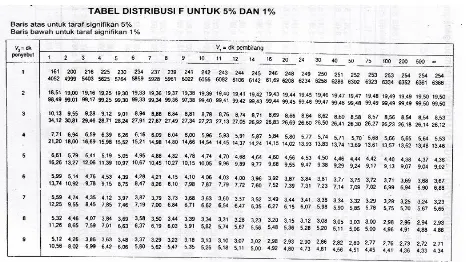
F hitung < F tabel 0,05 (3,9) = 0,3287 < 3,86
89
LAMPIRAN H
HASIL UJI STATISTIK KEKERASAN TABLET LIKUISOLID IBUPROFEN ANTAR FORMULA
Descriptives Kekerasan
N Mean Std. Deviation
Std. Error
95% Confidence Interval for Mean
Minimum Maximum Lower
Bound
Upper Bound
Formula A 3 7.2900 1.45523 .84018 3.6750 10.9050 5.61 8.16
Formula B 3 5.0933 .78501 .45322 3.1433 7.0434 4.31 5.88
Formula C 3 5.6167 .60707 .35049 4.1086 7.1247 5.07 6.27
Formula D 3 4.8033 .19732 .11392 4.3132 5.2935 4.67 5.03
Total 12 5.7008 1.25785 .36311 4.9016 6.5000 4.31 8.16 Test of Homogeneity of Variances
Kekerasan
Levene Statistic df1 df2 Sig.
3.766 3 8 .059
ANOVA
Kekerasan
Sum of Squares Df Mean Square F Sig.
Between Groups 11.121 3 3.707 4.720 .035 Within
Groups
6.283 8 .785
Total 17.404 11
90
Multiple Comparisons kekerasan
LSD
(I) Formula (J) Formula
Mean Difference (I-J)
Std. Error Sig.
95% Confidence Interval
Lower Bound Upper Bound
Formula A Formula B 2.19667* .72358 .016 .5281 3.8652
Formula C 1.67333* .72358 .049 .0048 3.3419
91
LAMPIRAN I
HASIL UJI STATISTIK KERAPUHAN TABLET LIKUISOLID IBUPROFEN ANTAR FORMULA
Descriptives Kerapuhan
N Mean Std. Deviation
Std. Error
95% Confidence Interval for Mean
Minimum Maximum Lower
Bound
Upper Bound
Formula A 3 .4400 .07000 .04041 .2661 .6139 .37 .51 Formula B 3 .4533 .11930 .06888 .1570 .7497 .32 .55 Formula C 3 .2733 .07234 .04177 .0936 .4530 .19 .32 Formula D 3 .3433 .09713 .05608 .1021 .5846 .26 .45 Total 12 .3775 .10980 .03170 .3077 .4473 .19 .55
Test of Homogeneity of Variances Kerapuhan
Levene Statistic df1 df2 Sig.
.638 3 8 .611
ANOVA Kerapuhan
Sum of Squares df Mean Square F Sig.
Between Groups .065 3 .022 2.565 .128 Within Groups .068 8 .008
Total .133 11
92
LAMPIRAN J
HASIL UJI STATISTIK WAKTU HANCUR TABLET LIKUISOLID IBUPROFEN ANTAR FORMULA
Descriptives waktu_hancur
N Mean Std. Deviation
Std. Error
95% Confidence Interval for Mean
Minimum Maximum Lower
Bound Upper Bound
Formula A 3 1.4800 .25515 .14731 .8462 2.1138 1.29 1.77 Formula B 3 1.0167 .05508 .03180 .8799 1.1535 .98 1.08 Formula C 3 1.0300 .01732 .01000 .9870 1.0730 1.02 1.05 Formula D 3 1.3333 .21733 .12548 .7934 1.8732 1.17 1.58 Total 12 1.2150 .25311 .07307 1.0542 1.3758 .98 1.77
Test of Homogeneity of Variances waktu_hancur
Levene Statistic df1 df2 Sig.
5.882 3 8 .020
ANOVA waktu_hancur
Sum of Squares Df Mean Square F Sig.
Between Groups .473 3 .158 5.457 .025 Within Groups .231 8 .029
Total .705 11
93
Multiple Comparisons waktu_hancur
LSD
(I) Formula (J) Formula
Mean Difference
(I-J) Std. Error Sig.
95% Confidence Interval
Lower Bound
Upper Bound
Formula A Formula B .46333* .13884 .010 .1432 .7835
Formula C .45000* .13884 .012 .1298 .7702
94
LAMPIRAN K
HASIL UJI STATISTIK PENETAPAN KADAR TABLET LIKUISOLID IBUPROFEN ANTAR FORMULA
Descriptives Penetapan_kadar
N Mean Std. Deviation
Std. Error
95% Confidence Interval for Mean
Minimum Maximum Lower
Bound
Upper Bound
Formula A 3 100.2933 .82373 .47558 98.2471 102.3396 99.38 100.98 Formula B 3 99.8700 .47286 .27301 98.6953 101.0447 99.43 100.37 Formula C 3 99.8133 .68120 .39329 98.1211 101.5055 99.11 100.47 Formula D 3 99.6067 .68061 .39295 97.9159 101.2974 98.91 100.27 Total 12 99.8958 .63289 .18270 99.4937 100.2980 98.91 100.98
Test of Homogeneity of Variances Penetapan_kadar
Levene Statistic df1 df2 Sig.
.335 3 8 .800
ANOVA Penetapan_kadar
Sum of Squares df Mean Square F Sig.
Between Groups .747 3 .249 .545 .665 Within Groups 3.659 8 .457
Total 4.406 11
95
LAMPIRAN L
HASIL UJI STATISTIK DISOLUSI BERDASARKAN %ED60 TABLET LIKUISOLID IBUPROFEN ANTAR FORMULA
Descriptives Persen_Efisiensi_Disolusi
N Mean Std.
Deviation Std. Error
95% Confidence Interval for Mean
Minimum Maximum Lower
Bound
Upper Bound
Formula A 3 62.7133 .31086 .17947 61.9411 63.4855 62.39 63.01 Formula B 3 74.8400 .26058 .15044 74.1927 75.4873 74.67 75.14 Formula C 3 75.7633 .18009 .10398 75.3160 76.2107 75.58 75.94 Formula D 3 77.7733 .15044 .08686 77.3996 78.1471 77.63 77.93 Total 12 72.7725 6.16945 1.78097 68.8526 76.6924 62.39 77.93
Test of Homogeneity of Variances Persen_Efisiensi_Disolusi
Levene Statistic df1 df2 Sig.
.720 3 8 .568
ANOVA Persen_Efisiensi_Disolusi
Sum of Squares df Mean Square F Sig.
Between Groups 418.244 3 139.415 2539.432 .000 Within Groups .439 8 .055
Total 418.684 11
96
Multiple Comparisons Persen_Efisiensi_Disolusi
LSD
(I) Formula (J) Formula
Mean Difference (I-J)
Std. Error Sig.
95% Confidence Interval
Lower
Bound Upper Bound
Formula A Formula B -12.12667* .19131 .000 -12.5678 -11.6855
Formula C -13.05000* .19131 .000 -13.4912 -12.6088
97
LAMPIRAN M
HASIL UJI STATISTIK KONSTANTA LAJU DISOLUSI TABLET LIKUISOLID IBUPROFEN ANTAR FORMULA
Descriptives Konstanta_Laju_Disolusi
N Mean Std.
Deviation Std. Error
95% Confidence Interval for Mean
Minimum Maximum Lower
Bound
Upper Bound
Formula A 3 .054367 .0021595 .0012468 .049002 .059731 .0521 .0564 Formula B 3 .293067 .3913864 .2259670 -.679191 1.265324 .0664 .7450 Formula C 3 .083867 .0020841 .0012032 .078690 .089044 .0816 .0857 Formula D 3 .089133 .0035796 .0020667 .080241 .098025 .0850 .0912 Total 12 .130108 .1941739 .0560532 .006736 .253481 .0521 .7450
Test of Homogeneity of Variances Konstanta_Laju_Disolusi
Levene Statistic df1 df2 Sig.
15.793 3 8 .001
ANOVA Konstanta_Laju_Disolusi
Sum of Squares Df Mean Square F Sig.
Between Groups .108 3 .036 .943 .464 Within Groups .306 8 .038
Total .415 11
98
LAMPIRAN N
100
LAMPIRAN O
101
LAMPIRAN P
102
LAMPIRAN Q
LAMPIRAN R TABEL UJI F
105