LAMPIRAN A
HASIL UJI MUTU FISIK MASSA TABLET
Mutu fisik yang diuji
Replikasi
LAMPIRAN B
HASIL UJI KEKERASAN TABLET LIKUISOLID IBUPROFEN
REPLIKASI I
No Kekerasan Tablet Likuisolid Ibuprofen (Kp)
Formula A Formula B Formula C Formula D
No Kekerasan Tablet Likuisolid Ibuprofen (Kp)
REPLIKASI III
No Kekerasan Tablet Likuisolid Ibuprofen (Kp)
Formula A Formula B Formula C Formula D
1 13,4 13,2 12,8 13,4
2 13 13,4 12,6 14,2
3 13,4 13 13 14,4
4 13 12,8 12,9 13,6
5 13,4 13,6 12,5 14,4
6 13,2 12,8 12,6 14,2
7 13,4 13,5 13,1 13,6
8 13,2 14 12,6 14,7
9 12,9 13,2 12,6 13,9
10 13 13 12,4 14,1
Rata-rata 13,19 13,25 12,71 14,05
SD 0,20 0,38 0,23 0,42
LAMPIRAN C
HASIL UJI KERAPUHAN TABLET LIKUISOLID IBUPROFEN
Repli-LAMPIRAN D
HASIL UJI WAKTU HANCUR TABLET LIKUISOLID IBUPROFEN
Replikasi
Waktu Hancur (menit) Formula
A
Formula B
Formula C
Formula D
I 0,32 2,07 3,8 14,8
II 0,2 2,33 5,63 14,23
III 0,18 1,75 3,97 14,53
Rata-rata 0,23 2,05 4,47 14,52
SD 0,08 0,29 1,01 0,29
LAMPIRAN E
HASIL UJI KERAGAMAN BOBOT TABLET LIKUISOLID
IBUPROFEN
LAMPIRAN F
HASIL UJI KESERAGAMAN KANDUNGAN TABLET
LIKUISOLID IBUPROFEN
Formula A Replikasi I
Abs W sampel C sampel C teoritis Kadar (%) Rata-rata 101,07
SD 0,95
KV 0,94
Formula A Replikasi II
Abs W sampel C sampel C teoritis Kadar (%) Rata-rata 98,83
SD 1,17
Formula A Replikasi III Rata-rata 99,82
SD 1,42
KV 1,42
Formula B Replikasi I
Abs W sampel C sampel C teoritis Kadar (%) Rata-rata 100,70
SD 0,77
Formula B Replikasi II Rata-rata 102,07
SD 0,99
KV 0,97
Formula B Replikasi III
Abs W sampel C sampel C teoritis Kadar (%)
Rata-rata 100,16
SD 1,14
Formula C Replikasi I Rata-rata 98,37
SD 0,81
KV 0,82
Formula C Replikasi II
Abs W sampel C sampel C teoritis Kadar (%) Rata-rata 99,34
SD 1,18
Formula C Replikasi III Rata-rata 100,15
SD 1,90
KV 1,90
Formula D Replikasi I
Abs W sampel C sampel C teoritis Kadar (%)
Rata-rata 98,66
SD 2,21
Formula D Replikasi II Rata-rata 98,48
SD 2,17
KV 2,21
Formula D Replikasi III
Abs W sampel C sampel C teoritis Kadar (%)
Rata-rata 99,72
SD 1,32
LAMPIRAN G
HASIL PENETAPAN KADAR TABLET LIKUISOLID IBUPROFEN
Repli-LAMPIRAN H
HASIL UJI DISOLUSI TABLET LIKUISOLID IBUPROFEN FORMULA A
Replikasi t (menit) Absorbansi Csampel
(µg/ml) Wt (mg)
% obat
terlarut AUC (mg.menit)
HASIL UJI DISOLUSI TABLET LIKUISOLID IBUPROFEN FORMULA B
Replikasi t (menit) Absorbansi Csampel
(µg/ml) Wt (mg)
% obat
terlarut AUC (mg.menit)
HASIL UJI DISOLUSI TABLET LIKUISOLID IBUPROFEN FORMULA C
Replikasi t (menit) Absorbansi Csampel
(µg/ml) Wt (mg)
% obat
terlarut AUC (mg.menit)
HASIL UJI DISOLUSI TABLET LIKUISOLID IBUPROFEN FORMULA D
Replikasi t (menit) Absorbansi Csampel
(µg/ml) Wt (mg)
% obat
terlarut AUC (mg.menit)
LAMPIRAN I
CONTOH PERHITUNGAN
Contoh perhitungan sudut diam:
Formula A:
W persegi panjang = 2,38 gram W lingkaran = 0,87 gram Luas persegi panjang = 466,1375 cm2 Luas lingkaran = 466,1375
Contoh perhitungan indeks kompresibilitas:
Formula A :
Berat gelas = 112,38 g (W1)
Berat gelas + granul = 149,4 g (W2)
V1 = 100 ml
Bj nyata =
Contoh perhitungan Hausner Ratio :
Formula A :
HR = Bj mampatBj nyata = 1,20
Contoh perhitungan akurasi & presisi:
% Konsentrasi sebenarnya = 302 µg/ml Konsentrasi teoritis = 301,8 µg/ml
Contoh perhitungan % obat terlepas:
Contoh perhitungan AUC pada disolusi:
Rumus: ( )
Formula A replikasi 1 Wtn-1 = 133,30
Luas □ = 60 x penetapan kadar x dosis
= 60 x 100,71% x 200 mg = 12085,2
LAMPIRAN J
HASIL UJI F KURVA BAKU
REPLIKASI I
KONSENTRASI ABSORBANSI X2 Y2 XY
100,8 0,211 10160,64 0,044521 21,2688 201,6 0,387 40642,56 0,149769 78,0192 302,4 0,558 91445,76 0,311364 168,7392 403,2 0,742 162570,24 0,550564 299,1744 504 0,906 254016 0,820836 456,624
REPLIKASI II
KONSENTRASI ABSORBANSI X2 Y2 XY
100,4 0,21 10080,16 0,0441 21,084 200,8 0,385 40320,64 0,148225 77,308 301,2 0,572 90721,44 0,327184 172,2864 401,6 0,747 161282,56 0,558009 299,9952 502 0,908 252004 0,824464 455,816
REPLIKASI III
KONSENTRASI ABSORBANSI X2 Y2 XY
100,5 0,183 10100,25 0,033489 18,3915
210 0,379 44100 0,143641 79,59
X2 XY Y2 N Residual
SS RDF
Replikasi 1 558835,2 1023,8256 1,877054 5 0,0013331 3 Replikasi 2 554408,8 1026,4896 1,901982 5 0,0014333 3 Replikasi 3 559212,75 1028,511 1,891744 5 9,39E-05 3
Pooled
regression 0,0028603 9
Common
regression 1672456,75 3078,8262 5,67078 0,0029678 11
F hitung = 0,1691 < F tabel0,05(2,9) = 4,26
LAMPIRAN K
HASIL UJI STATISTIK KEKERASAN TABLET LIKUISOLID IBUPROFEN ANTAR FORMULA
Oneway
Descriptives
Kekerasan
N Mean Std. Deviation Std. Error
95% Confidence Interval for Mean
Minimum Maximum Lower Bound Upper Bound
1.00 3 13.2500 .44306 .25580 12.1494 14.3506 12.84 13.72 2.00 3 13.4667 .20207 .11667 12.9647 13.9686 13.25 13.65 3.00 3 13.1567 .60871 .35144 11.6445 14.6688 12.71 13.85 4.00 3 14.1267 .23459 .13544 13.5439 14.7094 13.94 14.39 Total 12 13.5000 .52639 .15196 13.1655 13.8345 12.71 14.39
Test of Homogeneity of Variances
Kekerasan
Levene Statistic df1 df2 Sig.
2.161 3 8 .171
ANOVA
Kekerasan
Sum of Squares df Mean Square F Sig.
Between Groups 1.723 3 .574 3.466 .071
Within Groups 1.325 8 .166
Total 3.048 11
Karena F hitung = 3,466 < F tabel0,05(3,8) = 4,07; maka H0 diterima dan tidak ada perbedaan yang bermakna antar
formula.
LAMPIRAN L
HASIL UJI STATISTIK KERAPUHAN TABLET LIKUISOLID IBUPROFEN
ANTAR FORMULA
Oneway
Descriptives
Kerapuhan
N Mean Std. Deviation Std. Error
95% Confidence Interval for Mean
Minimum Maximum Lower Bound Upper Bound
1.00 3 .1067 .04041 .02333 .0063 .2071 .06 .13
2.00 3 .1433 .07234 .04177 -.0364 .3230 .06 .19
3.00 3 .1667 .03215 .01856 .0868 .2465 .13 .19
4.00 3 .1067 .04041 .02333 .0063 .2071 .06 .13
Total 12 .1308 .04944 .01427 .0994 .1622 .06 .19
Test of Homogeneity of Variances
Kerapuhan
Levene Statistic df1 df2 Sig.
2.040 3 8 .187
ANOVA
Kerapuhan
Sum of Squares df Mean Square F Sig.
Between Groups .008 3 .003 1.094 .406
Within Groups .019 8 .002
Total .027 11
Karena F hitung = 1,094 < F tabel0,05(3,8) = 4,07; maka H0 diterima dan tidak ada perbedaan yang bermakna antar
formula.
LAMPIRAN M
HASIL UJI STATISTIK WAKTU HANCUR TABLET LIKUISOLID IBUPROFEN
ANTAR FORMULA
Oneway
Descriptives
WaktuHancur
N Mean
Std.
Deviation Std. Error
95% Confidence Interval for Mean
Minimum Maximum Lower Bound Upper Bound
1.00 3 .2333 .07572 .04372 .0452 .4214 .18 .32
2.00 3 2.0500 .29052 .16773 1.3283 2.7717 1.75 2.33 3.00 3 4.4667 1.01106 .58373 1.9551 6.9783 3.80 5.63 4.00 3 14.5200 .28513 .16462 13.8117 15.2283 14.23 14.80 Total 12 5.3175 5.78551 1.67013 1.6416 8.9934 .18 14.80
Test of Homogeneity of Variances
WaktuHancur
Levene Statistic df1 df2 Sig.
7.185 3 8 .012
ANOVA
WaktuHancur
Sum of Squares df Mean Square F Sig. Between Groups 365.806 3 121.935 408.607 .000
Within Groups 2.387 8 .298
Total 368.193 11
Karena F hitung = 408,607 > F tabel0,05(3,8) = 4,07; maka H0 ditolak dan ada perbedaan yang bermakna antar formula.
Post Hoc Tests
95% Confidence Interval Lower Bound Upper Bound
1.00 *. The mean difference is significant at the 0.05 level.
LAMPIRAN N
HASIL UJI STATISTIK PENETAPAN KADAR TABLET LIKUISOLID IBUPROFEN
ANTAR FORMULA
Oneway
Descriptives
PK
N Mean
Std.
Deviation Std. Error
95% Confidence Interval for Mean
Minimum Maximum Lower Bound Upper Bound
1.00 3 100.7100 .79699 .46014 98.7302 102.6898 100.23 101.63 2.00 3 101.8633 .75659 .43682 99.9839 103.7428 101.08 102.59 3.00 3 100.7100 .45902 .26502 99.5697 101.8503 100.22 101.13 4.00 3 100.5300 .60100 .34699 99.0370 102.0230 99.85 100.99 Total 12 100.9533 .79408 .22923 100.4488 101.4579 99.85 102.59
Test of Homogeneity of Variances
PK
Levene Statistic df1 df2 Sig.
.518 3 8 .681
ANOVA
PK
Sum of Squares df Mean Square F Sig.
Between Groups 3.377 3 1.126 2.530 .131
Within Groups 3.559 8 .445
Total 6.936 11
Karena F hitung = 2,530 < F tabel0,05(3,8) = 4,07; maka H0 diterima dan tidak ada perbedaan yang bermakna antar
formula.
LAMPIRAN O
HASIL UJI STATISTIK DISOLUSI BERDASARKAN %ED60 TABLET LIKUISOLID IBUPROFEN
ANTAR FORMULA
Oneway
Descriptives
ED
N Mean
Std.
Deviation Std. Error
95% Confidence Interval for Mean
Minimum Maximum Lower Bound Upper Bound
1.00 3 73.2033 .24214 .13980 72.6018 73.8049 73.03 73.48 2.00 3 77.3133 .49642 .28661 76.0802 78.5465 76.84 77.83 3.00 3 85.6567 .26690 .15409 84.9937 86.3197 85.41 85.94 4.00 3 67.8933 .55048 .31782 66.5259 69.2608 67.33 68.43 Total 12 76.0167 6.78837 1.95963 71.7035 80.3298 67.33 85.94
Test of Homogeneity of Variances
ED
Levene Statistic df1 df2 Sig.
.659 3 8 .600
ANOVA
ED
Sum of Squares df Mean Square F Sig. Between Groups 505.543 3 168.514 992.234 .000
Within Groups 1.359 8 .170
Total 506.902 11
Karena F hitung = 992,234 > F tabel0,05(3,8) = 4,07 ; maka H0 ditolak dan ada perbedaan yang bermakna antar formula.
Post Hoc Tests
Multiple Comparisons
ED
Tukey HSD (I) Formula (J)
Formula
Mean Difference
(I-J) Std. Error Sig.
95% Confidence Interval Lower Bound Upper Bound 1.00 2.00 -4.11000* .33649 .000 -5.1875 -3.0325
3.00 -12.45333* .33649 .000 -13.5309 -11.3758 4.00 5.31000* .33649 .000 4.2325 6.3875 2.00 1.00 4.11000* .33649 .000 3.0325 5.1875 3.00 -8.34333* .33649 .000 -9.4209 -7.2658 4.00 9.42000* .33649 .000 8.3425 10.4975 3.00 1.00 12.45333* .33649 .000 11.3758 13.5309 2.00 8.34333* .33649 .000 7.2658 9.4209 4.00 17.76333* .33649 .000 16.6858 18.8409 4.00 1.00 -5.31000* .33649 .000 -6.3875 -4.2325 2.00 -9.42000* .33649 .000 -10.4975 -8.3425 3.00 -17.76333* .33649 .000 -18.8409 -16.6858 *. The mean difference is significant at the 0.05 level.
LAMPIRAN P
HASIL UJI STATISTIK KONSTANTA LAJU DISOLUSI TABLET LIKUISOLID IBUPROFEN
ANTAR FORMULA
Oneway
Descriptives
LajuDisolusi
N Mean Std. Deviation Std. Error
95% Confidence Interval for Mean
Minimum Maximum Lower Bound Upper Bound
1.00 3 .019167 .0006110 .0003528 .017649 .020684 .0185 .0197 2.00 3 .025267 .0004163 .0002404 .024232 .026301 .0248 .0256 3.00 3 .032700 .0017349 .0010017 .028390 .037010 .0307 .0338 4.00 3 .021500 .0001732 .0001000 .021070 .021930 .0213 .0216 Total 12 .024658 .0054162 .0015635 .021217 .028100 .0185 .0338
Test of Homogeneity of Variances
LajuDisolusi
Levene Statistic df1 df2 Sig.
7.572 3 8 .010
ANOVA
LajuDisolusi
Sum of Squares df Mean Square F Sig.
Between Groups .000 3 .000 117.292 .000
Within Groups .000 8 .000
Total .000 11
Karena F hitung = 117,292 > F tabel0,05(3,8) = 4,07 ; maka H0 ditolak dan ada perbedaan yang bermakna antar formula.
Post Hoc Tests
Multiple Comparisons
LajuDisolusi Tukey HSD
(I) Formula (J)
Formula Mean Difference (I-J) Std. Error Sig.
95% Confidence Interval Lower Bound Upper Bound 1.00 2.00 -.0061000* .0007732 .000 -.008576 -.003624
3.00 -.0135333* .0007732 .000 -.016009 -.011057 4.00 -.0023333 .0007732 .065 -.004809 .000143 2.00 1.00 .0061000* .0007732 .000 .003624 .008576 3.00 -.0074333* .0007732 .000 -.009909 -.004957 4.00 .0037667* .0007732 .005 .001291 .006243 3.00 1.00 .0135333* .0007732 .000 .011057 .016009 2.00 .0074333* .0007732 .000 .004957 .009909 4.00 .0112000* .0007732 .000 .008724 .013676 4.00 1.00 .0023333 .0007732 .065 -.000143 .004809 2.00 -.0037667* .0007732 .005 -.006243 -.001291 3.00 -.0112000* .0007732 .000 -.013676 -.008724
LAMPIRAN Q
LAMPIRAN R
LAMPIRAN S
LAMPIRAN T
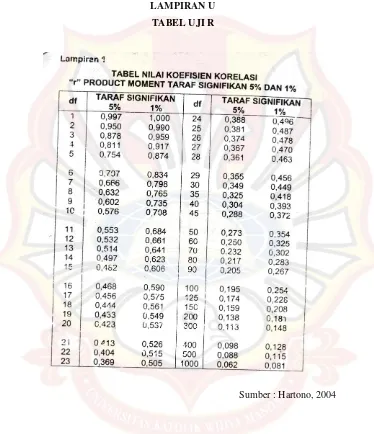
LAMPIRAN U
TABEL UJI R
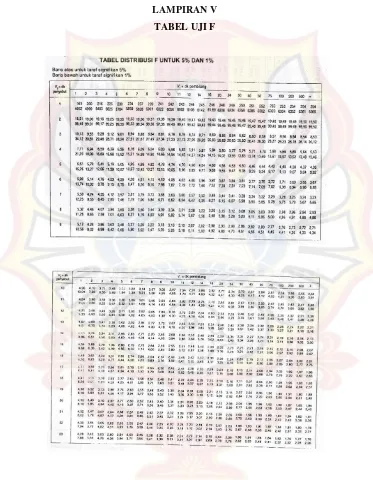
LAMPIRAN V