Universita s Kri sten Maranatha
i
SIMULASI DAN ANALISIS PENGARUH
HARD HANDOVER PADA MOBILE WIMAX TERHADAP
KAPASITAS TRAFIK DATA
Fransiskus Adrian Lesmana / 9822074
Jurusan Teknik Elektro, Fakultas Teknik, Universitas Kristen Maranatha, Jln. Prof. Drg. Surya Sumantri 65, Bandung 40164, Indonesia
Email : [email protected]
ABSTRAK
Mobile WiMAX merupakan perkembangan dari teknologi broadband
wireless access yang mampu mengatasi tingkat mobilitas dari pengguna, dengan
cara menangani masalah handover.
Dalam tugas akhir ini dilakukan simulasi dan analisis untuk mengetahui
pengaruh hard handover terhadap kapasitas trafik data pada jaringan Mobile
WiMAX dalam kondisi LOS dan NLOS dengan menggunakan software opnet
modeler versi 14. Parameter-parameter yang dianalisis meliputi : throughput,
jitter, packet loss, dan handover delay.
Dari hasil simulasi diperoleh bahwa jaringan WiMAX mampu melayani
berbagai aplikasi, seperti VOIP, VOD, dan Web Browsing dengan tingkat
kecepatan pergerakan yang berbeda dari user. Nilai jitter VOIP dan VOD pada
kondisi LOS dan NLOS masuk dalam kategori sangat bagus, yaitu 0 ms.
Sedangkan handover delay pada saat LOS dan NLOS memenuhi standard, yaitu
dibawah 150 ms.
Universita s Kri sten Maranatha
ii
Simulation and Analysis of Hard Handover Impact on Mobile
WiMAX to The Data Traffic Capacity
Fransiskus Adrian Lesmana / 9822074
Electrical Departement, Faculty of Engineering, Maranatha Christian University, Jln. Prof. Drg. Surya Sumantri 65, Bandung 40164, Indonesia
Email : [email protected]
ABSTRACT
Mobile WiMAX is a development of broadband wireless access
technologies which is able to support the mobility level of it’s user, especially in
handling Handover.
In this final project, a simulation and analysis has been done to understand
the impact of hard handover on the data traffic capacity where the mobile wimax
network is under LOS and NLOS conditions by using opnet modeler version 14.
The parameter of analysis are follow : throughput, jitter, packet loss, and
handover delay.
The simulation result shows that the wimax network is able to serve many
application such as VOIP, VOD, and Web Browsing with a different level vehicle
speed of the user. The VOIP and VOD jitter under LOS and NLOS conditions
could be categorized very fairly as 0 ms. The Handover delay under LOS and
NLOS conditions is according to the standard which is below 150 ms.
Universita s Kri sten Maranatha
v
DAFTAR ISI
ABSTRAK ... i
ABSTRACT... ii
KATA PENGANTAR………..iii
DAFTAR ISI………..v
DAFTAR TABEL………...ix
DAFTAR GAMBAR………xi
SINGKATAN...xii
BAB I PENDAHULUAN 1. Latar Belakang……… 1
2. Identifikasi Masalah……… 2
3. Tujuan………. 2
4. Pembatasan Masalah……….... 2
5. Metodologi………. 2
6. Sistematika Penulisan………... 3
BAB II LANDASAN TEORI 2.1. Latar Belakang Mobile WiMAX……… 4
2.2. Konsep Mobile WiMAX……… 6
2.2.1. OFDM……….. 6
2.2.2. OFDMA………... 7
2.3. Scalable OFDMA....………... 8
2.4. Arsitektur Jaringan Mobile WiMAX………... 9
Universita s Kri sten Maranatha
vi
2.6. Handover………... 12
2.6.1. Prosedur Hard Handover..………... 14
2.6.1.1. Proses Scanning....………... 15
2.6.1.2. Proses Negosiasi...………... 16
2.6.2. Tipe Inisialisasi Handover...……… 17
2.6.2.1. MS Initiated Handover ……….………. 17
2.6.2.1.1. Neighbour Advertisement.………... 18
2.6.2.1.2. Neighbour Scanning.……….... 18
2.6.2.1.3. Negotiating Handover dengan Serving BS………... 18
2.6.3. Parameter Switching Handover………....……… 19
2.6.4. Analisa Handover………. 20
2.6.4.1. Analisa Handover tanpa prioritas……… 20
2.6.4.2. Analisa Handover dengan prioritas tanpa antrian……... 20
2.6.4.3. Analisa Handover dengan prioritas dan antrian……….. 21
BAB III SIMULASI 3.1. Tahapan Perancangan Simulasi………... 22
3.2. Tahapan Desain Konfigurasi……… 22
3.2.1. Penentuan Topologi Jaringan Simulasi..……… 22
3.2.2. Penentuan Parameter-Parameter Pemodelan Sistem..…… 22
3.2.2.1. Sel……….... 22
3.2.2.2. Base Station………. 22
3.2.2.3. Mobile Station………. 23
Universita s Kri sten Maranatha
vii
3.2.2.5. Server VOIP………... 24
3.2.2.6. Server HTTP……….... 25
3.2.2.7. Parameter Service Class Mobile WiMAX……….. 25
3.2.2.8. PHY Profile……….. 26
3.2.3. Penentuan Skenario Simulasi..……….... 27
3.2.4. Penentuan Parameter yang akan dianalisa.………. 28
3.2.4.1. Throughput...……….... 28
3.2.4.2. Jitter………... 28
3.2.4.3. Packet Loss……… 28
3.2.4.4. Handover delay……….. 28
BAB IV ANALISIS DATA HASIL SIMULASI 4.1. Pendahuluan……… 30
4.2. Analisis Data Hasil Simulasi………... 31
4.2.1. Skenario 1 ..……… 31
4.2.1.1. VOIP.……… 31
4.2.1.1.1. Throughput..……… 31
4.2.1.1.2. Jitter..………... 32
4.2.1.1.3. Delay.……….. 32
4.2.1.1.4. Packet Loss.……… 32
4.2.1.2. VOD……… 32
4.2.1.2.1. Throughput..………... 33
4.2.1.2.2. Jitter..……….. 33
4.2.1.2.3. Delay..……… 33
4.2.1.2.4. Packet Loss..……….. 33
4.2.1.3. Web Browsing……… 34
Universita s Kri sten Maranatha
viii
4.2.1.3.2. Page Response Time………. 34
4.2.1.3.4. Packet Loss……….. 35
4.2.1.4. Handover Delay..………... 35
4.2.2. Skenario 2………... 36
4.2.2.1. VOIP..……… 36
4.2.2.1.1. Throughput……… 37
4.2.2.1.2. Jitter………... 37
4.2.2.1.3. Delay.……… 37
4.2.2.1.4. Packet Loss.……….. 37
4.2.2.2. VOD………... 37
4.2.2.2.1. Throughput..………. 38
4.2.2.2.2. Jitter..……… 38
4.2.2.2.3. Delay.………... 38
4.2.2.2.4. Packet Loss.………. 38
4.2.2.3. Web Browsing...……… 39
4.2.2.3.1. Throughput……….. 39
4.2.2.3.2. Page Response Time………... 39
4.2.2.3.3. Packet Loss………. 40
4.2.2.4. Handover Delay...………. 40
BAB V KESIMPULAN DAN SARAN 5.1. Kesimpulan………... 41
5.2. Saran………. 42
DAFTAR PUSTAKA
LAMPIRAN A
Universita s Kri sten Maranatha
ix
DAFTAR TABEL
Tabel 2.1. Profile Sistem Mobile WiMAX ……….6
Tabel 2.2. Parameter SOFDMA ... ..9
Tabel 2.3. QoS Service Class pada Mobile WiMAX ………12
Tabel 4.1. VOIP MS1 Kondisi LOS ……….31
Tabel 4.2. VOIP MS2 Kondisi LOS ……….31
Tabel 4.3. VOD MS1 Kondisi LOS ………..32
Tabel 4.4. VOD MS2 Kondisi LOS ………..33
Tabel 4.5. Web Browsing MS1 Kondisi LOS………34
Tabel 4.6. Web Browsing MS2 Kondisi LOS………34
Tabel 4.7. Handover delay MS1 Kondisi LOS ……….35
Tabel 4.8. Handover delay MS2 Kondisi LOS..………... 35
Tabel 4.9. VOIP MS1 Kondisi NLOS ………. 36
Tabel 4.10. VOIP MS2 Kondisi NLOS……… 36
Tabel 4.11. VOD MS1 Kondisi NLOS………. 37
Tabel 4.12. VOD MS2 Kondisi NLOS………. 38
Tabel 4.13. Web Browsing MS1 Kondisi NLOS……….. 39
Tabel 4.14. Web Browsing MS2 Kondisi NLOS ………. 39
Universita s Kri sten Maranatha
x
Universita s Kri sten Maranatha
xi
DAFTAR GAMBAR
Gambar 2.1. Profile Sistem Mobile WiMAX Release-1………. 5
Gambar 2.2. Struktur Subcarrier Sinyal OFDMA... 7
Gambar 2.3. Sinyal OFDM dan OFDMA... 8
Gambar 2.4. Handover Network Topology Sistem IEEE 802.16e ………... 14
Gambar 2.5. Prosedur Hard Handover……….. 15
Gambar 2.6. Prosedur Scanning………... 16
Gambar 2.7. Prosedur Negosiasi...……… 17
Gambar 2.8. Pertukaran Pesan Saat Mobile Station Melakukan Inisialiasi Handover...19
Gambar 2.9. Mekanisme Analisa Handover Dengan Prioritas Dan Antrian... 21
Gambar 3.1. Diagram Alir Perancangan Simulasi... 22
Universita s Kri sten Maranatha
xii
SINGKATAN
BE Best Effort
BTS Base Transceiver Station
BWA Broadband Wireless Access
FFT Fast Fourier Transform
FBSS Fast Base Station Switching
HHO Hard Handover
LOS Line of Sight
MDHO Macro Diversity Handover
MS Mobile Station
NLOS Non Line of Sight
OFDM Orthogonal Frequency Division Multiplexing
OFDMA Orthogonal Frequency Division Multiple Access
rtPS real time Polling Service
SOFDMA Scalable Orthogonal Frequency Division Multiple Access
TDD Time Division Duplex
UGS Unsolicited Grant Service
WIMAX Worldwide Interoperability for Microwave Access
VOD Video On Demand
LAMPIRAN A
A-1 Kecepatan 10 km/jam Kondisi LOS
THROUGHPUT
1. Grafik Throughput VOIP MS1
2. Grafik Throughput VOIP MS2
0 1000 2000 3000 4000 5000 6000 7000 8000 9000
0 2000 4000 6000 8000 10000 12000 14000
T
h
ro
u
g
h
p
u
t
(b
y
te
s/
se
c)
time (sec)
Throughput VOIP MS1 10 Km/Jam LOS
0 1000 2000 3000 4000 5000 6000 7000 8000 9000
0 2000 4000 6000 8000 10000 12000 14000
T
h
ro
u
g
h
p
u
t
(b
y
te
s/
se
c)
time (sec)
A-2 3. Grafik Throughput VOD MS1
4. Grafik Throughput VOD MS2
0 2000 4000 6000 8000 10000 12000
0 2000 4000 6000 8000 10000 12000 14000
T
h
ro
u
g
h
p
u
t
(b
y
te
s/
se
c)
time (sec)
Throughput VOD MS1 10 Km/Jam LOS
0 2000 4000 6000 8000 10000 12000
0 2000 4000 6000 8000 10000 12000 14000
T
h
ro
u
g
h
p
u
t
(b
y
te
s/
se
c)
time (sec)
A-3
5. Grafik Throughput Web Browsing MS1
6. Grafik Throughput Web Browsing MS2
0 20 40 60 80 100 120 140 160
0 2000 4000 6000 8000 10000 12000 14000
T
h
ro
u
g
h
p
u
t
(b
y
te
s/
se
c)
time (sec)
Throughput Web Browsing MS1 10 Km/Jam LOS
0 20 40 60 80 100 120 140 160 180
0 2000 4000 6000 8000 10000 12000 14000
T
h
ro
u
g
h
p
u
t
(b
y
te
s/
se
c)
time (sec)
A-4 JITTER
1. Grafik Jitter VOIP MS1
2. Grafik Jitter VOIP MS2
0.000094 0.000096 0.000098 0.0001 0.000102 0.000104 0.000106
0 2000 4000 6000 8000 10000 12000 14000
Ji
tt
e
r
(s
e
c)
time (sec)
Jitter VOIP MS1 10 Km/Jam LOS
0 0.00002 0.00004 0.00006 0.00008 0.0001 0.00012 0.00014 0.00016
0 2000 4000 6000 8000 10000 12000 14000
Ji
tt
e
r
(s
e
c)
time (sec)
A-5 3. Grafik Jitter VOD MS1
4. Grafik Jitter VOD MS2
0 0.00001 0.00002 0.00003 0.00004 0.00005 0.00006 0.00007 0.00008 0.00009 0.0001
0 2000 4000 6000 8000 10000 12000 14000
Ji
tt
e
r
(s
e
c)
time (sec)
Jitter VOD MS1 10 Km/Jam LOS
0 0.00001 0.00002 0.00003 0.00004 0.00005 0.00006
0 2000 4000 6000 8000 10000 12000 14000
Ji
tt
e
r
(s
e
c)
time (sec)
A-6 DELAY
1. Grafik Delay VOIP MS1
2. Grafik Delay VOIP MS2
0.0875 0.088 0.0885 0.089 0.0895 0.09
0 2000 4000 6000 8000 10000 12000 14000
D
e
la
y
(
se
c)
time (sec)
Delay VOIP MS1 10 Km/Jam LOS
0.086 0.088 0.09 0.092 0.094 0.096 0.098 0.1 0.102
0 2000 4000 6000 8000 10000 12000 14000
D
e
la
y
(
se
c)
time (sec)
A-7 3. Grafik Delay VOD MS1
4. Grafik Delay VOD MS2
0 0.005 0.01 0.015 0.02 0.025 0.03
0 2000 4000 6000 8000 10000 12000 14000
D
e
la
y
(
se
c)
time (sec)
Delay VOD MS1 10 Km/Jam LOS
0 0.005 0.01 0.015 0.02 0.025 0.03
0 2000 4000 6000 8000 10000 12000 14000
D
e
la
y
(
se
c)
time (sec)
A-8 HANDOVER DELAY
1. Grafik Handover delay MS1
2. Grafik Handover delay MS2
0.0215 0.022 0.0225 0.023 0.0235 0.024 0.0245 0.025 0.0255
0 2000 4000 6000 8000 10000 12000 14000
H
a
n
d
o
v
e
r
D
e
la
y
(
se
c)
time (sec)
Handover Delay MS1 10 Km/Jam LOS
0.0215 0.022 0.0225 0.023 0.0235 0.024 0.0245 0.025 0.0255
0 2000 4000 6000 8000 10000 12000 14000
H
a
n
d
o
v
e
r
D
e
la
y
(
se
c)
time (sec)
A-9 Kecepatan 15 km/jam Kondisi LOS
THROUGHPUT
1. Grafik Throughput VOIP MS1
2. Grafik Throughput VOIP MS2
0 1000 2000 3000 4000 5000 6000 7000 8000 9000
0 2000 4000 6000 8000 10000
T
h
ro
u
g
h
p
u
t
(b
y
te
s/
se
c)
time (sec)
Throughput VOIP MS1 15 Km/Jam LOS
0 1000 2000 3000 4000 5000 6000 7000 8000
0 2000 4000 6000 8000 10000
T
h
ro
u
g
h
p
u
t
(b
y
te
s/
se
c)
time (sec)
A-10 3. Grafik Throughput VOD MS1
4. Grafik Throughput VOD MS2
0 2000 4000 6000 8000 10000 12000
0 2000 4000 6000 8000 10000
T
h
ro
u
g
h
p
u
t
(b
y
te
s/
se
c)
time (sec)
Throughput VOD MS1 15 Km/Jam LOS
0 2000 4000 6000 8000 10000 12000
0 2000 4000 6000 8000 10000
T
h
ro
u
g
h
p
u
t
(b
y
te
s/
se
c)
time (sec)
A-11
5. Grafik Throughput Web Browsing MS1
6. Grafik Throughput Web Browsing MS2
0 20 40 60 80 100 120 140 160 180
0 2000 4000 6000 8000 10000
T
h
ro
u
g
h
p
u
t
(b
y
te
s/
se
c)
time (sec)
Throughput Web Browsing MS1 15 Km/Jam LOS
0 20 40 60 80 100 120 140 160
0 2000 4000 6000 8000 10000
T
h
ro
u
g
h
p
u
t
(b
y
te
s/
se
c)
time (sec)
A-12 JITTER
1. Grafik Jitter VOIP MS1
2. Grafik Jitter VOIP MS2
0.000094 0.000096 0.000098 0.0001 0.000102 0.000104 0.000106 0.000108
0 2000 4000 6000 8000 10000
Ji
tt
e
r
(s
e
c)
time (sec)
Jitter VOIP MS1 15 Km/Jam LOS
0 0.00002 0.00004 0.00006 0.00008 0.0001 0.00012 0.00014 0.00016
0 2000 4000 6000 8000 10000
Ji
tt
e
r
(s
e
c)
time (sec)
A-13 3. Grafik Jitter VOD MS1
4. Grafik Jitter VOD MS2
0 0.00002 0.00004 0.00006 0.00008 0.0001 0.00012
0 2000 4000 6000 8000 10000
Ji
tt
e
r
(s
e
c)
time (sec)
Jitter VOD MS1 15 Km/Jam LOS
0 0.000005 0.00001 0.000015 0.00002 0.000025 0.00003 0.000035 0.00004 0.000045
0 2000 4000 6000 8000 10000
Ji
tt
e
r
(s
e
c)
time (sec)
A-14 DELAY
1. Grafik Delay VOIP MS1
2. Grafik Delay VOIP MS2
0.088 0.0885 0.089 0.0895 0.09 0.0905 0.091
0 2000 4000 6000 8000 10000
D
e
la
y
(
se
c)
time (sec)
Delay VOIP MS1 15 Km/Jam LOS
0.086 0.088 0.09 0.092 0.094 0.096 0.098 0.1 0.102
0 2000 4000 6000 8000 10000
D
e
la
y
(
se
c)
time (sec)
A-15 3. Grafik Delay VOD MS1
4. Grafik Delay VOD MS2
0 0.005 0.01 0.015 0.02 0.025 0.03
0 2000 4000 6000 8000 10000
D
e
la
y
(
se
c)
time (sec)
Delay VOD MS1 15 Km/Jam LOS
0 0.005 0.01 0.015 0.02 0.025 0.03
0 2000 4000 6000 8000 10000
D
e
la
y
(
se
c)
time (sec)
A-16 HANDOVER DELAY
1. Grafik Handover delay MS1
2. Grafik Handover delay MS2
0 0.005 0.01 0.015 0.02 0.025 0.03
0 2000 4000 6000 8000 10000
H
a
n
d
o
v
e
r
D
e
la
y
(
se
c)
time (sec)
Handover Delay MS1 15 Km/Jam LOS
0 0.005 0.01 0.015 0.02 0.025 0.03
0 2000 4000 6000 8000 10000
H
a
n
d
o
v
e
r
D
e
la
y
(
se
c)
time (sec)
A-17 Kecepatan 20 km/jam Kondisi LOS
THROUGHPUT
1. Grafik Throughput VOIP MS1
2. Grafik Throughput VOIP MS2 0
1000 2000 3000 4000 5000 6000 7000 8000 9000
0 2000 4000 6000 8000
T
h
ro
u
g
h
p
u
t
(b
y
te
s/
se
c)
time (sec)
Throughput VOIP MS1 20 Km/Jam LOS
0 2000 4000 6000 8000 10000
0 2000 4000 6000 8000
T
h
ro
u
g
h
p
u
t
(b
y
te
s/
se
c)
time (sec)
A-18 3. Grafik Throughput VOD MS1
4. Grafik Throughput VOD MS2
0 2000 4000 6000 8000 10000 12000
0 1000 2000 3000 4000 5000 6000 7000
T
h
ro
u
g
h
p
u
t
(b
y
te
s/
se
c)
time (sec)
Throughput VOD MS1 20 Km/Jam LOS
0 2000 4000 6000 8000 10000 12000
0 2000 4000 6000 8000
T
h
ro
u
g
h
p
u
t
(b
y
te
s/
se
c)
time (sec)
A-19 5. Grafik Web Browsing MS1
6. Grafik Web Browsing MS2
0 20 40 60 80 100 120 140 160 180 200
0 1000 2000 3000 4000 5000 6000 7000
T
h
ro
u
g
h
p
u
t
(b
y
te
s/
se
c)
time (sec)
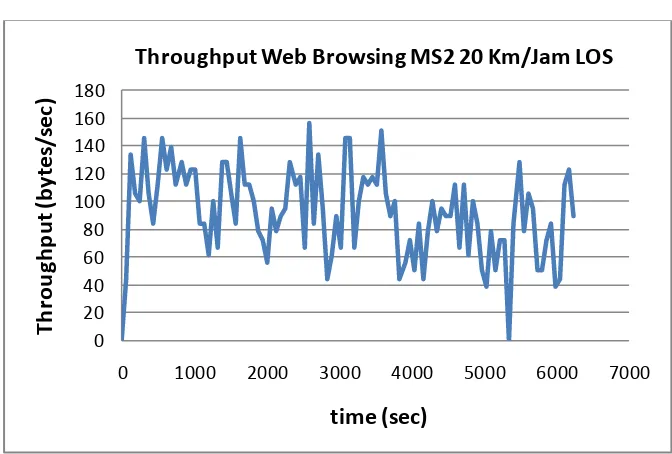
Throughput Web Browsing MS1 20 Km/Jam LOS
0 20 40 60 80 100 120 140 160 180
0 1000 2000 3000 4000 5000 6000 7000
T
h
ro
u
g
h
p
u
t
(b
y
te
s/
se
c)
time (sec)
[image:30.596.165.498.142.363.2] [image:30.596.167.503.417.644.2]A-20 JITTER
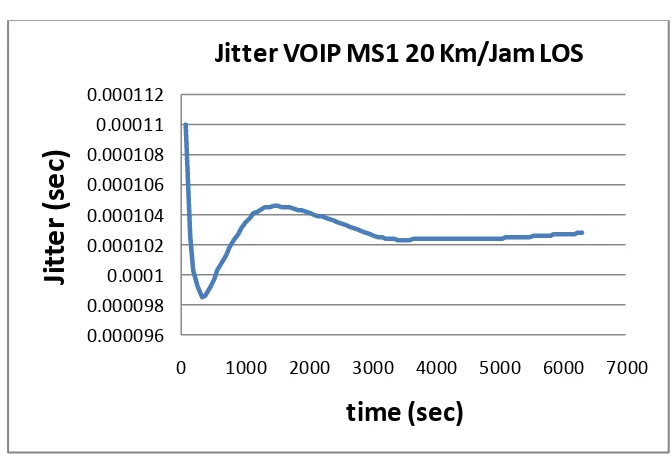
1. Grafik Jitter VOIP MS1
2. Grafik Jitter VOIP MS2
0.000096 0.000098 0.0001 0.000102 0.000104 0.000106 0.000108 0.00011 0.000112
0 1000 2000 3000 4000 5000 6000 7000
Ji
tt
e
r
(s
e
c)
time (sec)
Jitter VOIP MS1 20 Km/Jam LOS
0 0.00002 0.00004 0.00006 0.00008 0.0001 0.00012 0.00014 0.00016
0
2000
4000
6000
8000
Ji
tt
e
r
(s
e
c)
time (sec)
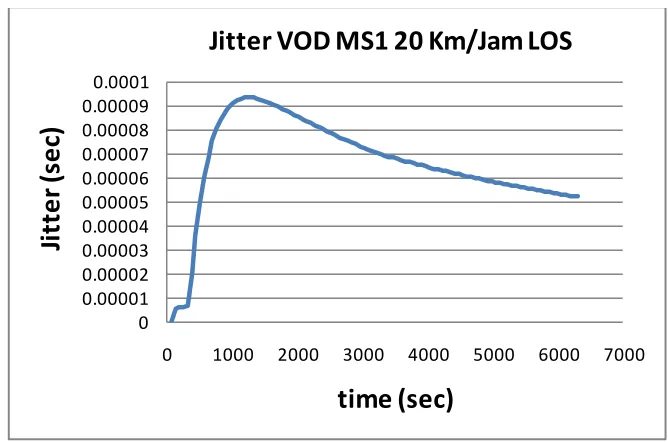
[image:31.596.165.501.167.395.2] [image:31.596.169.509.470.692.2]A-21 3. Grafik Jitter VOD MS1
4. Grafik Jitter VOD MS2
0 0.00001 0.00002 0.00003 0.00004 0.00005 0.00006 0.00007 0.00008 0.00009 0.0001
0 1000 2000 3000 4000 5000 6000 7000
Ji
tt
e
r
(s
e
c)
time (sec)
Jitter VOD MS1 20 Km/Jam LOS
0 0.00002 0.00004 0.00006 0.00008 0.0001
0 2000 4000 6000 8000
Ji
tt
e
r
(s
e
c)
time (sec)
[image:32.596.165.499.142.363.2]A-22 DELAY
1. Grafik Delay VOIP MS1
2. Grafik Delay VOIP MS2 0.0865
0.087 0.0875 0.088 0.0885 0.089 0.0895 0.09 0.0905
0 2000 4000 6000 8000
D
e
la
y
(
se
c)
time (sec)
Delay VOIP MS1 20 Km/Jam LOS
0.086 0.088 0.09 0.092 0.094 0.096 0.098 0.1 0.102
0 2000 4000 6000 8000
D
e
la
y
(
se
c)
time (sec)
A-23 3. Grafik Delay VOD MS1
4. Grafik Delay VOD MS2
0 0.005 0.01 0.015 0.02 0.025 0.03
0 1000 2000 3000 4000 5000 6000 7000
D
e
la
y
(
se
c)
time (sec)
Delay VOD MS1 20 Km/Jam LOS
0 0.005 0.01 0.015 0.02 0.025 0.03
0 1000 2000 3000 4000 5000 6000 7000
D
e
la
y
(
se
c)
time (sec)
A-24 HANDOVER DELAY
1. Grafik Handover delay MS1
2. Grafik Handover delay MS2
0 0.005 0.01 0.015 0.02 0.025 0.03
0 1000 2000 3000 4000 5000 6000 7000
H
a
n
d
o
v
e
r
D
e
la
y
(
se
c)
time (sec)
Handover Delay MS1 20 Km/Jam LOS
0 0.005 0.01 0.015 0.02 0.025 0.03
0 1000 2000 3000 4000 5000 6000
H
a
n
d
o
v
e
r
D
e
la
y
(
se
c)
time (sec)
A-25 Kecepatan 25 km/jam Kondisi LOS
THROUGHPUT
1. Grafik Throughput VOIP MS1
2. Grafik Throughput VOIP MS2
0 1000 2000 3000 4000 5000 6000 7000 8000
0 1000 2000 3000 4000 5000 6000
T
h
ro
u
g
h
p
u
t
(b
y
te
s/
se
c)
time (sec)
Throughput VOIP MS1 25 Km/Jam LOS
0 1000 2000 3000 4000 5000 6000 7000 8000
0 1000 2000 3000 4000 5000 6000
T
h
ro
u
g
h
p
u
t
(b
y
te
s/
se
c)
time (sec)
A-26 3. Grafik Throughput VOD MS1
4. Grafik Throughput VOD MS2
0 2000 4000 6000 8000 10000 12000
0 1000 2000 3000 4000 5000 6000
T
h
ro
u
g
h
p
u
t
(b
y
te
s/
se
c)
time (sec)
Throughput VOD MS1 25 Km/Jam LOS
0 2000 4000 6000 8000 10000 12000
0 1000 2000 3000 4000 5000 6000
T
h
ro
u
g
h
p
u
t
(b
y
te
s/
se
c)
time (sec)
A-27
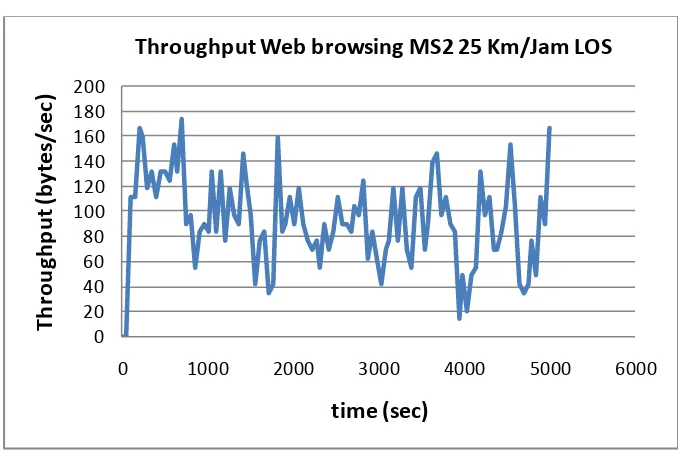
5. Grafik Throughput Web Browsing MS1
6. Grafik Throughput Web Browsing MS2
0 20 40 60 80 100 120
0 1000 2000 3000 4000 5000 6000
T
h
ro
u
g
h
p
u
t
(
b
y
te
s/
se
c)
time (sec)
Throughput Web Browsing MS1 25 Km/Jam LOS
0 20 40 60 80 100 120 140 160 180 200
0 1000 2000 3000 4000 5000 6000
T
h
ro
u
g
h
p
u
t
(b
y
te
s/
se
c)
time (sec)
[image:38.596.167.506.419.645.2]A-28 JITTER
1. Grafik Jitter VOIP MS1
2. Grafik Jitter VOIP MS2
0.000094 0.000096 0.000098 0.0001 0.000102 0.000104 0.000106 0.000108
0 1000 2000 3000 4000 5000 6000
Ji
tt
e
r
(s
e
c)
time (sec)
Jitter VOIP MS1 25 Km/Jam LOS
0 0.00002 0.00004 0.00006 0.00008 0.0001 0.00012 0.00014 0.00016
0 1000 2000 3000 4000 5000 6000
Ji
tt
e
r
(s
e
c)
time (sec)
A-29 3. Grafik Jitter VOD MS1
4. Grafik Jitter VOD MS2
0 0.00002 0.00004 0.00006 0.00008 0.0001 0.00012
0 1000 2000 3000 4000 5000 6000
Ji
tt
e
r
(s
e
c)
time (sec)
Jitter VOD MS1 25 Km/Jam LOS
0 0.00001 0.00002 0.00003 0.00004 0.00005 0.00006
0 1000 2000 3000 4000 5000 6000
Ji
tt
e
r
(s
e
c)
time (sec)
A-30 DELAY
1. Grafik Delay VOIP MS1
2. Grafik Delay VOIP MS2
0.086 0.0865 0.087 0.0875 0.088 0.0885 0.089 0.0895 0.09
0 1000 2000 3000 4000 5000 6000
D
e
la
y
(
se
c)
time (sec)
Delay VOIP MS1 25 Km/Jam LOS
0.086 0.088 0.09 0.092 0.094 0.096 0.098 0.1 0.102
0 1000 2000 3000 4000 5000 6000
D
e
la
y
(
se
c)
time (sec)
A-31 3. Grafik Delay VOD MS1
4. Grafik Delay VOD MS2
0 0.005 0.01 0.015 0.02 0.025 0.03
0 1000 2000 3000 4000 5000 6000
D
e
la
y
(
se
c)
time (sec)
Delay VOD MS1 25 Km/Jam LOS
0 0.005 0.01 0.015 0.02 0.025 0.03
0 1000 2000 3000 4000 5000 6000
D
e
la
y
(
se
c)
time (sec)
A-32 HANDOVER DELAY
1. Grafik Delay Handover delay MS1
2. Grafik Delay Handover delay MS2
0 0.005 0.01 0.015 0.02 0.025 0.03
0 1000 2000 3000 4000 5000 6000
H
a
n
d
o
v
e
r
D
e
la
y
(
se
c)
time (sec)
Handover Delay MS1 25 Km/Jam LOS
0 0.005 0.01 0.015 0.02 0.025 0.03
0 1000 2000 3000 4000 5000 6000
H
a
n
d
o
v
e
r
D
e
la
y
(
se
c)
time (sec)
[image:43.596.158.503.165.422.2] [image:43.596.165.500.454.675.2]LAMPIRAN B
B-1 Kecepatan 10 km/jam Kondisi NLOS
THROUGHPUT
1. Grafik Throughput VOIP MS1
2. Grafik Throughput VOIP MS2
0 1000 2000 3000 4000 5000 6000 7000 8000 9000
0 2000 4000 6000 8000 10000 12000 14000
T
h
ro
u
g
h
p
u
t
(b
y
te
/s
e
c)
time (sec)
Throughput VOIP MS1 10 Km/Jam NLOS
0 1000 2000 3000 4000 5000 6000 7000 8000 9000
0 2000 4000 6000 8000 10000 12000 14000
T
h
ro
u
g
h
p
u
t
(b
y
te
s/
se
c)
time (sec)
B-2 3. Grafik Throughput VOD MS1
4. Grafik Throughput VOD MS2
0 2000 4000 6000 8000 10000 12000
0 2000 4000 6000 8000 10000 12000 14000
T
h
ro
u
g
h
p
u
t
(b
y
te
s/
se
c)
time (sec)
Throughput VOD MS1 10 Km/Jam NLOS
0 2000 4000 6000 8000 10000 12000
0 2000 4000 6000 8000 10000 12000 14000
T
h
ro
u
g
h
p
u
t
(b
y
te
s/
se
c)
time (sec)
[image:46.596.158.490.125.475.2]B-3
5. Grafik Throughput Web Browsing MS1
6. Grafik Throughput Web Browsing MS2
0 20 40 60 80 100 120
0 2000 4000 6000 8000 10000 12000 14000
T
h
ro
u
g
h
p
u
t
(b
y
te
s/
se
c)
time (sec)
Throughput Web Browsing MS1 10 Km/Jam NLOS
0 20 40 60 80 100 120 140 160 180
0 2000 4000 6000 8000 10000 12000 14000
T
h
ro
u
g
h
p
u
t
(b
y
te
s/
se
c)
time (sec)
[image:47.596.163.500.107.337.2] [image:47.596.168.499.398.624.2]B-4 JITTER
1. Grafik Jitter VOIP MS1
2. Grafik Jitter VOIP MS2
0 0.00002 0.00004 0.00006 0.00008 0.0001 0.00012 0.00014
0 2000 4000 6000 8000 10000 12000 14000
Ji
tt
e
r
(s
e
c)
time (sec)
Jitter VOIP MS1 10 Km/Jam NLOS
0 0.00002 0.00004 0.00006 0.00008 0.0001 0.00012 0.00014 0.00016 0.00018
0 2000 4000 6000 8000 10000 12000 14000
Ji
tt
e
r
(s
e
c)
time (sec)
[image:48.596.163.487.134.361.2]B-5 3. Grafik Jitter VOD MS1
4. Grafik Jitter VOD MS2
0 0.00001 0.00002 0.00003 0.00004 0.00005 0.00006
0 2000 4000 6000 8000 10000 12000 14000
Ji
tt
e
r
(s
e
c)
time (sec)
Jitter VOD MS1 10 Km/Jam NLOS
0 0.00002 0.00004 0.00006 0.00008 0.0001 0.00012 0.00014 0.00016
0 2000 4000 6000 8000 10000 12000 14000
Ji
tt
e
r
(s
e
c)
time (sec)
[image:49.596.159.490.123.499.2]B-6 DELAY
1. Grafik Delay VOIP MS1
2. Grafik Delay VOIP MS2
0.085 0.086 0.087 0.088 0.089 0.09 0.091
0 2000 4000 6000 8000 10000 12000 14000
D
e
la
y
(
se
c)
time (sec)
Delay VOIP MS1 10 Km/Jam NLOS
0.086 0.088 0.09 0.092 0.094 0.096 0.098 0.1 0.102
0 2000 4000 6000 8000 10000 12000 14000
D
e
la
y
(
se
c)
time (sec)
[image:50.596.167.487.144.362.2]B-7 3. Grafik Delay VOD MS1
4. Grafik Delay VOD MS2
0 0.005 0.01 0.015 0.02 0.025 0.03
0 2000 4000 6000 8000 10000 12000 14000
D
e
la
y
(
se
c)
time (sec)
Delay VOD MS1 10 Km/Jam NLOS
0 0.005 0.01 0.015 0.02 0.025 0.03 0.035
0 2000 4000 6000 8000 10000 12000 14000
D
e
la
y
(
se
c)
time (sec)
[image:51.596.165.491.116.332.2]B-8 HANDOVER DELAY
1. Grafik Handover delay MS1
2. Grafik Handover delay MS2
0 0.005 0.01 0.015 0.02 0.025 0.03
0 2000 4000 6000 8000 10000 12000 14000
H
a
n
d
o
v
e
r
D
e
la
y
(
se
c)
time (sec)
Handover Delay MS1 10 Km/Jam NLOS
0 0.005 0.01 0.015 0.02 0.025 0.03
0 2000 4000 6000 8000 10000 12000 14000
H
a
n
d
o
v
e
r
D
e
la
y
(
se
c)
time (sec)
[image:52.596.159.489.114.362.2]B-9 Kecepatan 15 km/jam Kondisi NLOS
THROUGHPUT
1. Grafik Throughput VOIP MS1
2. Grafik Throughput VOIP MS2
0 1000 2000 3000 4000 5000 6000 7000 8000
0 2000 4000 6000 8000 10000
T
h
ro
u
g
h
p
u
t
(b
y
te
s/
se
c)
time (sec)
Throughput VOIP MS1 15 Km/Jam NLOS
0 1000 2000 3000 4000 5000 6000 7000 8000 9000
0 2000 4000 6000 8000 10000
T
h
ro
u
g
h
p
u
t
(b
y
te
s/
se
c)
time (sec)
[image:53.596.162.503.160.424.2] [image:53.596.167.501.453.676.2]B-10 3. Grafik Throughput VOD MS1
4. Grafik Throughput VOD MS2
0 2000 4000 6000 8000 10000 12000
0 2000 4000 6000 8000 10000
T
h
ro
u
g
h
p
u
t
(b
y
te
s/
se
c)
time (sec)
Throughput VOD MS1 15 Km/Jam NLOS
0 2000 4000 6000 8000 10000 12000
0 2000 4000 6000 8000 10000
T
h
ro
u
g
h
p
u
t
(b
y
te
s/
se
c)
time (sec)
[image:54.596.160.502.126.454.2]B-11
5. Grafik Throughput Web Browsing MS1
6. Grafik Throughput Web Browsing MS2
0 20 40 60 80 100 120
0 2000 4000 6000 8000 10000
T
h
ro
u
g
h
p
u
t
(b
y
te
s/
se
c)
time (sec)
Throughput Web Browsing MS1 15 Km/Jam NLOS
0 20 40 60 80 100 120
0 2000 4000 6000 8000 10000
T
h
ro
u
g
h
p
u
t
(b
y
te
s/
se
c)
time (sec)
[image:55.596.166.507.109.335.2] [image:55.596.161.504.354.628.2]B-12 JITTER
1. Grafik Jitter VOIP MS1
2. Grafik Jitter VOIP MS2
0 0.00002 0.00004 0.00006 0.00008 0.0001 0.00012 0.00014
0 2000 4000 6000 8000 10000
Ji
tt
e
r
(s
e
c)
time (sec)
Jitter VOIP MS1 15 Km/Jam NLOS
0 0.00002 0.00004 0.00006 0.00008 0.0001 0.00012 0.00014
0 2000 4000 6000 8000 10000
Ji
tt
e
r
(s
e
c)
time (sec)
[image:56.596.164.486.160.380.2]B-13 3. Grafik Jitter VOD MS1
4. Grafik Jitter VOD MS2
0 0.00001 0.00002 0.00003 0.00004 0.00005 0.00006
0 2000 4000 6000 8000 10000
Ji
tt
e
r
(s
e
c)
time (sec)
Jitter VOD MS1 15 Km/Jam NLOS
0 0.00002 0.00004 0.00006 0.00008 0.0001 0.00012 0.00014 0.00016
0 2000 4000 6000 8000 10000
Ji
tt
e
r
(s
e
c)
time (sec)
[image:57.596.167.485.131.350.2]B-14 DELAY
1. Grafik Delay VOIP MS1
2. Grafik Delay VOIP MS2
0.085 0.086 0.087 0.088 0.089 0.09 0.091 0.092 0.093 0.094 0.095 0.096
0 2000 4000 6000 8000 10000
D
e
la
y
(
se
c)
time (sec)
Delay VOIP MS1 15 Km/Jam NLOS
0.086 0.087 0.088 0.089 0.09 0.091 0.092 0.093 0.094 0.095 0.096
0 2000 4000 6000 8000 10000
D
e
la
y
(
se
c)
time (sec)
[image:58.596.167.489.144.364.2] [image:58.596.167.489.417.646.2]B-15 3. Grafik Delay VOD MS1
4. Grafik Delay VOD MS2
0 0.005 0.01 0.015 0.02 0.025 0.03
0 2000 4000 6000 8000 10000
D
e
la
y
(
se
c)
time (sec)
Delay VOD MS1 15 Km/Jam NLOS
0 0.005 0.01 0.015 0.02 0.025 0.03 0.035
0 2000 4000 6000 8000 10000
D
e
la
y
(
se
c)
time (sec)
[image:59.596.164.492.124.349.2] [image:59.596.168.493.420.647.2]B-16 HANDOVER DELAY
1. Grafik Handover delay MS1
2. Grafik Handover delay MS2
0 0.005 0.01 0.015 0.02 0.025 0.03
0 2000 4000 6000 8000 10000
H
a
n
d
o
v
e
r
D
e
la
y
(
se
c)
time (sec)
Handover Delay MS1 15 Km/Jam NLOS
0 0.005 0.01 0.015 0.02 0.025 0.03
0 2000 4000 6000 8000 10000
H
a
n
d
o
v
e
r
D
e
la
y
(
se
c)
time (sec)
[image:60.596.165.500.163.385.2]B-17 Kecepatan 20 km/jam Kondisi NLOS
THROUGHPUT
1. Grafik Throughput VOIP MS1
2. Grafik Throughput VOIP MS2
0 1000 2000 3000 4000 5000 6000 7000 8000
0 1000 2000 3000 4000 5000 6000 7000
T
h
ro
u
g
h
p
u
t
(b
y
te
s/
se
c)
time (sec)
Throughput VOIP MS1 20 Km/Jam NLOS
0 1000 2000 3000 4000 5000 6000 7000 8000
0 1000 2000 3000 4000 5000 6000 7000
T
h
ro
u
g
h
p
u
t
(b
y
te
s/
se
c)
time (sec)
[image:61.596.167.502.188.400.2]B-18 3. Grafik Throughput VOD MS1
4. Grafik Throughput VOD MS2
0 2000 4000 6000 8000 10000 12000
0 1000 2000 3000 4000 5000 6000 7000
T
h
ro
u
g
h
p
u
t
(b
y
te
s/
se
c)
time (sec)
Throughput VOD MS1 20 Km/Jam NLOS
0 2000 4000 6000 8000 10000 12000
0 1000 2000 3000 4000 5000 6000 7000
T
h
ro
u
g
h
p
u
t
(b
y
te
s/
se
c)
time (sec)
[image:62.596.164.496.114.335.2]B-19
5. Grafik Throughput Web Browsing MS1
6. Grafik Throughput Web Browsing MS2
0 20 40 60 80 100 120
0 1000 2000 3000 4000 5000 6000 7000
T
h
ro
u
g
h
p
u
t
(b
y
te
s/
se
c)
time (sec)
Throughput Web Browsing MS1 20 Km/Jam NLOS
0 20 40 60 80 100 120
0 1000 2000 3000 4000 5000 6000 7000
T
h
ro
u
g
h
p
u
t
(b
y
te
s/
se
c)
time (sec)
B-20 JITTER
1. Grafik Jitter VOIP MS1
2. Grafik Jitter VOIP MS2
0 0.00002 0.00004 0.00006 0.00008 0.0001 0.00012 0.00014 0.00016
0 1000 2000 3000 4000 5000 6000 7000
Ji
tt
e
r
(s
e
c)
time (sec)
Jitter VOIP MS1 20 Km/Jam NLOS
0 0.00002 0.00004 0.00006 0.00008 0.0001 0.00012 0.00014
0 1000 2000 3000 4000 5000 6000 7000
Ji
tt
e
r
(s
e
c)
time (sec)
B-21 3. Grafik Jitter VOD MS1
4. Grafik Jitter VOD MS2
0 0.000005 0.00001 0.000015 0.00002 0.000025 0.00003 0.000035 0.00004 0.000045
0 1000 2000 3000 4000 5000 6000 7000
Ji
tt
e
r
(s
e
c)
time (sec)
Jitter VOD MS1 20 Km/Jam NLOS
0 0.00002 0.00004 0.00006 0.00008 0.0001 0.00012 0.00014
0 1000 2000 3000 4000 5000 6000 7000
Ji
tt
e
r
(s
e
c)
time (sec)
B-22 DELAY
1. Grafik Delay VOIP MS1
2. Grafik Delay VOIP MS2
0.084 0.086 0.088 0.09 0.092 0.094 0.096 0.098
0 1000 2000 3000 4000 5000 6000 7000
D
e
la
y
(
se
c)
time (sec)
Delay VOIP MS1 20 Km/Jam NLOS
0.085 0.086 0.087 0.088 0.089 0.09 0.091 0.092 0.093 0.094 0.095 0.096
0 1000 2000 3000 4000 5000 6000 7000
D
e
la
y
(
se
c)
time (sec)
B-23 3. Grafik Delay VOD MS1
4. Grafik Delay VOD MS2
0 0.005 0.01 0.015 0.02 0.025 0.03
0 1000 2000 3000 4000 5000 6000 7000
D
e
la
y
(
se
c)
time (sec)
Delay VOD MS1 20 Km/Jam NLOS
0 0.005 0.01 0.015 0.02 0.025 0.03 0.035
0 1000 2000 3000 4000 5000 6000 7000
D
e
la
y
(
se
c)
time (sec)
B-24 HANDOVER DELAY
1. Grafik Handover delay MS1
2. Grafik Handover delay MS2
0 0.005 0.01 0.015 0.02 0.025 0.03
0 1000 2000 3000 4000 5000 6000 7000
H
a
n
d
o
v
e
r
d
e
la
y
(
se
c)
time (sec)
Handover Delay MS1 20 Km/Jam NLOS
0 0.005 0.01 0.015 0.02 0.025 0.03
0 1000 2000 3000 4000 5000 6000 7000
H
a
n
d
o
v
e
r
d
e
la
y
(
se
c)
time (sec)
B-25 Kecepatan 25 km/jam Kondisi NLOS
THROUGHPUT
1. Grafik Throughput VOIP MS1
2. Grafik Throughput VOIP MS2
0 1000 2000 3000 4000 5000 6000 7000 8000
0 1000 2000 3000 4000 5000 6000
T
h
ro
u
g
h
p
u
t
(b
y
te
s/
se
c)
time (sec)
Throughput VOIP MS1 25 Km/Jam NLOS
0 1000 2000 3000 4000 5000 6000 7000 8000
0 1000 2000 3000 4000 5000 6000
T
h
ro
u
g
h
p
u
t
(b
y
te
s/
se
c)
time (sec)
B-26 3. Grafik Throughput VOD MS1
4. Grafik Throughput VOD MS2
0 2000 4000 6000 8000 10000 12000
0 1000 2000 3000 4000 5000 6000
T
h
ro
u
g
h
p
u
t
(b
y
te
s/
se
c)
time (sec)
Throughput VOD MS1 25 Km/Jam NLOS
0 2000 4000 6000 8000 10000 12000
0 1000 2000 3000 4000 5000 6000
T
h
ro
u
g
h
p
u
t
(b
y
te
s/
se
c)
time (sec)
B-27
5. Grafik Throughput Web Browsing MS1
6. Grafik Throughput Web Browsing MS2
0 20 40 60 80 100 120 140
0 1000 2000 3000 4000 5000 6000
T
h
ro
u
g
h
p
u
t
(b
y
te
s/
se
c)
time (sec)
Throughput Web Browsing MS1 25 Km/Jam NLOS
0 10 20 30 40 50 60 70 80 90 100
0 1000 2000 3000 4000 5000 6000
T
h
ro
u
g
h
p
u
t
(b
y
te
s/
se
c)
time (sec)
B-28 JITTER
1. Grafik Jitter VOIP MS1
2. Grafik Jitter VOIP MS2
0 0.00002 0.00004 0.00006 0.00008 0.0001 0.00012 0.00014 0.00016
0 1000 2000 3000 4000 5000 6000
Ji
tt
e
r
(s
e
c)
time (sec)
Jitter VOIP MS1 25 Km/Jam NLOS
0 0.00002 0.00004 0.00006 0.00008 0.0001 0.00012 0.00014
0 1000 2000 3000 4000 5000 6000
Ji
tt
e
r
(s
e
c)
time (sec)
B-29 3. Grafik Jitter VOD MS1
4. Grafik Jitter VOD MS2
0 0.000005 0.00001 0.000015 0.00002 0.000025 0.00003 0.000035 0.00004
0 1000 2000 3000 4000 5000 6000
Ji
tt
e
r
(s
e
c)
time (sec)
Jitter VOD MS1 25 Km/Jam NLOS
0 0.00002 0.00004 0.00006 0.00008 0.0001 0.00012 0.00014 0.00016 0.00018 0.0002
0 1000 2000 3000 4000 5000 6000
Ji
tt
e
r
(s
e
c)
time (sec)
B-30 DELAY
1. Grafik Delay VOIP MS1
2. Grafik Delay VOIP MS2
0.085 0.086 0.087 0.088 0.089 0.09 0.091 0.092 0.093 0.094 0.095 0.096
0 1000 2000 3000 4000 5000 6000
D
e
la
y
(
se
c)
time (sec)
Delay VOIP MS1 25 Km/Jam NLOS
0.088 0.089 0.09 0.091 0.092 0.093 0.094 0.095 0.096
0 1000 2000 3000 4000 5000 6000
D
e
la
y
(
se
c)
time (sec)
B-31 3. Grafik Delay VOD MS1
4. Grafik Delay VOD MS2
0 0.005 0.01 0.015 0.02 0.025 0.03
0 1000 2000 3000 4000 5000 6000
D
e
la
y
(
se
c)
time (sec)
Delay VOD MS1 25 Km/Jam NLOS
0 0.005 0.01 0.015 0.02 0.025 0.03 0.035 0.04 0.045
0 1000 2000 3000 4000 5000 6000
D
e
la
y
(
se
c)
time (sec)
B-32 HANDOVER DELAY
1. Grafik Handover delay MS1
2. Grafik Handover delay MS2
0 0.005 0.01 0.015 0.02 0.025 0.03
0 1000 2000 3000 4000 5000 6000
H
a
n
d
o
v
e
r
d
e
la
y
(
se
c)
time (sec)
Handover Delay MS1 25 Km/Jam NLOS
0 0.005 0.01 0.015 0.02 0.025 0.03
0 1000 2000 3000 4000 5000 6000
H
a
n
d
o
v
e
r
d
e
la
y
(
se
c)
time (sec)
1 Universita s Kri sten Maranatha BAB I
PENDAHULUAN
1. LATAR BELAKANG
Perkembangan teknologi akses wireless berkembang secara pesat untuk
memenuhi tuntutan pengguna yang membutuhkan komunikasi data kecepatan
tinggi, kapasitas besar, serta dengan mobilitas yang sangat tinggi menuju
broadband mobile communication. Terdapat 2 (dua) basis perkembangan
teknologi wireless, yaitu pertama berbasis komunikasi selular yang pada awalnya
untuk orientasi voice dan yang kedua berbasis komunikasi data yang disebut
dengan broaband wireless access (BWA).
Teknologi broadband wireless access telah berevolusi melahirkan
Woldwide Interoperability for Microwave Access (WiMAX) yang berbasis pada
standard IEEE 802.16. Standard IEEE 802.16 ini menggunakan dua model, yaitu
tetap (fixed) dan bergerak (mobile), sehingga WIMAX dapat melayani para
pengguna dengan antena tetap (fixed wireless) maupun pengguna yang
berpindah-pindah tempat.
Dalam tugas akhir ini akan dibahas mengenai pengaruh handover pada
jaringan Mobile WiMAX untuk mendukung kemampuan mobility. Kemampuan
mobility yang handal dalam jaringan Mobile WiMAX didukung oleh skema
handover yang di mandatory oleh WiMAX forum, yaitu skema Hard Handover.
Mobile WiMAX merupakan solusi broadband wireless yang memungkinkan
konvergensi jaringan mobile dan fixed broadband melalui satu teknologi akses
broadband luas dan arsitektur jaringan yang fleksibel. Profil Mobile WiMAX
release-1 akan menjangkau bandwidth kanal sebesar 5 MHz; 7 MHz; 8.75 MHz;
dan 10 MHz untuk alokasi spektrum yang terdaftar pada pada frekuensi 2.3 GHz;
BAB I PENDAHULUAN
Universita s Kri sten Maranatha 2
2. Identifikasi Masalah
1. Bagaimana melakukan simulasi hard handover pada jaringan Mobile
WiMAX dan menganalisa pengaruhnya terhadap kapasitas trafik data
pada saat kondisi LOS dan NLOS ?
3. Tujuan
1. Melakukan simulasi hard handover pada jaringan Mobile WiMAX dan
menganalisa pengaruhnya terhadap kapasitas trafik data,
2. Menganalisa parameter-parameter kapasitas trafik data seperti :
throughput, jitter, packet loss, dan handover delay yang berkaitan
dengan kualitas jaringan pada Mobile WiMAX.
4. Pembatasan Masalah
Pembatasan masalah dalam tugas akhir ini adalah :
1. Simulasi yang digunakan berdasarkan standard IEEE 802.16e
2. Parameter-parameter yang akan dianalisa adalah : throughput, jitter,
packet loss, dan handover delay
3. Jenis handover yang digunakan adalah hard handover
4. Simulasi ini menggunakan software opnet modeler versi 14
educational version.
5. Metodologi
Metode yang digunakan dalam penyusunan Tugas Akhir ini adalah :
1. Tinjauan pustaka, dalam hal ini penulis mempelajari buku, artikel, dan
situs yang terkait dengan topik Tugas Akhir yang sedang dikerjakan
2. Pengumpulan data, dalam hal ini penulis mengumpulkan data-data
yang berkaitan dengan topik yang dikerjakan dalam Tugas Akhir ini
3. Merancang simulasi yang berkaitan dengan topik Tugas Akhir yang
BAB I PENDAHULUAN
Universita s Kri sten Maranatha 3
6. Sistematika Penulisan
Penulisan tugas akhir ini terdiri dari beberapa bagian, yaitu sebagai
berikut:
BAB I PENDAHULUAN
Berisi latar belakang masalah, identifikasi masalah, tujuan,
pembatasan masalah, metodologi, dan sistematika
penulisan.
BAB II LANDASAN TEORI
Dalam bab ini dibahas mengenai berbagai dasar teori yang
mendukung penyusunan tugas akhir ini, diantaranya :
konsep teknologi Mobile WiMAX, jenis-jenis QoS dalam
Mobile WiMAX, dan konsep handover dalam jaringan
Mobile WiMAX.
BAB III SIMULASI
Dalam bab ini berisi tahapan-tahapan simulasi yang
dilakukan, model jaringan dan parameter-parameter yang
digunakan dalam sistem Mobile WiMAX
BAB IV ANALISA DATA HASIL SIMULASI
Dalam bab ini membahas analisa data hasil simulasi yang
diperoleh. Parameter-parameter yang dianalisa meliputi :
throughput, jitter, delay, packet loss, dan handover delay.
BAB V KESIMPULAN DAN SARAN
Pada bagian bab ini berisi tentang kesimpulan dari hasil
41 Universita s Kri sten Maranatha BAB V
KESIMPULAN DAN SARAN
5.1. KESIMPULAN
Dari hasil simulasi hard handover pada mobile wimax saat kecepatan 10,
15, 20, dan 25 km/jam diperoleh kesimpulan sebagai berikut :
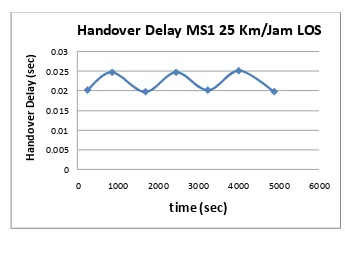
1. Nilai handover delay yang diperoleh masih dibawah 150 ms. Nilai handover
delay yang terjadi tidak bergantung kepada faktor kecepatan pergerakan dari
user. Pada kondisi LOS handover delay MS1 antara 22.113 s/d 24.197 ms,
untuk MS2 antara 22.231 s/d 24.315 ms. Sedangkan pada saat NLOS
handover delay MS1 antara 21.34 s/d 24.432 ms, untuk MS2 antara 21.28 s/d
24.226 ms.
2. Kecepatan pergerakan MS1 dan MS2 sangat mempengaruhi packet loss yang diterima. Untuk aplikasi VOIP mampu dilayani dalam kondisi LOS dan
NLOS dengan nilai packet loss sebesar 14.12 % saat kondisi LOS, dan nilai
packet loss sebesar 15.7 % saat kondisi NLOS. Sedangkan aplikasi VOD
memiliki packet loss sebesar 8.76 % saat kondisi LOS, dan 10.65 % saat
kondisi NLOS.
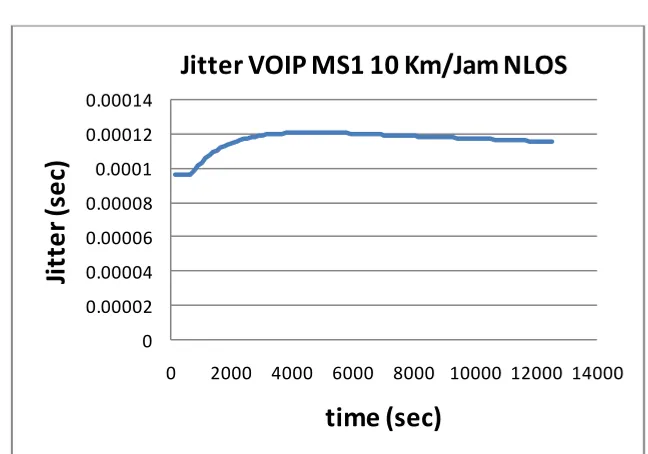
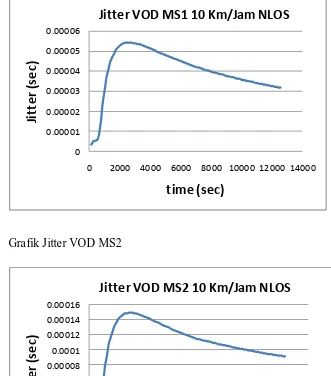
3. Nilai jitter VOIP dan VOD masuk dalam kategori sangat bagus ( 0 ms ). Jitter VOIP saat LOS antara 0.1023 s/d 0.1352 ms, sedangkan saat NLOS antara
0.1167 s/d 0.1386 ms. Jitter VOD saat LOS antara 0.0326 s/d 0.0708 ms,
BAB V KESIMPULAN DAN SARAN 42
Universita s Kri sten Maranatha 5.2. SARAN
1. Untuk tujuan pengembangan teknologi sebaiknya jaringan Mobile WiMAX ini segera diimplementasikan agar mendapatkan hasil yang terbaik sesuai dengan
kondisi di lapangan.
Universita s Kri sten Maranatha DAFTAR PUSTAKA
1. Dwi Hantoro, Gunadi dan Wibisono, Gunawan. Mobile Broadband “Tren
Teknologi Wireless Saat Ini dan Masa Datang, Penerbit Informatika Bandung,
2008
2. Fixed, nomadic, portable and mobile applications for 802.16-2004 and
802.16e WiMAX networks / Copyright 2005 WiMAX Forum
http://www.wimaxforum.org/news/downloads/Applications_for_802.16-2004_and_802.16e_WiMAX_networks_final.pdf
3. Kupas Tuntas Teknologi WiMAX, Penerbit ANDI Yogyakarta, 2009
4. Kwang-Cheng Cen dan Roberto de Marca, J. Mobile WiMAX, Penerbit John
Wiley & Sons, Ltd, 2008
5. Makelainen, Antti,‖ Analysis of Handover Performance in Mobile WiMAX”,
Helsinki University of Technology
6. Mobile WiMAX – Part I : A Technical Overview and Performance Evaluation
Copyright 2006 WiMAX Forum
http://www.wimaxforum.org/ne ws/downloads/Mobile_WiMAX_Part1
Overvie w_and_Pe rformance.pdf
7. Mobile WiMAX—Part II: A comparative analysis. White Paper. Copyright
April 2006. WiMAX Forum
http://www.wimaxforum.org/
8. Sik Choi, Gyung-Ho Hwang, Taesoo Kwon, Ae-Ri Lim, and Dong-Ho Cho,
―Fast Handover Scheme for Real-Time Downlink Services in IEEE 802.16e
BWA System,” Vehicular Technology Conference, pp 2028- 2032 Vol 3, May
2005.
9. WiMAX802.16e user guide for opnet modeler-file pdf
10. Supartono, Anita, “Diktat Kuliah Sistem Komunikasi Bergerak”, 2009
11. C, Y. Lee, William, “ Mobile Cellular Telecommunications”, Penerbit