Effects of overexpression of
Escherichia coli kat
E and
bet
genes on
the tolerance for salt stress in a freshwater cyanobacterium
Synechococcus
sp. PCC 7942
Nobuo Kaku
a, Takashi Hibino
b, Yoshito Tanaka
b, Hiroshi Ishikawa
b,
Etsuko Araki
a, Tetsuko Takabe
c, Teruhiro Takabe
a,b,*
aResearch Institute of Meijo Uni
6ersity,Tenpaku-ku,Nagoya,Aichi468-8502, Japan bDepartment of Chemistry,Faculty of Science and Technology,Meijo Uni
6ersity,Tenpaku-ku,Nagoya,Aichi468-8502,Japan cGraduate School of Agricultural Science,Nagoya Uni6ersity,Chikusa-ku,Nagoya,Aichi 464-8601, Japan
Received 19 May 2000; received in revised form 26 July 2000; accepted 27 July 2000
Abstract
To explore the potential role of catalase and glycine betaine in the protection of cyanobacteria from damage due to salt stress, we transformed a freshwater cyanobacteriumSynechococcussp. PCC 7942 with shuttle vectors that contained theEscherichia coli katE,bet, andkatE plusbet(katE/bet) genes. The catalase activity in the cells overexpressingkatE andkatE/betgenes was about 1.4 – 1.8-fold higher than that in the control cells. The control and transformant cells had a similar growth rate in the medium with a low salinity. However, under a high-salinity condition, the cells transformed withkatE grew faster than the control cells, and the cells expressingkatE/betgenes grew faster than those expressing either thekatE orbetgene alone. These results indicate that high-salinity caused oxidative stress and the coexpression of katE and bet genes in Synechococcus cells were superior to the expression of eitherkatE orbetalone for the protection of the cells from the damage due to high-salinity. © 2000 Elsevier Science Ireland Ltd. All rights reserved.
Keywords:Betaine; Catalase; Cyanobacterium; Salt stress; Oxidative stress;Synechococcussp. PCC 7942
www.elsevier.com/locate/plantsci
1. Introduction
Salinity is one of the major factors limiting crop production in the world [1,2]. Organisms that thrive in hypersaline environments possess specific mechanisms to adjust their internal osmotic status. One such mechanism is the ability to accumulate low molecular-weight organic compatible solutes such as sugars, some amino acids and quaternary ammonium compounds [1,3]. Another adaptation mechanism to high-salinity is the exclusion of Na+
ion from cells which has been proposed as a
function of Na+/H+ antiport and Na+ ATPase
[4]. In addition to these toxic effects, salt stress also induces oxidative stress [5,6]. Upon salt stress, the CO2fixation rate may be decreased causing the
overreduction of the photosynthetic electron trans-port (ET) chain [7] and the production of active oxygen species such as singlet oxygen (1O
2
*), super-oxide anion (O2−), hydrogen peroxide (H2O2), and
hydroxyl radical (•OH) [8].
H2O2 is the most stable active oxygen species,
but produces the most reactive active oxygen spe-cies, •OH, if H2O2is present together with O2−and
Fe2+ [8]. The best documented source of H2O2 in
photosynthetic organisms is O2− generated by
Mehler reaction [8]. Therefore, the decomposition of H2O2 is pivotal in the protection of the cells
from oxidative damage. Early reports indicated Abbre6iations: APX, ascorbate peroxidase; Chl, chlorophyll; ET,
electron transport; PSII, photosystem II.
* Corresponding author. Tel.: +81-52-8321151; fax: + 81-52-8321545.
E-mail address:[email protected] (T. Takabe).
that the presence of two major H2O2 scavenging
activities in cyanobacteria, catalase and ascorbate peroxidase (APX) [9]. Catalase activity has been found in all cyanobacterial species tested [10]. However, APX activity has not been found in Synechocystissp. PCC 6803 andSynechococcussp. PCC 7942 [11,12]. The genome sequence also sug-gests the absence of APX gene inSynechocystissp. PCC 6803 [13]. The only enzyme responsible for catalase-peroxidase activity in Synechococcus sp. PCC 7942 is the KatG and the corresponding gene katG has been isolated [11].
The production of glycine betaine, an important osmoprotectant, conferred the tolerance for salt stress in a freshwater cyanobacteriumSynechococ -cus sp. PCC 7942 [14,15]. The accumulation of betaine was found to protect against the inactiva-tion of photosystem II (PSII) [14] and ribulose 1,5-bis-phosphate carboxygenase and oxygenase [16]. However, the effects of overexpression of the catalase gene on the oxidative stress as well as on the salt stress in cyanobacteria have not been reported. Here, we examined whether quenching of H2O2is an important factor for salt tolerance in
cyanobacteria and whether the coexpression of catalase and betaine improves the tolerance for salt stress. We transformed Synechococcus cells with E. coli katE, bet, and katE plus bet (katE/
bet) genes and examined their response to salt stress. The bet genes contain the genes encoding choline dehydrogenase, betaine aldehyde dehydro-genase, and choline transporter, and a regulatory gene [15,17]. The katG encodes a bifunctional catalase-peroxidase (HPI) whereas the katE en-codes a monofunctional catalase (HPII) [18].
2. Materials and methods
2.1. Construction of expression 6ectors for katE,
bet, and katE/bet genes in Synechococcus sp. PCC 7942 cells
A plasmid, pAMkatE72, which contains the katE gene from E. coli was a kind gift from Professor P.C. Loewen, University of Manitoba, Canada [18]. The plasmid, pAMkatE72, was par-tially digested withBamHI andSalI. The resulting katE-containing fragment was ligated into the BamHI and SalI double-digested site of E. coli/
Synechococcus shuttle vector, pUC303-Bm, which
carries the streptomycin- and chloramphenicol-re-sistance genes [15]. The resulting plasmid pUC303-katE was used to transform Synechococcuscells as described by Kuhlemeier and Arkel [19] and Nomura et al. [15]. For the production of betaine, a plasmid vector pUC303-BET, which contains the E. coli betaine synthesis genes, was used and expressed in E. coli DH5a cells [15]. For the
coexpression of katE and bet genes, the plasmid, pAMkatE72, was digested with KpnI and SacI. The resultingkatE-containing fragment was blunt-ended and ligated into the EcoRV site of pGEM5Z. Its plasmid was digested with SalI and ligated into the SalI site of the plasmid pUC303-BET. The resulting plasmid was designated as pUC303-katE/BET. As the control cells, the plas-mid pUC303-Bm was used.
2.2. Growth of cyanobacterium under stress conditions
Synechococcus cells were subcultured at 30°C under continuous fluorescent white light (30 mE
m−2 s−1) in BG 11 liquid medium supplemented
with 100 mM choline and 10 mg ml−1
strepto-mycin, and bubbled with air [20]. Cells at the logarithmic phase were used for the salt- and H2O2-stress experiments. For these experiments,
cells at the later logarithmic phase were trans-ferred into fresh medium containing various con-centrations of NaCl (0 – 0.375 M) or H2O2 (0 – 0.3
mM). The cultures were incubated for several days. During these periods, the growth of cells was monitored by measuring the absorbance at 730 nm with a Shimadzu UV-160A.
2.3. Measurement of catalase acti6ity and glycine
betaine content
W for 15 min. After centrifugation at 15 000×g rpm for 10 min, the supernatant was used for the enzymatic assay. The catalase activity was deter-mined spectrophotometrically by monitoring the rate of H2O2 decomposition at 240 nm using an
extinction coefficient for H2O2of 43.6 M−1 cm−1
[11]. The reaction mixture contained 50 mM potassium phosphate (pH 7.0), 10.5 mM H2O2and
the crude extract. The reaction was run at 25°C and the initial linear rate was used to calculate the activity. The low H2O2 concentrations were
deter-mined through the oxidation of Fe2+ in the
pres-ence of xylenol orange [21]. The catalase activity was stained by the method of Rao et al. [22]. Native polyacrylamide gel electrophoresis (PAGE) was performed with 4 and 10% acrylamide for stacking and separating gels, respectively, contain-ing 10% glycerol. Gels were incubated in 100 ml water containing 0.003% H2O2 during 10 min at
room temperature. Then, gels were briefly rinsed with distilled water and incubated in 100 ml water containing 1% ferric chloride and 1% potassium ferricyanide. The duration of color development was 4 min. Glycine betaine was extracted as de-scribed previously and measured by NMR [15] or TOF-MS (model KOMPACT MALDI IV tDE, Shimadzu/Kratos).
3. Results
3.1. Expression of katE and bet genes in Synechococcus cells
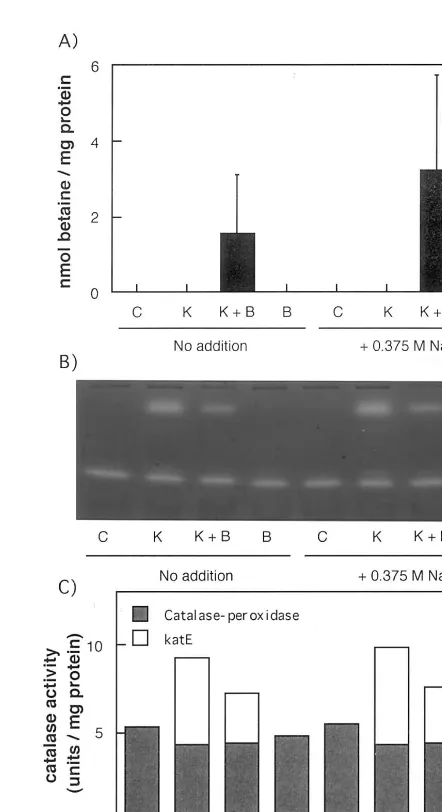
Synechococcus sp. PCC 7942 cells were trans-formed with the pUC303-katE, pUC303-BET, or pUC303-katE/BET plasmid. The accumulation of betaine was observed in the Synechococcus cells expressing bet and katE/bet genes at least under high-salinity condition (Fig. 1A). The activity of catalase was detected by staining as shown in Fig. 1B. Two bands were observed in the cells express-ing katE and katE/bet genes, whereas only one band was observed in the control and bet -express-ing cells. The upper band was due to KatE since it was observed only in the katE-expressing cells. The lower band was observed in all kinds of cells and is due to the catalase-peroxidase KatG in Synechococcus sp. PCC 7942 cells. These assign-ments are reasonable because the Synechococcus KatG is a dimer of 79 kDa subunit [11] whereasE.
coli KatE is a tetramer of the 78 kDa subunit [23]. All these data indicate that the betandkatE genes could be expressed in Synechococcus cells.
Fig. 1. Accumulation of betaine and catalase activity in
Synechococcussp. PCC 7942 cells expressing katE,katE/bet, and bet. (A) The accumulation levels of glycine betaine in
Synechococcussp. PCC 7942 cells expressing katE,katE/bet, and bet. The control and transformant cells were grown in BG11 medium irradiated at 30mE m−2s−1for 3 days, and
then treated for 4 days with or without 0.375 M NaCl. C, control cells; K, cells overexpressing the katE gene; K+B, cells overexpressing the katE/betgenes; B, cells overexpress-ing the bet genes. Vertical bars represent S.E. for three samples. (B) The staining for catalase activity inSynechococ
-cus sp. PCC 7942 cells expressing katE, katE/bet, and bet. The cells were stained as described in Section 2. (C) The catalase activity of control and transformant Synechococcus
Fig. 2. Effects of salt stress on the growth rates of the control and transformantSynechococcuscells. The control and trans-formant cells at logarithmic phase in BG11 medium were subjected to salt stress by inoculation into fresh medium containing indicated concentrations of NaCl. , Control cells; , katE-expressing cells; , bet-expressing cells; ,
katE/bet-expressing cells. Vertical bars represent S.E. for three samples.
The growth rate of the transformant expressing bet genes was higher than that expressing the katE gene in the medium with 0.2 M NaCl whereas the reverse was the case at a higher salinity (0.375 M NaCl). Fig. 2 also shows that the growth rate of the katE/bet-expressing cells was higher than that of the cells expressing ei-ther the katE or bet gene. These results indicate that the overexpression of katE conferred the tolerance for salt stress and the coexpression of katE and bet genes was more efficient than that of either one alone.
3.3. Accumulation of betaine and catalase acti6ity
in Synechococcus cells expressing katE, bet, and katE/bet genes
Next, we examined glycine betaine content and catalase activity in the four kinds of cells. For this purpose, the cells grown in BG11 were treated with or without 0.375 M NaCl for 4 days. As shown in Fig. 1A, glycine betaine was not detected in the bet-expressing cells in the absence of NaCl, but was detected in high-salin-ity medium (0.375 M NaCl). This was consistent with the results of previous paper [15]. However, we observed the significant accumulation of be-taine in the katE/bet-expressing cells even in the absence of NaCl. Its level in BG11 medium (0 M NaCl) was higher than that in the bet -ex-pressing cells in high-salinity medium (0.375 M NaCl). The level of glycine betaine in the katE/
bet-expressing cells increased upon the increase of salinity. The amount of betaine in the katE/
bet-expressing cells was 2.6-fold higher than that in bet-expressing cells in high-salinity medium (0.375 M NaCl, Fig. 1B).
We also examined the catalase activity in three transformants. The catalase activity in the con-trol and bet-expressing cells was low, about 5.5 U mg−1 protein in BG11 medium, but the
activ-ity in the katE- and katE/bet-expressing cells was about 1.8- and 1.4-fold higher than in the control cells, respectively (Fig. 1C). A lower catalase activity in katE/bet-expressing cells than in katE-expressing cells was due to the lower level of KatE in the former cells (Fig. 1B and C). The catalase activity was little influenced by the salinity condition as shown in Fig. 1B and C.
3.2. Salt tolerance of Synechococcus cells expressing katE, bet, and katE/bet genes
3.4. Effects of o6erexpression of KatE on the
photosynthetic acti6ity under salt stress condition
Since Figs. 1 and 2 indicate that the overexpres-sion of KatE conferred the tolerance for salt stress, the effects of KatE overexpression on the ET activity were examined under various salinity conditions. The photosynthetic O2evolution
activ-ity was almost the same between the control and katE-expressing cells grown with BG 11 medium (Fig. 3A). The activity of katE-expressing cells decreased slightly with increasing salinity, whereas that of control cells decreased significantly. The activities of control and katE-expressing cells at 0.375 M NaCl were about 61 and 79%,
respec-Fig. 4. Effects of H2O2 stress on the growth rates of the
control and transformant Synechococcus cells. The control and transformant cells at logarithmic phase in BG11 medium were subjected to H2O2 stress by inoculation into fresh
medium containing indicated concentrations of H2O2. ,
Control cells; , katE-expressing cells; , bet-expressing
cells; , katE/bet-expressing cells. Vertical bars represent S.E. for three samples.
Fig. 3. Effects of salt stress on the O2evolution (A) and Chl
content (B) of the control andkatE-expressingSynechococcus
cells. The control and katE-expressing cells at logarithmic phase in BG11 medium were subjected to salt stress by inoculation into fresh medium containing indicated concen-trations of NaCl. After 24 h, the O2 evolution and Chl
content were measured. Vertical bars represent S.E. for three samples.
tively, of that at 0 M NaCl. The chlorophyll (Chl) contents were also decreased at high-salinity (Fig. 3B). Its decrease was reduced in thekat E-express-ing cells although their effects were small. These data support that the overexpression of KatE con-fers the tolerance to salt stress in a freshwater cyanobacterium Synechococcus sp. PCC 7942.
3.5. Effects of H2O2 on the growth rate of Synechococcus cells expressing katE, bet, and katE/bet genes
Next, we examined whether the overexpression of katE, bet, and katE/bet genes could confer the tolerance for H2O2 stress. The growth rate of the
cells cultured in the medium containing 100 mM
H2O2 was nearly the same in the control and
transformants (Fig. 4), but was different in the medium containing 300 mM H2O2. At 300 mM
H2O2, the Synechococcus cells expressing katE
-expressing cells. The katE/bet-expressing cells grew slower than the katE-expressing cells, but slightly faster than the control and bet-expressing cells. The order of growth rates was correlated with the catalase activity in the cells, suggesting that the catalase activity in the cells, but not the betaine level, was a determinant factor for the tolerance for H2O2 stress.
3.6. Effects of salt and H2O2 on the growth rate of E. coli expressing katE, bet, and katE/bet genes
We next examined the effects of overexpression ofkatE, bet, and katE/betgenes in E. coli for the
tolerance to salt stress. For this purpose, we used E. coli (DH5a) cells which had no bet gene, but
had katE and katG genes. E. coli (DH5a) cells
transformed with the pUC303-Bm, pUC303-katE, pUC303-BET, and pUC303-katE/BET plasmids in the minimum medium M9 had nearly the same growth rate (Fig. 5A). However, in the medium at a higher salinity (\0.5 M NaCl), the bet- and katE/bet-expressing cells grew faster than the con-trol andkatE-expressing cells. These findings indi-cate that the expression ofbet genes, but notkatE gene, is a determinant factor for the tolerance for salt stress in E. coli. The effect of H2O2 on the
growth rate was also examined. The growth rate of all four kinds of E. coli cells was nearly the
Fig. 5. Effects of salt stress (A) and H2O2stress (B) on the growth rate in the control and transformantE.colicells. The control
and transformant cells at logarithmic phase in M9 medium were subjected to salt or H2O2stress by inoculation into fresh medium
same in the medium without H2O2 (Fig. 5B).
However, in the medium with a higher concentra-tion of H2O2(\500mM), the growth rate of these
cells was in the following order, katE-expressing cells-katE/bet-expressing cells\bet-expressing\
control cells (Fig. 5B). These results indicate that the overexpression of katE and katE/bet genes conferred the tolerance for H2O2 stress, and that
betaine played a role in protecting the damage due to H2O2 in E. coli.
4. Discussion
Data presented above clearly showed that in the absence of salt stress, the overexpression of KatE did not increase the growth rate of Synechococcus cells (Fig. 2). However, in the medium with high-salinity, a significant protective effect of overex-pression of catalase on salt stress was observed (Fig. 2). Overexpression of KatE protected the decrease of O2 evolution as well as Chl contents
upon the slt stress (Fig. 3). All these data suggest that Synechococcus cells have a sufficient capacity for decomposing H2O2 under low salinity, but
under high-salinity, Synechococcus cells could not decompose H2O2 sufficiently, and the growth was
improved by the overexpression of KatE. To our knowledge, this is the first report to demonstrate that overexpression of catalase in cyanobacteria could confer the tolerance for salt stress.
The most important result obtained in this study is the observation that coexpression of katE and bet genes leads to the acquisition of salt tolerance inSynechococcus cells. The katE/bet -ex-pressing Synechococcus cells grew faster than the cells expressing either katE orbet gene alone (Fig. 2). It should be noted that thekatE/bet-expressing cells accumulated more glycine betaine than the cells expressing the bet gene alone. This indicates that the coexpression of katE gene withbet genes caused an increased expression of bet genes. Al-though the mechanisms for the enhanced expres-sion of bet genes by the expression of katE gene remain to be clarified, this study demonstrated that the genetic engineering with multigenes is a useful method to improve the salt tolerance of photosynthetic organisms.
Fig. 4 showed that the overexpression of katE gene, but not bet genes, in Synechococcus cells could confer the tolerance for H2O2 stress. This
suggests that betaine could not function for pro-tection of the cells from oxidative damage due to H2O2stress. These phenomena are similar to those
observed in E. coli, in which the overexpression of bet genes did not result in the tolerance for H2O2
stress (Fig. 5). In contrast, the overexpression of KatE inSynechococcuscells could confer the toler-ance for salt stress (Fig. 2), but not in E. coli cells (Fig. 5). Thus, oxidative stress under salt stress might be more important in Synechococcus cells than in E. coli, and the coexpression of katE and betgenes could improve significantly the salt toler-ance of photosynthetic organisms.
Acknowledgements
This work was supported in part by Grants-in-Aid for Scientific Research from the Ministry of Education, Science and Culture of Japan, the High-Tech Research Center of Meijo University and the Program for Promotion of Basic Research Activities for Innovative Biosciences (PRO-BRAIN) of the Japanese Ministry of Agriculture, Forestry and Fisheries. We thank Toshie Inaba and Eiko Tsunekawa for their expert technical assistance.
References
[1] L.N. Csonka, A.D. Hanson, Prokaryotic osmoregula-tion: genetics and physiology, Annu. Rev. Microbiol. 45 (1991) 569 – 606.
[2] H.J. Bohnert, R.G. Jensen, Strategies for engineering water-stress tolerance in plants, Trends Biotechnol. 14 (1996) 89 – 97.
[3] T. Takabe, T. Nakamura, M. Nomura, Y. Hayashi, M. Ishitani, Y. Muramoto, A. Tanaka, T. Takabe, Glycine-betaine and the genetic engineering of salinity tolerance in plants, in: K. Satoh, N. Murata (Eds.), Stress Re-sponses of Photosynthetic Organisms, Elsevier, Amster-dam, 1998, pp. 115 – 131.
[4] M.P. Aspe, G.S. Aharon, W.A. Snedden, E. Blumwald, Salt tolerance conferred by overexpression of a vacuolar Na+antiporter inArabidopsis, Science 285 (1999) 1256 –
1259.
[5] D.R. Gossett, E.P. Millhollon, M.C. Lucas, Antioxidant response to salt stress in salt-tolerant and salt-sensitive cultivars of cotton, Crop Sci. 34 (1994) 706 – 714. [6] J.A. Hernandez, E. Olmos, F.J. Corpas, F. Sevilla, L.A.
[7] C.B. Osmond, S.C. Grace, Perspectives on photoinhibi-tion and photorespiraphotoinhibi-tion in the field: quintessential inefficiencies of the light and dark reactions of photosyn-thesis, J. Exp. Bot. 46 (1995) 1351 – 1362.
[8] K. Asada, Production and action of active oxygen spe-cies in photosynthetic tissues, in: C.H. Foyer, P.M. Mullineaux (Eds.), Causes of Photooxidative Stress in Plants and Amelioration of Defense Systems, CRC Press, Boca Ratan, FL, 1994, pp. 77 – 104.
[9] E. Tel-Or, M.E. Hufleft, L. Packer, Hydroperoxidase metabolism in cyanobacteria, Arch. Biochem. Biophys. 246 (1986) 396 – 402.
[10] C. Miyake, F. Michihata, K. Asada, Scavenging of hydrogen peroxide in prokaryotic and eukaryotic algae: acquisition of ascorbate peroxidase during the evolution of cyanobacteria, Plant Cell Physiol. 32 (1991) 33 – 43. [11] M. Mutsuda, T. Ishikawa, T. Takeda, S. Shigeoka, The
catalase-peroxidase of Synechococcus sp. PCC 7942: purification, nucleotide sequence analysis and expression inEscherichia coli, Biochem. J. 316 (1996) 251 – 257. [12] M. Tichy, W. Vermaas, In vivo role of
catalase-perox-idase inSynechocystissp. strain PCC 6803, J. Bacteriol. 181 (1999) 1875 – 1882.
[13] T. Kaneko, S. Sato, H. Kotani, A. Tanaka, E. Asamizu, Y. Nakamura, N. Miyajima, M. Hirosawa, M. Sugiura, S. Sasamoto, T. Kimura, T. Hosouchi, A. Matsuno, A. Muraki, N. Nakazaki, K. Naruo, S. Okumura, S. Shimpo, C. Takeuchi, T. Wada, A. Watanabe, M. Ya-mada, M. Yasuda, S. Tabata, Sequence analysis of the genome of the unicellular cyanobacteriumSynechocystis
sp. strain PCC6803. II. Sequence determination of the entire genome and assignment of potential protein-cod-ing regions, DNA Res. 3 (1996) 109 – 136.
[14] P. Deshnium, D.A. Los, H. Hayashi, L. Mustardy, N. Murata, Transformation of Synechococcus with a gene for choline oxidase enhances tolerance to salt stress, Plant Mol. Biol. 29 (1995) 897 – 907.
[15] M. Nomura, M. Ishitani, T. Takabe, A.K. Rai, T. Takabe, Synechococcus sp. PCC7942 transformed with
Escherichia coli bet genes produces glycine betaine from choline and acquires resistance to salt stress, Plant Phys-iol. 107 (1995) 703 – 708.
[16] M. Nomura, T. Hibino, T. Takabe, T. Sugiyama, A. Yokota, H. Miyake, T. Takabe, Transgenically pro-duced glycine betaine protects ribulose 1,5-bisphosphate carboxylase/oxygenase from inactivation inSynechococ
-cussp. PCC7942 under salt stress, Plant Cell Physiol. 39 (1998) 425 – 432.
[17] T. Lamark, I. Kaasen, M.W. Eshoo, J. McDougall, A.P. Strom, DNA sequence and analysis of the bet genes encoding the osmoregulatory choline-glycine betaine pathway of Escherichia coli, Mol. Microbiol. 5 (1991) 1049 – 1064.
[18] I. Ossowski, M.R. Mulvey, P.A. Leco, A. Borys, P.C. Loewen, Nucleotide sequence of Escherichia coli katE, which encodes catalase HPII, J. Bacteriol. 173 (1991) 514 – 520.
[19] C.J. Kuhlemeier, G.A.V. Arkel, Host-vector systems for gene cloning in cyanobacteria, Methods Enzymol. 153 (1987) 199 – 243.
[20] N. Kaku, T. Hibino, Y. Tanaka, T. Takabe, T. Naka-mura, T. Takabe, Expression of nhaAv gene encoding Na+/H+antiporter fromVibrio alginolyticusin a
fresh-water cyanobacteriumSynechococcussp. PCC 7942 con-fer lithium tolerance, but not sodium tolerance, Plant Cell Physiol. 40 (1999) 557 – 564.
[21] S.P. Wolff, Ferrous ion oxidation in presence of ferric ion indicator xylenol orange for measurement of hy-droperoxides, Methods Enzymol. 233 (1994) 182 – 189. [22] M.V. Rao, G. Paliyath, D.P. Ormrod, D.P. Murr, B.
Watkins, Influence of salicylic acid on H2O2production,
oxidative stress and H2O2-metabolizing enzymes, Plant
Physiol. 115 (1997) 137 – 149.
[23] A. Claiborne, D.P. Malinowski, I. Fridovich, Purifica-tion and characterizaPurifica-tion of hydroperoxidase II of Es
-cherichia coliB, J. Biol. Chem. 254 (1979) 11664 – 11668.