www.elsevier.com / locate / livprodsci
Estimates of longevity and causes of culling and death in
Swedish warmblood and coldblood horses
a ,
*
a a b¨
Lena Wallin
, Erling Strandberg , Jan Philipsson , Goran Dalin
a
Department of Animal Breeding and Genetics, Swedish University of Agricultural Sciences, S-750 07 Uppsala, Sweden
b
Department of Anatomy and Histology, Swedish University of Agricultural Sciences, S-750 07 Uppsala, Sweden
Received 26 October 1998; received in revised form 6 May 1999; accepted 15 June 1999
Abstract
Data on several different horse populations were analysed and compared regarding length of life and diseases or injuries leading to death or culling. In order to include information for horses still alive, a failure time (survival) analysis was used. The first material included 1847 warmblood horses born between 1968 and 1982, that had participated in the Swedish Riding Horse Quality Test (RHQT) as 4-year-olds. The next two materials included 344 warmblood and 204 coldblood horses owned by the Swedish Cavalry Horse Foundation (CHF), born between 1970 and 1975. The last population consisted of 481 warmblood brood-mares born between 1965 and 1967. According to this study it was important to estimate the median length of life separately for each sex. For warmblood brood-mares and mares that had participated in the RHQT, comparable figures of 18.6 and 18.3 years were found. Close agreement was also found between geldings of the CHF and males that had participated in the RHQT; the estimates were 14.7 and 13.9 years, respectively. There was a positive trend in the median length of life over time for horses that had participated in the RHQT, and the median length-of-life curve increased more steeply for mares than for males. This study showed a longer median length of life for coldblood geldings, 17.6 years, than for the mares, 16.4 years. The most common causes of death of warmblood horses were diseases of the musculoskeletal system (56–57%), respiratory diseases (8–9%), diseases of the digestive system (5–6%) and accidents (3–9%). The primary causes of death of coldblood horses were temperamental disorders (23%), diseases of the musculoskeletal system (14%) and
hoof diseases (8%). 2000 Elsevier Science B.V. All rights reserved.
Keywords: Horses; Survival; Length of life; Culling; Death; Disease; Injury
1. Introduction tions of insurance statistics regarding length of life gave rise to a debate about equine longevity. An In recent years, claims have been made that the estimated average age of 7 to 8 years, based on lifespan of horses is shortening. Doubtful interpreta- insurance data, was incorrectly interpreted in the horse journals as expected lifespan for all horses in the population (JFB, 1986). However, estimates of
*Corresponding author. Tel.: 146-18-671955; fax:
146-18-average age at culling in the insurance data were
672648.
E-mail address: [email protected] (L. Wallin) calculated only from the ages of dead horses where
compensation had been granted. These estimates were never found (30%). Among those traced, the should not be confused with the average expected response frequency to the questionnaires was 78%. life span of all horses in the population, because of Ninety-nine horses had been exported and were not lack of information on horses still alive and on included in the study due to lack of information horses not compensated for at death. Such estimates about their health status. The number of horses would therefore most likely underestimate length of finally included in the study was 1847, 503 of whom
life (Ohlsson, 1990). were dead. The distribution between mares and
Survival analysis, a statistical technique that can males was fairly even (864 / 983). Of the males 74 use information on horses still alive, so-called cen- were stallions at the time of the test. Information sored data, is a more appropriate way to estimate the about the horses was available until 1990. Horse length of life of horses. More accurate estimates of owners were asked if particular horses were alive or length of life would bring better information to the dead and, if dead, to state the cause and year of debate about equine longevity. death. When analysing the questionnaires, no distinc-Reports summarising causes of death in sports tion was made between horses that died and those horses are rare. Many studies mention a specific that were put down, because death was considered to disease affecting horses and are often based on a be due to the causes mentioned in the questionnaires. relatively selected group of horses (Baker and Ellis, The date of birth ranged from 1968 to 1982 (Fig. 1981). Available statistics are based mostly on 1). The horses were usually 4 years old when they insurance data or veterinary clinical studies. Accord- participated in the test, the oldest horses in the ing to insurance statistics, diseases of the musculo- material could have reached an age of 22, whereas skeletal system are the predominant cause of death of horses born in 1982 could not have been more than 8 sports horses (Clausen et al., 1990; AGRIA, 1995; years old. When the test started in 1973, participation Heisele, 1995). Among ‘companion’ horses kept as a was limited because all horses were judged at only hobby, diseases of the digestive system are the most one location in Sweden. Later, more places became frequent cause of death (Baker and Ellis, 1981). available and interest in participating increased.
Other than insurance statistics, recent reports on The horses included in the study had been used for length of life and the most important causes of death different purposes — many of them for more than in horse populations are scarce. This emphasizes the one purpose (Table 1). Most horses (85%) had been need to find unselected materials in order to establish competing in different disciplines. It was quite appropriate benchmarks. The aims of this inves- common that horses competing at a novice level had tigation, therefore, were to estimate median length of results in several disciplines, whereas horses compet-life and to analyse and compare causes of death in ing at an advanced level had results only in one of different Swedish horse populations representative of the disciplines. An earlier study (Ohlsson and Philip-their breeds and normal use. sson, 1992) showed that horses with high scores in the test had competed more successfully than the others at advanced levels. Many brood-mares had 2. Materials competition results as well. It was not unusual that former competition horses were used as leisure 2.1. Swedish Riding Horse Quality Test data horses after their competition career was over. Few horses (4%) had been used in riding schools. RHQT Data were obtained via questionnaires sent to data were analysed by sex because mares had a value owners of Swedish warmblood horses that as 4-year- as breeding animals besides competition, which olds had participated in the Riding Horse Quality geldings did not.
Tests (RHQT) between 1973 and 1986. For a
description of the test, see Ohlsson and Philipsson 2.2. Swedish Cavalry Horse Foundation data (1992). Horses participating in the tests were found
Fig. 1. Questionnaire response: number of horses in Riding Horse Quality Test, distributed by birth year and sex.
Table 1 compared with 5% of the coldbloods. Information
Use of horses that participated in the Riding Horse Quality Tests about the horses was available up to 1989.
Area of activity Number Percentage
of horses 2.3. Swedish Warmblood brood-mare data
n51847
Competition 1563 85 A third population was included in the study, stud
Show jumping 1201 65 book mares of the Swedish Warmblood breed, in
Dressage 892 48
order to compare two groups of females of the same
Eventing 187 10
breed. All brood-mares born between 1965 and 1967
Driving 23 1
a
Breeding 521 28 and registered with a foal for the first time in the
Leisure riding 497 27 1971 stud book were included. The mares were then
Riding school 78 4 4–6 years old. It was important to find mares as
Miscellaneous 54 3
young as possible when they entered the stud book in
a
Twelve of 74 stallions were used for breeding. order to identify those that could have died early at
an age of just 4 years or over, thereby allowing a reasonable estimate of length of life. The last stud Swedish Cavalry Horse Foundation (CHF). Among book included information up to 1991. The study the warmblood horses, the cavalry had preferred included 481 brood-mares, 266 of whom were dead. buying geldings. Thus, their material included only There was no information on the causes of culling or 38 mares, whereas the distribution between sexes death in this material.
among the coldblood horses was more even: 115 RHQT horses represented in general sport horses geldings and 89 mares. Both groups of horses were while the last two populations represented riding born between 1970 and 1975. The CHF bought the school horses and brood-mares within the same horses as 3-year-olds. breed. Thus, possible differences in longevity and / or The cavalry in Sweden needed horses for various causes of death depending on population / area of purposes, but because many cavalry regiments had activity were covered in the study.
been disbanded and the need for the horses was concentrated to short periods during the year, horses
were loaned out after 1 year of training. Riding 3. Methods schools or private persons were able to hire the
brood-mare data. In addition to the probability times. In our data, however, failure time is measured density function (f(t)) and the cumulative density to the nearest year only. Therefore, there are several function (F(t)), in this type of analysis, two other horses having exactly the same length of life (so-functions are defined. If T is the failure time (length called ties). According to Kalbfleisch and Prentice of life) then the survivor function, S(t), is (1980), the above models do not deal well with data having many ties. Therefore, the following approxi-S(t)5P(T$t)512F(t) (0,t, 1 `) (1) mation was applied: all horses having a certain
non-censored failure time (e.g. 6 years) were given a The survivor function expresses the proportion of random deviation to this failure time. The deviation horses still alive at time t. The other function, the was sampled from a uniform distribution between hazard function, h(t), is 20.005 and 0.005. Therefore, instead of all horses having the failure time of for example 6 years, they
h(t)5f(t) / S(t) (2)
would range from 5.995 to 6.005. Horses being where h(t) is the probability of death at time t, given reported as dead in the same year as tested were survival up to time t. This is sometimes referred to as given only positive deviations (to avoid negative life
the relative risk of death. lengths).
The normal distribution is not good for describing The survival and median length of life was studied the probability density function for length of life, for usingPROC LIFEREG in SAS, 1989. This procedure of
at least two reasons. Firstly, a normal distribution generating random numbers was replicated 100 times would range from 2` to 1`, but survival times with different starting values for the random numbers cannot be negative. Secondly, life lengths are usually generator and the effect on the estimated parameters skewed to the right, i.e. there is a longer right tail of was studied. This procedure of randomly breaking the distribution than for the normal distribution. A the tied failure times was shown in a simulation to common distribution used is the Weibull distribution work very well. Failing to account for ties would (Kalbfleisch and Prentice, 1980), where the Weibull have resulted in an overestimation of the median survivor function, S(t), is length of life (Strandberg, 1997).
Of the total of 1847 horses participating in the p
S(t)5exph2(lt) j (3)
RHQT, 503 were reported dead and their length of life was known. For the remaining 1344 horses it The corresponding hazard function, h(t), is
was only known that they were alive at the end of
p21 data collection, viz. 1990. Because all horses
in-h(t)5lp (lt) (4)
cluded in this material had participated in the test, it where l and p are non-negative parameters. When was also known that they were at least 4 years old.
p51, the Weibull distribution becomes an exponen- Therefore, the measure of length of life studied was tial distribution with constant hazard throughout life. length of life after test, defined as year of death or When p.1, the hazard increases with increasing censoring, minus year of test. After the analysis, 4 length of life. The parameter l reflects the general years were added to the estimates of length of life level of risk of death, but a change inlis dependent after test in order to achieve length of life.
on the value of p. The survival of males and mares of the RHQT
To study the effect of various explanatory vari- data was studied using model (5) with sex as an ables on the length of life, such as effects of sex or explanatory variable. The trend in life length over year of birth, the model can be expanded to birth years was studied also using model (5) with birth-year group as the explanatory variable, but
h(t; z)5h (t) exp0 hz9bj (5)
analysed for each sex separately. The males and where h (t) is the baseline hazard from (4), z is the0 mares were divided into three different groups design vector for the explanatory variables, andb is according to year of birth. Standard errors of median the vector of these variables. length of life were averaged from the standard errors
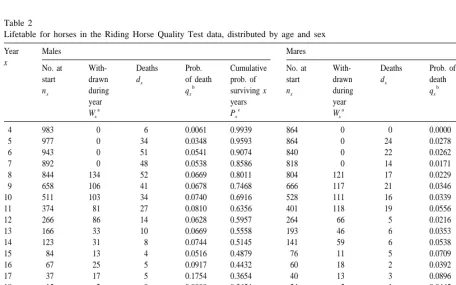
The survival of warmblood and coldblood horses Table 2. The probabilities of death for the males in the CHF data was studied using model (4) without were higher for almost all ages compared with the any explanatory variable, but analysed separately for mares. A slightly higher probability of death was each sex. The dependent variable was length of life, noted for the age group 11 years than for other ages defined as year of death or censoring, minus year of of the mares. Thus, the tendency was that mares birth. The same procedure was applied to the stud lived longer than males. The mares had a 14-years
book data of brood-mares. survival rate of 72% compared with 51% for the
Frequencies of diseases leading to death were males. 2
tested for sex differences by x -analysis using SAS, Among the CHF warmblood geldings few died
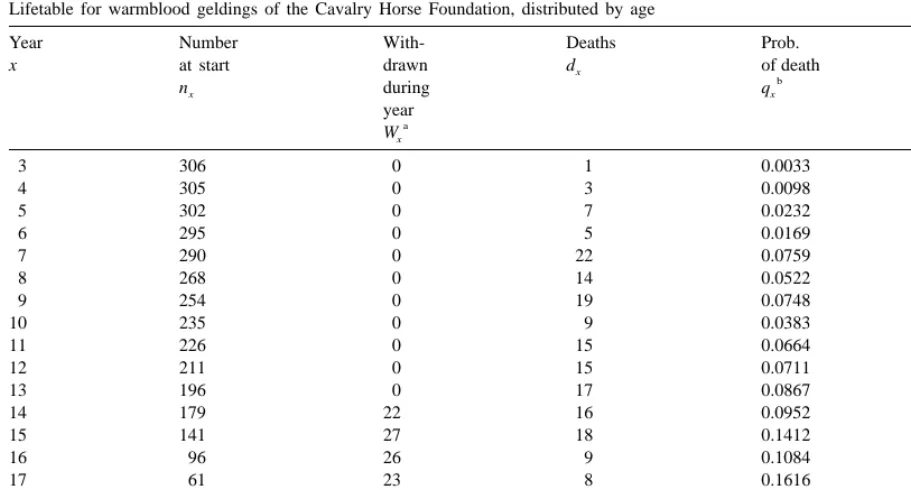
1989. before the age of 7, Table 3. Higher probabilities of
death were seen in the age groups 7 to 9 years for geldings. The 14-years survival rate was 53%. It was 4. Results difficult to interpret the figures on numbers of dead mares because there were so few mares in the study.
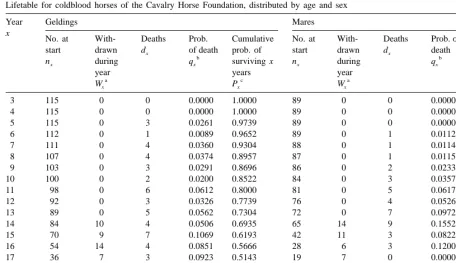
4.1. Probability of death No geldings among the coldblood horses had died
at the age of 3 and 4 years, and no mares before the The number of dead horses in the RHQT data age of 6, Table 4. Few mares had died before the age study was 503 and the distribution between sexes of 9. The probability of death was rather low before showed more dead males than mares (339 / 164), the age of 11 for both sexes. At the age of 14
Table 2
Lifetable for horses in the Riding Horse Quality Test data, distributed by age and sex
Year Males Mares
x
No. at With- Deaths Prob. Cumulative No. at With- Deaths Prob. of Cumulative start drawn dx of death prob. of start drawn dx death prob. of
b b
5 977 0 34 0.0348 0.9593 864 0 24 0.0278 0.9722
6 943 0 51 0.0541 0.9074 840 0 22 0.0262 0.9468
7 892 0 48 0.0538 0.8586 818 0 14 0.0171 0.9306
8 844 134 52 0.0669 0.8011 804 121 17 0.0229 0.9093
9 658 106 41 0.0678 0.7468 666 117 21 0.0346 0.8778
10 511 103 34 0.0740 0.6916 528 111 16 0.0339 0.8481
11 374 81 27 0.0810 0.6356 401 118 19 0.0556 0.8010
12 266 86 14 0.0628 0.5957 264 66 5 0.0216 0.7837
13 166 33 10 0.0669 0.5558 193 46 6 0.0353 0.7560
14 123 31 8 0.0744 0.5145 141 59 6 0.0538 0.7153
Table 3
Lifetable for warmblood geldings of the Cavalry Horse Foundation, distributed by age
Year Number With- Deaths Prob. Cumulative
geldings had a survival rate of 69% and the mares group was introduced as an explanatory variable in
62%. the model. The estimated median length of life for
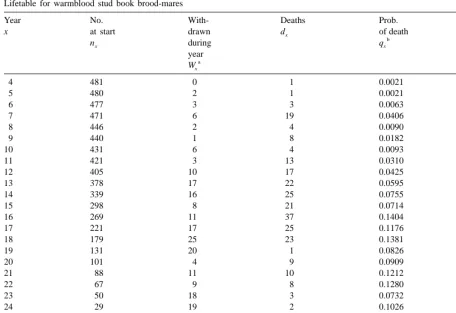
Table 5 shows that rather few warmblood brood- both sexes born in the second and third birth-year mares died before the age of 10 years, although a groups (1976–1979 and 1980–1982, respectively) slightly higher probability of death was seen at the were significantly longer (P,0.05) than for those age of 7. The number of dead mares increased from born in the first group (1968–1975).
the age of 11, with a critical age at 16 where the For warmblood brood-mares and mares that par-probability of death was rather high. ticipated in the RHQT and born between 1968 and 1975, comparable figures of 18.6 and 18.3 years
4.2. Length of life were found. Close agreement was also found
be-tween geldings of the CHF and males that had The results from the survival analyses of all three participated in the RHQT and that were born be-datasets are reported in Table 6. The median length tween 1968 and 1975; the estimates were 14.7 and of life is given for each group of horses, by sex. 13.9 years, respectively.
Average standard errors are given from the replicated There was a significant difference (P,0.05) in
analyses conducted. length of life between coldblood geldings and mares
Table 4
Lifetable for coldblood horses of the Cavalry Horse Foundation, distributed by age and sex
Year Geldings Mares
x
No. at With- Deaths Prob. Cumulative No. at With- Deaths Prob. of Cumulative start drawn dx of death prob. of start drawn dx death prob. of
b b
Accumulated percentages of dead horses for the comprised about the same proportion (9%) of the three birth-year groups in the RHQT data are shown dead horses.
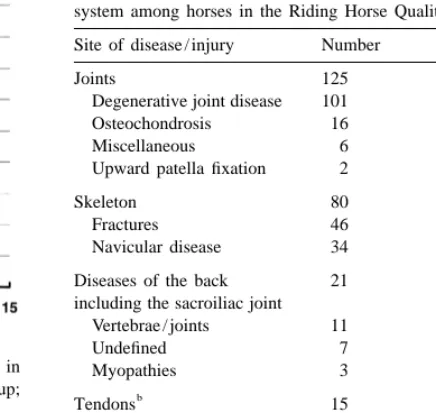
in Fig. 2. Horses in the three groups were able to Table 8 shows different diseases within the pre-reach the age of 15, 11 and 8 years, respectively. The dominant group, the musculoskeletal system. Dis-curves show a positive trend in accumulated per- eases of the joints were associated with 45% of all centages of dead horses for the three age groups. deaths in this group and degenerative joint disease According to the curves, horses born between 1980 was the most frequent within that. Fewer than 6% of and 1982 had a longer expected lifespan than had the the horses in this group were diagnosed as having
other two groups. osteochondrosis. As regards other skeleton problems,
Table 5
Estimated median length of life (years) and standard errors (SE) according to survival analyses of the different horse populations
Horse category Birth year Males Mares Difference
mares–males
Number Length Number Length
of life of life
a
Riding horse quality 1968–1975 176 13.960.8 116 18.361.4 4.4
a
Tested warmblood 1976–1979 370 15.360.8 366 22.061.9 6.7
a
horses 1980–1982 437 16.061.1 382 26.563.8 10.5
a
Total 1968–1982 983 14.760.5 864 22.261.2 7.5
Cavalry horses
Warmblood 1970–1975 306 14.760.4
b
Coldblood 1970–1975 115 17.660.8 89 16.460.6 21.2
Warmblood stud 1965–1967 481 18.660.4
book mares
a
Significance tests between mares and males: P,0.001. b
Table 8
Numbers of deaths attributed to diseases of the musculoskeletal system among horses in the Riding Horse Quality Test data
a Site of disease / injury Number Percentage
Joints 125 44.8
Fig. 2. Accumulated percentages of dead horses of both sexes in Myopathies 3 1.1 the Riding Horse Quality Test, distributed by birth-year group; b
Tendons 15 5.4
1968–1975 (-j-), 1976–1979 (-m-), 1980–1982 (-d-).
Undefined lameness 38 13.6
Total 279 100.0
Almost all horses (42 of 45) included in the
a
Percent of horses whose death was attributable due to diseases
category diseases of the respiratory system had been
of the musculoskeletal system.
culled because of chronic obstructive pulmonary b
The cause was tendinitis in all cases.
disease. Diseases of the digestive system were dominated by gastrointestinal displacement (22 of
28). wobbler syndrome and temperamental disorders (10
Diseases of the nervous system constituted a and 5 of 27, respectively).
significantly greater problem for geldings than for Of the horses put down because of hoof problems mares, the main causes being as different as the 12 of 23 were culled because of laminitis. Other
Table 7
Causes of death of horses in the Riding Horse Quality Test data, distributed by sex
Cause of death Number Percentage
Total Males Mares Total Males Mares
a
Musculoskeletal system 279 204 75 55.5 60.1 45.7
Accidents 46 27 19 9.1 8.0 11.6
Respiratory system 45 29 16 8.9 8.6 9.8
Digestive system 28 16 12 5.6 4.7 7.3
b
Nervous system 27 21 6 5.4 6.2 3.6
Hoof 23 15 8 4.6 4.4 4.9
Circulatory system 13 5 8 2.6 1.5 4.9
Tumours 7 7 0 1.4 2.1 0.0
Reproductive tract 7 0 7 1.4 0.0 4.3
Urinary system 2 2 0 0.4 0.6 0.0
Infectious diseases 1 1 0 0.2 0.3 0.0
Miscellaneous 4 0 4 0.8 0.0 2.4
Unknown 21 12 9 4.2 3.5 5.5
Total 503 339 164 100.0 100.0 100.0
a
Significance tests between sexes: P,0.001. b
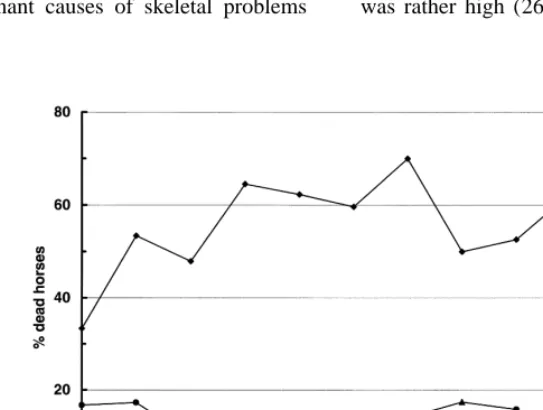
causes were ossification of collateral cartilages of the were navicular disease and fractures. Chronic ob-distal phalanx (sidebones) (5) and pedal osteitis (3). structive pulmonary disease was the cause of culling Among diseases of the circulatory system, 9 of 13 of all horses in the second largest group (Table 9). horses died of cardiac disorders (acute / chronic). Diseases of the digestive system were dominated by The proportions of dead horses in the three most colic of an undefined nature (seven of ten). As frequent groups of diseases causing death, distributed regards hoof diseases, most horses were culled according to age, are shown in Fig. 3. Musculoskele- because of laminitis (four of seven). Causes of death tal problems constituted a relatively more common due to diseases of the nervous system were divided cause of death in the age range 7 to 10 years than at between temperamental disorders and wobbler younger and older ages. Young horses were more syndrome (three and two of six, respectively). often the victim of accidents than of diseases of the Lymphangitis caused the death of four of five horses respiratory system. The latter category showed an among those with diseases of the circulatory system. increasing incidence with age. The figures at the ages Unfortunately, 14% of the dead horses did not have of 4 years and 12–14 years are, however, based on any documented cause of death.
small numbers of horses and must be interpreted Among the coldblood horses, temperamental
dis-with caution. orders were the most common cause of culling (20
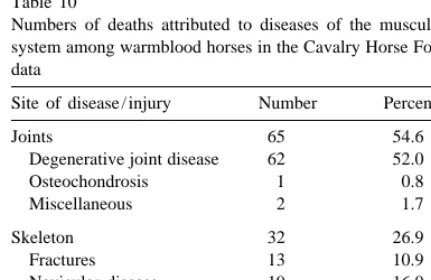
of 22). Diseases of the musculoskeletal system 4.3.2. Swedish Cavalry Horse Foundation data constituted a large group too, undefined lameness Diseases of the musculoskeletal system were the being the most frequent cause of culling. The third cause of most deaths among warmblood horses, and group concerned hoof diseases, where sidebones and the primary cause of culling for both sexes, Table 9. laminitis were the cause of culling for four and three Table 10 shows that 55% of the dead horses had horses of eight, respectively. The number of un-joint diseases, practically all being degenerative un-joint known causes of death among the coldblood horses disease. The dominant causes of skeletal problems was rather high (26).
Table 9
Causes of death among warmblood and coldblood horses in the Cavalry Horse Foundation data for geldings (G) and mares (M)
Cause of death Warmblood Coldblood
Total number Number Total number Number
n % G M n % G M
Musculoskeletal system 119 57.2 107 12 13 13.4 6 7
Respiratory system 17 8.2 15 2 2 2.1 0 2
Total 208 100.0 185 23 97 100.0 54 43
Table 10 be explained by the fact that mares have a value as
Numbers of deaths attributed to diseases of the musculoskeletal breeding animals besides riding and competition, system among warmblood horses in the Cavalry Horse Foundation
which geldings do not. It was shown in the study,
data
that a large proportion of the mares that participated
a Site of disease / injury Number Percentage
in the RHQT also were used for breeding.
Joints 65 54.6 The brood-mares born between 1965 and 1967
Degenerative joint disease 62 52.0 were included in this study for the purpose of
Osteochondrosis 1 0.8
understanding more about length of life in mares.
Miscellaneous 2 1.7
This group was expected to live many years because
Skeleton 32 26.9
of minimum physical stress, compared with riding
Fractures 13 10.9
and competition horses. It was therefore interesting
Navicular disease 19 16.0
to see that mares, that participated in the RHQT and
b
Tendons 2 1.7
were born between 1968 and 1975, and used for
Undefined lameness 20 16.8 riding as well as breeding, had the same median
Total 119 100.0 length of life as brood-mares (18.3 and 18.6 years,
a respectively, Table 6).
Percent of horses whose death was attributable due to diseases
There was also close agreement in the median
of the musculoskeletal system. b
The cause was tendinitis in all cases. length of life between the warmblood geldings born between 1970 and 1975 from the CHF, and males that participated in the RHQT and that were born 5. Discussion between 1968 and 1975. The estimates were 14.7
and 13.9 years, respectively (Table 6).
estimates from the survival analyses were 14.7 and veterinary examination of the horses, which gives 18.6, respectively, with a SE of 0.4 (Table 6). In the guidelines for the continued training of young CHF data, all horses could have lived to 14 years, horses. In the early years of the RHOT many i.e. almost to the median length of life. Therefore, problems related to training were found in horses, estimates of median length of life, ignoring or taking while such problems most likely have become less account of censoring, were almost identical. For the frequent in later years (Darenius, 1998).
brood-mare data, however, there was censoring from This study also showed that coldblood geldings an early age, which led to a larger difference from the CHF had 3 years longer median length of between the two estimates. The conclusion is that life than warmblood geldings. The longer median even when more than half of the animals have died, length of life may be attributed to the area of use, as it seems advantageous to use survival analysis if the most of the them were draught horses. The
differ-data are censored. ence between coldblood geldings and mares was
Apart from the difference between sexes, there small, but the material was limited in size. Un-was also a difference between time periods of birth fortunately, there was no information available on in the RHQT data. The positive trend in length of whether or not the coldblood mares had been used life over time seen in Fig. 2 was confirmed by the for breeding.
results from the survival analyses when a birth-year Comparable figures from the literature are rare, group was introduced into the model as an explanat- and particularly on estimated average life time not ory variable (Table 6). The estimated median length based on insurance data. Comfort (1958, 1959, 1962) of life for mares and males born in the second and used very old data drawn from consecutive periods third birth-year groups were statistically significantly (1860–1921) of the General Stud Book. He esti-longer than for those born in the first group (Table mated the mean expectation of further life to 17.2 6). The increasing number of horses censored due to years for all 4-year-old thoroughbred mares (1958) the shorter time from birth to censoring time might and 19.5 years for stallions (1959). The median life have influenced the longer estimated median length times were estimated to 22.1 and 22.2 years, for the of life in the last two birth-year groups. It should be mares born 1860–1864 and 1875–1880, respectively. noted that the estimates for the two groups showed Comfort (1962) also studied data on Arabian stud standard errors which increased in inverse proportion book mares and found the expectation of further life to the number of animals with a failure time. The at 4 years to be 18.8 years. A study by Langlois latter should therefore be the dominant part of the (1976) included data of the French stud book, where data for achieving reliable estimates. the average age at death or culling for thoroughbred The procedure to account for tied failure times mares and stallions were 14.4 and 16.3 years, seemed to work satisfactorily. The median length of respectively. Thus, these studies comprising two very life for mares (RHQT) was for example on the different time periods gave clearly different results. average 22.2 years for the 100 replicates with a SD The much lower values found in recent materials of 0.4. The average had a SE of 0.04 which is much may be due to quite different demands on both the smaller than the SE of each estimate from PROC sport and the breeding stock resulting in a higher LIFEREG (1.2). Therefore, the introduction of random turnover rate of the mares and stallions selected for
noise was almost totally obliterated by the 100 breeding than previously.
replicates and only the average standard error from Clausen et al. (1990) and Heisele (1995) were
PROC LIFEREG was used when comparing various both using insurance data, and the estimated average
estimates. ages for dead horses were 10.1 and 12.2 years,
There have been changes over time that may have respectively. The Swedish insurance company influenced the length of life in horses. When training AGRIA (Ohlsson, 1990) showed an increase in the courses became available for owners and their horses average age of dead horses from 8.7 to 10.8 years
¨
Gutekunst (1977) and found that the average age at of death in a relatively unselected group of dead death had increased from 9.0 to 10.3 between 1971– horses, mainly of the companion type. In their study, 1974 and 1982 for riding horses. It is interesting to only 16% of the horses were culled due to locomotor see that there is a positive trend also for the average disorders. Swedish insurance statistics from AGRIA age for insured dead horses. However, that could (1995) showed that 54% of dead horses were culled equally well reflect changes in insurance policy. One due to diseases of the musculoskeletal system. basic problem when studying insurance data is that Statistics from AGRIA included all breeds.
few reports include the initial age when horses were Diseases of the respiratory and digestive systems insured (Heisele, 1995). Lindner and Offeney (1992) also caused death and culling of many horses (Tables also reported that only a small proportion of horses 7 and 9). Again, there was close agreement between were insured, compared with the total horse popula- the two warmblood groups, 9 and 8%, respectively tion in Germany. The difference between breeds is and 6 and 5%, respectively. In the studies by Clausen also difficult to interpret because of the mixture of et al. (1990) and Heisele (1995) as many as 16–17% breeds in most insurance studies. Insurance policies of the horses had died from diseases of the respirato-that differ between companies and years are also ry system. In both these studies, 10% of the horses difficult to consider. It is important that estimates died from diseases of the digestive system, about from insurance data are interpreted as an average age twice as many as in the present study. Among horses for dead horses, compensated through their insurance of the companion type, the proportion of horses policies and not confused with the estimated median dying of respiratory diseases (9%) agreed closely length of life of a given horse population as in this with warmbloods in the present study, but as many
study. as 33% had died of digestive diseases, which was the
Length of life as estimated in this study is a useful predominant cause of death in the study by Baker measure contributing to the understanding of the and Ellis (1981). Hommerich, 1995 found a variation state of health in horses. Ricard and Fournet-Hanocq of 7–18% between 1984 and 1994 for diseases of the (1997) used number of years in competition as an respiratory system and 11–18% for diseases of the indirect indicator of longevity for jumping horses. digestive system. Diseases of the digestive and Due to the lack of data for analysing causes of death, respiratory systems were also two large pathological Ricard and Chapuis (1997) suggested that extremely groups (9 and 7%, respectively) responsible for the low predicted sire breeding values for longevity in death of many horses, according to the statistics from sports may reveal a specific pathology. Therefore, AGRIA (1995), but hoof diseases caused even more these sires and their offspring should be studied in (10%) deaths. The differences between studies illus-more detail. Longevity studies are important if trate the difficulty of making comparisons when the soundness is to be considered in breeding goals and distribution of the diseases by breed is not clearly greater effort must be made to find indicators of defined.
longevity in order to ascertain an improvement. Among warmblood horses, few died or were Comparison of the two warmblood horse popula- culled due to diseases of the circulatory system and tions included in this study revealed that the pre- tumours, and none among the coldbloods. A differ-dominant causes of culling in both populations were ence between the two groups of warmblood horses diseases of the musculoskeletal system, in which the was noted regarding accidents. In the RHQT data, proportions of deaths, 56 and 57%, were very accidents (9%) formed the second largest cause of similar. In both studies, diseases of the joints and death, whereas in the CHF data only 2% of the skeleton were a major cause, representing 73–82% horses died as a result of accidents. These differ-of all causes differ-of culling in the musculoskeletal disease ences may reflect variations in management stan-group. According to studies based on insurance data, dards among the RHQT horse owners.
Diseases of the nervous system were also quite lished diagnosis of identified horses with their pedi-common (16%) among horses in the study by Baker grees, which is necessary for reliable genetic analysis and Ellis (1981). The proportions of coldblood and and selection decisions.
warmblood horses that died from diseases of the When we know more about the diseases that are digestive system were almost identical (about 6%), the cause of most deaths in horses, efforts must be whereas few (2%) coldblood horses were affected by made to apply this knowledge to alleviate and diseases of the respiratory system. A difference hopefully diminish the problems. It is important to between coldblood and warmblood horses was also make improvements in the management and training found regarding hoof diseases, where 8% of of horses and also to make genetic selection more coldbloods were culled compared with 3% of the effective. However, for most diseases the mode of
warmbloods. inheritance for those with an anticipated genetic
Apparently, there are differences between reasons background needs to be more thoroughly investi-for culling and death investi-for different horse breeds and gated, as well as other factors that influence the horse categories. This was evident both in this study development of the diseases.
and in the literature (Baker and Ellis, 1981; Clausen et al., 1990; Heisele, 1995; Hommerich, 1995).
Differences were found between riding sports horses 6. Conclusions and leisure horses and between warmblood and
coldblood horses. In future, statistics regarding Estimated length of life in normal horse popula-reasons for culling and causes of death should tions was more than twice that in previously pub-therefore be presented for the specific breeds or lished insurance statistics in Sweden. Insurance horse categories, as it is of great interest to relate the statistics are unsuitable for studies on equine diseases to the purpose and use of the horses. longevity, but can provide valuable information on There is a need for more systematic recording of the distribution of major diseases and injuries re-diseases diagnosed at veterinary clinics and an sulting in culling and death of horses. There was a integration of data from different clinics and from sex-related difference in length of life of sports other sources, such as insurance companies. Such horses, in favour of mares. Apparently these have an records are necessary in order to perform epi- additional value as breeding animals. There was a demiological studies on various diseases and injuries. time trend towards an increased length of life for They would also constitute a valuable basis for both sexes of the warmblood breed; the median genetic studies and selection decisions. A combina- length of life was increasing faster for mares than for tion of veterinary clinic records and insurance statis- geldings.
tics would probably be appropriate data for analysis The predominant causes of death of warmblood and monitoring of the soundness of sports horses in horses were diseases and injuries of the musculoskel-the future, as long as it is possible to divide musculoskel-the etal system, whereas temperamental failures pre-materials according to breed and relate the number of dominated among coldblood horses. The focus for cases reported to a base population including all improvement and further research should be on horses of the category in question. It is obvious from diseases and injuries of the musculoskeletal, respira-the results of this study that insurance statistics alone tory and digestive systems, as these account for 70% are not particularly useful for estimating equine of all deaths among warmblood horses. There is a
longevity. difference in length of life and causes of death
In many cases, it is important to ascertain the between breeds and horse categories, depending on prevalence of a certain disease in a particular breed. the intended use.
¨
sversicherung unter berucksichtigung der tierartlichen
Mitwir-breeding associations. Epidemiological studies on
kung in der Pferdelebensversicherung. Thesis, University of
various diseases and injuries is a necessary basis for
¨ ¨
Munchen. Munchen, Germany.
genetic analyses and selection decisions. Hommerich, G., 1995. Ausfallursachen und-frequenzen laut
Schadensstatistik der Vereinigte Tierversicherung Gesellschaft ¨
a.G. Gottinger Pferdetage, 85–93.
JFB, 1986. Utslagningsstatistik (Insurance statistics of causes of
Acknowledgements
¨ ¨
death). Mimeo 8 pp. Jordbrukets Forsakringsbolag, Stockholm, Sweden.
This study received financial support from the
Kalbfleisch, J.D., Prentice, R.L., 1980. The Statistical Analysis of
Swedish insurance company AGRIA. We thank the Failure Time Data, Wiley, New York.
horse owners who answered the questionnaires and Koning, B., 1983. Vergleichende Untersuchungen uber das Alter,¨ ¨ made it possible for us to undertake this study. The die Versicherungsdauer und die Abgangsursachen versicherter Pferde bei Eintritt des Schadenfalls auf der Grundlage von
Swedish Cavalry Horse Foundation and the Swedish
Schadenstatistiken verschiedener Versicherungen und Jahre.
Warmblood Association are also gratefully
acknowl-Ph.D. Thesis, University of Giessen, Germany.
edged for providing materials for the study.
` ´
Langlois, B., 1976. Estimation de quelques parametres demog-´ demog-´ ´ raphiques du Pur Sang anglais en France. Ann. Genet. Sel. Anim. 8, 315–329.
References Lindner, A., Offeney, F., 1992. Einsatzdauer, Abgangsraten und ¨
-ursachen bei Sportpferden. Dtsch. Tierarztl. Wsch 99 (1), 39–42.
˚
AGRIA, 1995. 90-94-Femarsskrift, AGRIA, Stockholm
(Insur-¨ Ohlsson, L., 1990. Utslagningsorsaker och medellivslangd hos ance Statistics 1990–1994).
¨
varm- och kallblodshastar (causes of death and length of life in Baker, J.R., Ellis, C.E., 1981. A survey of post mortem findings in
¨ ¨ warmblood and coldblood horses). AGRIA-forsakringar. 480 horses 1958 to 1980: (1) Causes of death. Equine Vet. J.
¨ ¨ ˚ ¨ ¨
Forsakringsstatistik fran Jordbrukets Forsakringsbolag 1985– 13, 43–46.
¨ ¨
1989, Agria Forsakringar 1988–1989, 18–25. Clausen, M., Preisinger, R., Kalm, E., 1990. Analyse von
Kran-Ohlsson, L., Philipsson, J., 1992. Relationship between field test kenheitsdaten in der deutschen Warmblutzucht.
for warmblood horses as four-year-olds and later competition ¨
Zuchtungskunde 62, 167–178.
performance. In: 43rd Ann. Meet. EAAP, Madrid, 14–17 Sept. Comfort, A., 1958. The longevity and mortality of thoroughbred
Ricard, A., Chapuis, H., 1997. Genetic correlation between mares. J. Gerontol. 13, 342–350.
longevity and performance for jumping horses. In: 48th Ann. Comfort, A., 1959. The longevity and mortality of thoroughbred
stallions. J. Gerontol. 14, 9–10. Meet. EAAP, Vienna, 25–28 Aug.
Comfort, A., 1962. A life table for Arabian mares. J. Gerontol. 17, Ricard, A., Fournet-Hanocq, F., 1997. Analysis of factors
affect-14. ing length of competitive life of jumping horses. Genet. Sel.
Darenius, A., Personal communication (1998). Evol. 29, 251–267.
Gutekunst, H.P., 1977, Zur Schadenursachenstatistik von en- SAS Institute, 1989. SAS User’s Guide: Statistics, 1982 ed. SAS ¨
tschadigten Reitpferden in der Jahren 1971 bis 1974 innerhalb Institute, Cary, NC, p. 584.
der Bundesrepublik Deutschland einschliesslish West-Berlin. Strandberg, E. 1997. A method to account for tied failure times. Ph.D. Thesis, University of Giessen, Germany. Mimeo. Swedish Univ. of Agri. Sci., Department of Animal
¨