This art icle was dow nloaded by: [ Universit as Dian Nuswant oro] , [ Ririh Dian Prat iw i SE Msi] On: 29 Sept em ber 2013, At : 20: 11
Publisher: Rout ledge
I nform a Lt d Regist ered in England and Wales Regist ered Num ber: 1072954 Regist ered office: Mort im er House, 37- 41 Mort im er St reet , London W1T 3JH, UK
Accounting and Business Research
Publicat ion det ails, including inst ruct ions f or aut hors and subscript ion inf ormat ion: ht t p: / / www. t andf online. com/ loi/ rabr20
Earnings quality in ex
‐
post failed firms
Juan Manuel García Lara a , Beat riz García Osma b & Evi Neophyt ou c
a
Universidad Carlos III de Madrid
b
Depart ament o Cont abilidad, Universidad Aut ónoma de Madrid, Avda. Fco Tomas y Valient e 5, Madrid, 28049, Spain Phone: +34 91497 2970 E-mail:
c
At hens Universit y of Economics and Business Published online: 04 Jan 2011.
To cite this article: Juan Manuel García Lara , Beat riz García Osma & Evi Neophyt ou (2009) Earnings qualit y in ex‐post f ailed f irms, Account ing and Business Research, 39: 2, 119-138, DOI: 10. 1080/ 00014788. 2009. 9663353
To link to this article: ht t p: / / dx. doi. org/ 10. 1080/ 00014788. 2009. 9663353
PLEASE SCROLL DOWN FOR ARTI CLE
Taylor & Francis m akes every effort t o ensure t he accuracy of all t he inform at ion ( t he “ Cont ent ” ) cont ained in t he publicat ions on our plat form . How ever, Taylor & Francis, our agent s, and our licensors m ake no
represent at ions or warrant ies w hat soever as t o t he accuracy, com plet eness, or suit abilit y for any purpose of t he Cont ent . Any opinions and view s expressed in t his publicat ion are t he opinions and view s of t he aut hors, and are not t he view s of or endorsed by Taylor & Francis. The accuracy of t he Cont ent should not be relied upon and should be independent ly verified w it h prim ary sources of inform at ion. Taylor and Francis shall not be liable for any losses, act ions, claim s, proceedings, dem ands, cost s, expenses, dam ages, and ot her liabilit ies w hat soever or how soever caused arising direct ly or indirect ly in connect ion w it h, in relat ion t o or arising out of t he use of t he Cont ent .
This art icle m ay be used for research, t eaching, and privat e st udy purposes. Any subst ant ial or syst em at ic reproduct ion, redist ribut ion, reselling, loan, sub- licensing, syst em at ic supply, or dist ribut ion in any
1. Introduction
We analyse earnings quality for a large sample of UK failed firms in the four years before failure (from year t-4 to year t, where tis the year of firm failure). While there is extensive research analysing the quality of accounting numbers in financially troubled firms, empirical evidence on the earnings behaviour of ex-post bankrupt (failed) firms in the years leading up to bankruptcy is scarce. Prior research has focused exclusively on accounting manipulation either in the year imme-diately prior to failure (Smith et al., 2001) or aggregating information from the years before failure (Rosner, 2003). These studies do not con-sider how manipulation evolves as failure ap-proaches, and report only descriptive evidence of real activities manipulation. In addition, they fail to provide evidence on the consequences that managerial manipulation has over the reliability or usefulness of earnings.1
We argue that in the presence of deteriorating
firm performance: (1) managers of ex-post failed firms manipulate both accruals and real activities to conceal poor performance in the years preced-ing failure; however, (2) as failure approaches, and when the opportunities for further accrual manipu-lation are exhausted, it is anticipated that prior manipulation will reverse into large negative accruals. Hence, prior studies in this area that aggregate data from the final years prior to bankruptcy or analyse only the year before failure, potentially provide confounding evidence on earnings quality patterns in ex-post failed firms. Generally, we expect that managers prefer the manipulation of accruals over the manipulation of real activities, as the latter is more costly. Consequently, (3) managers are likely to resort to the manipulation of real activities only when there is limited scope left for accrual manipulation. Finally, we argue that (4) the manipulation of both accruals and real activities has severe consequences on the reliability of earnings for decision-making. We expect that managerial manipulation reduces the reliability of accounting numbers, leading to reduced conditional conservatism. Therefore, we explore and provide new evidence on three important aspects that have not been analysed in detail by prior work, namely managerial use of accounting and real activities manipulation to hide poor performance, how manipulation evolves as failure looms closer and the opportunities for successfully postponing bankruptcy diminish,
Earnings quality in ex-post failed firms
Juan Manuel García Lara, Beatriz García Osma and Evi Neophytou*
Abstract—This paper analyses earnings quality in ex-post failed firms. Using a large sample of UK bankrupt firms, we find that failed firms manage earnings upwards in the four years prior to failure. This manipulation is achieved in two ways: (1) through accounting (accruals) manipulation; and (2) by implementing real operating actions that deviate from normal practice. We show that these two types of manipulation lead to reduced earnings reliability. We use conditional conservatism as a proxy for reliability, as prior literature links conditional accounting conser-vatism to better governance and positive economic outcomes. Our results show that conditional conserconser-vatism decreases substantially in the years prior to failure. Finally, we show that accruals manipulation is more pronounced in ex-post bankrupt firms with low ex-ante probability of failure, and that ex-post bankrupt firms with high ex-ante failure probability, having likely exhausted the opportunities for accrual manipulation, manipulate real operations more aggressively.
Keywords: firm failure, accruals management, real earnings management, conditional conservatism. earnings quality, bankruptcy
*Juan Manuel García Lara is at Universidad Carlos III de Madrid, Beatriz García Osma is at Universidad Autónoma de Madrid and Evi Neophytou is at Athens University of Economics and Business.
The authors are grateful to Pauline Weetman (the editor), Peter F. Pope, Steve Young and two anonymous reviewers for their helpful comments and suggestions. The paper has bene-fited from presentations at the 2006 EAA annual conference and at the 1st International Conference in Accounting and Finance at the University of Macedonia, Thessaloniki. We acknowledge financial contribution from the European Commission INTACCT Research Training Network (MRTN-CT-2006-035850), and the Spanish Ministry of Science and Innovation (ECO2008-0638/ECON and SEJ2007-67582/ECON and SEJ2005-08644/ECO).
Correspondence should be sent to Beatriz García Osma, Universidad Autónoma de Madrid, Departamento Contabilidad, Avda. Fco Tomas y Valiente 5, Madrid 28049 (Spain). Tel. +34 91497 2970. E-mail: beatriz.garcia@uam.es.
This paper was accepted for publication in December 2008.
1To be consistent with international literature, we use the term ‘bankruptcy’ to refer to firm failure. However, in the UK this term is only appropriate for individuals. According to the UK Insolvency Act 1986, the correct term to use for companies is insolvency (see www.insolvency.gov.uk). We use ‘failure’, ‘insolvency’ and ‘bankruptcy’ interchangeably throughout the paper.
and the consequences of this manipulation on the reliability of earnings.
Furthering our understanding of these three is-sues is crucial for: (1) the adequate development of new accounting standards and corporate gover-nance regulations aimed at tackling opportunistic managerial behaviour in financially troubled firms; as well as (2) the improvement of bankrupt-cy prediction models, by explicitly taking into account managerial attempts to hide poor perform-ance. It is commonly accepted that investors can predict bankruptcy fairly accurately using predic-tion models. However, these models are based to a great extent on accounting data that can be manip-ulated by management (Ohlson, 1980). We show that managers make both accounting and operating decisions that affect the reliability of accounting numbers, and how these decisions accumulate and reverse in the year prior to bankruptcy. This evi-dence is potentially important in designing bank-ruptcy prediction models that may be able to account for the observations reported in this paper. Finally, we provide limited evidence (3) that man-agers manipulate real decisions to postpone bank-ruptcy. This evidence raises awareness of sub-optimal decision making that may be particu-larly relevant for debt holders and claimants. Sub-optimal operating, financing or investment decision-making may deplete the firm of some of its assets or, at the very least, reduce their liquida-tion value. The evidence on real acliquida-tions is of inter-est to those directly involved in the liquidation process of the company, in terms of timing the de-cision on when to initiate a winding-up petition, or to best estimate the liquidation value of the firm prior to bankruptcy.
Using a large sample of continuing and failed UK firms from 1995 to 2004, we find that ex-post failed firms engage in both accounting manipula-tion and real activities manipulamanipula-tion in the four years prior to failure. This is consistent with the evidence in Beaver (1966) that the properties of accounting numbers between failing and continu-ing firms differ in the five years prior to the failure event. As bankruptcy approaches, the manipula-tion unravels and we observe large negative accru-als in the year just before failure. We analyse the existence of accounting and real activities manip-ulation using discretionary accruals models (Jones, 1991; Dechow et al. 1995; Kasznik, 1999) and the abnormal cash flow model proposed by Dechow et al. (1998) as implemented by Roychowdhury (2006). Our results provide evidence consistent with the existence of managerial preferences and trade-offs in selecting earnings management in-struments as suggested – but untested – by prior research (e.g. Peasnell et al., 2000). We show that firms with a higher probability of bankruptcy, like-ly having exhausted their opportunities for
suc-cessful accounting manipulation, engage in the manipulation of real activities. Our sample of failed firms provides a good setting for a test of real earnings management, because even if real manipulation implies higher costs, bankruptcy is certainly more costly. Finally, our results are con-sistent with managers successfully concealing poor performance through accounting manipula-tion, as we find that accruals manipulation is more pronounced in post failed firms with low ex-ante failure probability.
In what we think is a significant contribution of the paper, we formally assess the impact of these two types of manipulation on the reliability or use-fulness of earnings. To do so, we analyse if ex-post failed firms report significantly less conditionally conservative earnings than continuing firms. Following Basu (1997), we identify conditional conservatism with an asymmetric recognition of economic gains and losses into earnings, and we measure it using the methodology proposed by Ball and Shivakumar (2005).2 Prior research shows that conditional conservatism is a desirable property of earnings as it is a key corporate gover-nance provision that provides important economic benefits such as reducing agency problems driven by information asymmetries (Beekes et al., 2004; Ahmed and Duellman, 2007; García Lara et al., 2007, 2009; LaFond and Watts, 2008), and that it varies substantially across firms in a predictable way (e.g. Ball et al., 2000; Qiang, 2007), especial-ly when there are differences in accrual-based earnings management (García Lara et al., 2005). Our results show that ex-post bankrupt firms re-port less conditionally conservative earnings in the years prior to failure than continuing firms. This reduced conditional conservatism, as suggested by prior research, increases agency problems and the probability of stakeholder expropriation.
The paper makes several contributions to the ex-isting literature. Specifically, we add to the stream of research on the quality of earnings in failed firms in several ways. First, we analyse two differ-ent aspects of earnings managemdiffer-ent: accounting manipulation and real activity manipulation, showing that managers resort to both. We also pro-vide epro-vidence on the timing of the manipulation,
2We use the term conditional conservatism following Beaver and Ryan (2005). Other studies use ‘earnings conservatism’, ‘income-statement conservatism’, ‘ex-post conservatism’ or ‘news-driven’ conservatism to refer to the same phenomenon.
3Prior research assumes the manipulation is the same from five years prior to bankruptcy to the year just before bank-ruptcy (Rosner, 2003), or analyses only the manipulation in the year just before failure (Smith et al., 2001). By aggregat-ing data over the years prior to failure, an analysis would sim-ilarly classify a firm that steadily increases earnings quality from low to high with a firm that does the reverse; as on aver-age across the five years they would both look similar when they are indeed very different.
as we show it starts four years prior to failure, and that accrual manipulation unravels in the year just before failure.3 Second, we show ex-post failed firms with a low ex-ante failure probability engage in more pronounced accruals manipulation. We in-terpret this evidence as firms being successful in hiding poor performance through accruals manip-ulation. On the other hand, firms with a high ex-ante failure probability, having likely exhausted their opportunities for accrual manipulation, ma-nipulate real activities more aggressively. Third, we conduct conditional conservatism tests to analyse whether the manipulation (both account-ing and real activities manipulation) leads to more aggressive accounting. We find that ex-post failed firms report less conditionally conservative earn-ings and, as suggested by prior research in condi-tional conservatism, this implies increased agency problems. Finally, prior research has focused on the US (Rosner, 2003), or in periods of recession (Smith et al., 2001). We use a UK sample over the period 1995–2004. The UK insolvency code al-lows for a wider definition of bankruptcy, with dif-ferent implications, than in the US (Franks et al., 1996; Bradbury, 2007).
The remainder of the paper is structured as fol-lows. Section 2 reviews the existing literature in this area and presents the research questions. Section 3 details the sample selection procedure and describes the methodology. Section 4 discuss-es the empirical rdiscuss-esults and Section 5 concluddiscuss-es.
2. Background and research questions
2.1. Firm failure in the UK
The UK Insolvency Act 1986 and its subsequent amendments govern the legal failure routes, rules and regulations for insolvent British companies. The Act provides several legal courses of action for companies in financial distress, the most com-mon and popular ones being administration, ad-ministrative receivership and liquidation.
An administration order is a court order placing a company that is, or is likely to become, insolvent under the control of an administrator following a petition by the company, its directors or a creditor (Part II, Insolvency Act 1986, s. 8–27). The purpose of the order is to preserve the company’s business and assets to allow a reorganisation, or ensure the most advantageous realisation of its assets whilst protecting it from action by its creditors.
An administrative receivership arises as a result of a company defaulting on secured borrowing (Part III, Insolvency Act 1986, s. 28–72). The bor-rowing is usually from a bank. Under receivership, a receiver is appointed by the creditor to run the company with the objective of recovering the out-standing bank finance, through any means (Chapter I, Part III). From a company point of view, the company is rarely saved in its existing
form, its assets are often subject to a meltdown and often jobs and economic activity is lost.
Finally, the liquidation or winding up of compa-nies is the procedure whereby the assets of a company are gathered in and realised, the liabili-ties are met, and surplus, if any exists, is distrib-uted to members (Part IV, Insolvency Act 1986, s. 73–219). Liquidation can be either compulsory or voluntary. In compulsory liquidation, a wind-ing-up petition is initiated, usually by a creditor, due to an outstanding debt that the company has not paid (Chapter VI, Part IV, Insolvency Act 1986). Voluntary liquidation is the placing of the company into liquidation by resolution of its mem-bers. There are two types of voluntary liquidation: creditors’ voluntary liquidation and members’ vol-untary liquidation. In the former case, the directors of the company, who assess that the company is, or will be, insolvent, approach an insolvency practi-tioner to wind up the company. In such cases, the creditors have the right to reject (by value of vote) the choice of the liquidator chosen by the compa-ny directors (Chapter IV, Part IV, Insolvency Act 1986). On the other hand, a members’ voluntary liquidation does not involve insolvency and comes about merely because the company shareholders wish to have the value of their holding realised (Chapter III, Part IV, Insolvency Act 1986).
2.2. Prior evidence on earnings management in financially distressed firms
Prior research on earnings management by trou-bled companies commonly focuses on firms that are showing signs of financial distress. A popular proxy for distress is debt covenant violation. Positive accounting theory predicts that firms ap-proaching covenant violations will make income-increasing accounting choices to loosen their debt constraints (Watts and Zimmerman, 1986). Sweeney (1994) and DeFond and Jiambalvo (1994) find evidence consistent with this hypothe-sis. Nonetheless, results are not always consistent; in fact, several studies find firms in distress re-porting large negative accruals (DeAngelo et al., 1994; Peltier-Rivest, 1999; Saleh and Ahmed, 2005), and argue that managers prefer to reflect the firm’s financial troubles to signal their willingness to deal with them (DeAngelo et al., 1994), or to obtain concessions from labour unions and subsi-dies from government. In all likelihood, a number of these financially troubled firms will approach or enter into technical default. However, covenant vi-olations are not always associated with increased distress risk. To account for this, several studies employ alternative definitions of distress such as dividend declines and series of consecutive losses (DeAngelo et al., 1994; Peltier-Rivest, 1999), or receiving going-concern audit opinions (Butler et al., 2004). These studies find that distressed firms
have large negative, performance-related accruals, but do not attribute this finding to earnings man-agement practices. Instead, they argue that firms with high risk of failure engage in liquidity en-hancing transactions in an attempt to survive.
The proxies used by prior research are likely to overstate the actual cases of severely troubled firms. Clearly, a more objective definition of fi-nancial distress is legal (involuntary) failure. Few studies, however, make use of bankruptcy data, probably due to the inherent difficulty in finding adequate data for firms that do not exist anymore. Also, bankruptcy presents a rather narrow defini-tion of failure, with only a very small percentage of listed firms going bankrupt. However, the stake-holders of a failed company suffer more severe losses than those of firms exhibiting weak per-formance. Hence, the detection of aggressive ac-counting practices in the years that precede bankruptcy becomes critical.
Only the prior work of Smith et al. (2001), Rosner (2003) and Charitou et al. (2007a, 2007b) directly examines the properties of earnings in ac-tually failed firms. For an Australian sample, Smith et al. find that ex-post bankrupt firms do not engage in accounting changes to inflate earnings in the year just before failure (year t-1). They find that distressed firms that do not end up being bank-rupt change their accounting policies to increase earnings. However, they do not directly examine whether ex-post bankrupt firms changed their ac-counting policies in the years before t-1, while managers still believe in the recovery of the firm.4 Also, they do not separately analyse accrual accounting behaviour in bankrupt firms with a low ex-ante probability of bankruptcy. Because their benchmark for failure is set on a specific date (12 months after filing the 1988 accounts), they cannot follow up on the behaviour of their distressed company sample. In contrast, our procedure allows us to follow up on firms that show little outward signs of distress but end up bankrupt. Since we do not know if the distressed firms in the Smith et al. study ended up bankrupt, their results on accounting changes in a period of economic downturn are difficult to interpret. Additionally, these changes in policies have to be reported in the financial statements, and thus, as earnings management instruments, they lack the element of concealment.
More closely related to our study, Rosner (2003) investigates accrual manipulation on a sample of 293 failed US companies and finds that firms
ma-nipulate earnings upwards in pre-bankruptcy non-going-concern years. However, in her tests she pools all years together and assumes that the ma-nipulation of earnings in ex-post bankrupt firms is the same during the five years prior to failure. Our results indicate that this is not the case. In addition, she shows that in the year preceding failure, firms receiving going-concern opinions exhibit income-decreasing behaviour. She attributes this to the over-statement reversals that auditors demand when they eventually detect a going-concern problem.
Finally, the work of Charitou et al. (2007a, 2007b), which closely relates to that of Rosner (2003), uses a sample of US firms that filed for Chapter 11 to analyse earnings management prac-tices in distressed firms. However, their focus is on analysing the role played by auditors and other monitoring bodies in constraining earnings manip-ulation in the year just before bankruptcy and on the links between earnings manipulation in the year prior to filing for bankruptcy and the likeli-hood of survival thereafter.
2.3. Research questions 2.3.1. Accounting manipulation
Firms approaching bankruptcy probably engage in income-increasing earnings management prac-tices (decreasing cost of goods sold, releasing bad debt accruals, etc.) in an attempt to ride out what is probably deemed by management as a temporary bad period. Managerial optimism most likely pre-vails, leading managers to maintain the belief that firm performance will improve in the following periods and thus, to keep manipulating earnings upwards even when they know that their actions will accumulate and reverse in the future (Graham et al., 2005). However, there are limits to manage-rial optimistic biases. The balance sheet accumu-lates previous decisions, placing constraints to the number of consecutive years when over-optimism can be exerted without committing GAAP viola-tions (Barton and Simko, 2002). Precisely because firms end up failed, there is an assurance that de-teriorating financial health was not a temporary concern. It is expected that: (1) the scope for ac-crual management will decrease as bankruptcy ap-proaches, as managers exhaust their opportunities for successful manipulation; and also that (2) the actions undertaken in the years leading up to bank-ruptcy will accumulate in the final year, cascading into large negative accruals when previous manip-ulation reverses and deteriorating performance cannot be hidden any longer. Thus, we test the fol-lowing hypotheses (in alternative form):
H1A: Failed firms manage earnings in the years before failure;
H1B: In the year prior to bankruptcy, as managers exhaust their opportunities for 4Their sample covers only 1988. As they recognise, their
evidence might not be generalisable due to the stock market crash of 1987 and the subsequent financial crisis (likely leading to increased monitoring). We cover a longer and more stable time period (1998–2004), in a stable macroeconomic environment (the UK).
successful accrual manipulation, previously manipulated accruals reverse, leading to an accumulation of negative accruals just before failure.
2.3.2. Real earnings management
Following Roychowdhury (2006), we define real earnings manipulation as ‘management ac-tions that deviate from normal business practices, undertaken with the primary objective of meeting certain earnings thresholds’ (p. 336). Earnings centives give rise to sub-optimal operating, in-vestment and financing decision making, when managers resort to real actions to meet their in-come targets. The seminal work of Schipper (1989: 92) puts forward as an example of real earnings management the timing of investment or financing decisions to alter reported earnings. Subsequent research demonstrates that managers time the sale of long-lived assets and investments (Bartov, 1993), delay and abandon research and development projects, give more lenient credit terms or reduce necessary expenses such as those on advertising and asset maintenance to meet their earnings targets (Bushee, 1998; Graham et al., 2005, Roychowdhury, 2006; Cohen et al., 2008; García Osma and Young, 2009).5 Thus, whilst real earnings management is not an entire-ly accounting phenomenon (in that it is not di-rectly achieved through accounting), it is driven by the desire to keep up accounting appearances. A survey by Graham et al. (2005) of 401 financial executives indicates a preference for real actions over purely accounting decisions to manipulate earnings. Similar UK survey studies present com-parable views (Demirag, 1995; Grinyer et al., 1998).
In the case of failing firms, real earnings ma-nipulation is aimed at increasing current earnings to conceal poor performance. However, real earn-ings manipulation is expected to reduce future cash flows, and, consequently, firm value. As pointed out by Peasnell et al. (2000: 420–421) the use of sub-optimal operating strategies is more costly than the reversals from accruals, and, con-sequently a more aggressive form of earnings management and thus, a last resource for man-agement. However, even if real earnings manipu-lation is costly, bankruptcy is certainly even more so. In failed firms, the years prior to bankruptcy
are probably characterised by more aggressive accounting practices, and in all likelihood, also by the undertaking of real actions to manage earnings and perceptions, particularly in those firms that have exhausted their possibilities for successful accrual manipulation. Therefore, we extend our analysis to study abnormal cash flow activity.
H2: Failed firms engage in real earnings manipulation in the years before failure. Real earnings management will be more pronounced if the firm’s financial condi-tion is weak and the possibilities for accru-al manipulation have been exhausted.
2.3.3. Effects of accounting and real earnings manipulation on the usefulness of earnings
Prior research on earnings management in healthy firms shows that often discretionary accruals are value-relevant and are used by man-agers as a signalling device (Guay et al., 1996; Subramanyam, 1996). Healy and Palepu (1993) argue that income-increasing strategies have sig-nalling value if they are used to communicate in-creases in future earnings to investors. In those cases, discretionary accruals can increase the use-fulness of accounting numbers. However, as our sample comprises only ex-post bankrupt firms, we expect that income-increasing discretionary accru-als in the years preceding failure will be due to op-portunistic managerial behaviour.
Early work on failed firms only studies the mag-nitude of the proxies for income-increasing strate-gies to ascertain whether they respond to signalling vs. opportunistic reporting. We go one step beyond the descriptive evidence on the quan-tity of policy changes and discretionary accruals in Smith et al. (2001) and Rosner (2003) and explic-itly analyse the consequences of managerial ma-nipulation by studying if the reliability of accounting numbers in failed firms is hindered by their income increasing strategies. To do so, we study the conditional conservatism of earnings in failed vs. continuing firms.
We choose conditional conservatism as a benchmark to assess whether the usefulness of earnings declines in ex-post bankrupt firms as a result of both accounting and real activities ma-nipulation for several reasons: (1) conditional conservatism is a summary measure of manageri-al reporting choices; (2) extant evidence demon-strates that better governed firms report more conditionally conservative earnings as a response to investors demands, who consider it as a desir-able property of earnings (Beekes et al., 2004; Ahmed and Duellman, 2007; García Lara et al., 2007, 2009); and (3) recent research shows that conditionally conservative accounting leads to positive economic outcomes such as an ameliora-5For example, if a covenant in a debt contract demands a
minimum ROA of 2%, and true ROA is 1.9%, management may bridge the gap between both numbers by increasing net income artificially via accrual management that requires either accounting (e.g. reducing the provision for bad debts for the year) or real manipulation (e.g. relaxing credit terms to in-crease revenues), or both. This effect may also be achieved by selling assets, which would reduce the denominator (less as-sets) and increase the nominator (more cash or accruals), or by reducing discretionary expenses.
tion of the problems derived from information asymmetries (LaFond and Watts, 2008), or im-provements in contracting efficiency (Ball et al., 2008).
Following Basu (1997), we define conditional conservatism as a timelier recognition of econom-ic losses than economeconom-ic gains in earnings.6For ex-ample, increases in the value of assets are not reflected in the profit and loss account, while de-creases are reflected through impairments. At the root of this asymmetric treatment for the recogni-tion of economic gains and losses in earnings is the principle of conservatism or prudence that is em-bedded into most regulatory accounting frame-works (FASB, 1980; IASC, 1989; ASB, 1999). This asymmetry in recognition requirements re-sults in earnings that reflect bad news faster than good news (Basu, 1997). Timely loss recognition is expected to constrain management’s opportunis-tic payments to themselves and to other parties, and is considered a desirable property of account-ing earnaccount-ings (Ball and Shivakumar, 2005) that mit-igates moral hazard problems.
We hypothesise that in the years prior to failure, failed firms will show less conditionally conserva-tive earnings than financially sound firms, because failed firms are likely to engage in less conserva-tive accounting practices in those years to conceal their true economic performance (Ohlson, 1980), and in an attempt to postpone bankruptcy. As a consequence of this more aggressive (less conser-vative) accounting, managers relax the require-ments for economic gains recognition, anticipating their recognition, while at the same time they at-tempt to delay the recognition of losses. Failing firms tend to have increasing inventories and in-creasing debtors (increase in accruals with reduced certainty of becoming cash flows). Although the ASB Statement of Principles(1999) does not pre-scribe conservative accounting, it states (ch. 3) that ‘a degree of caution’ has to be ‘applied in
exercising the necessary judgements’. Managers are thus expected to exercise caution and respond to this situation by increasing bad debt provisions and by impairing inventories. However, as pointed out by Ohlson (1980), when failure approaches, managers are expected to relax their conservative policies to try to delay it. Similar to Rosner (2003), we argue that if this is indeed the case, managers are likely to resort to aggressive accrual manage-ment in the years prior to failure. This aggressive accrual management could be achieved by, for ex-ample, not increasing bad debt provisions and not impairing inventories adequately.
Conditional conservatism is also expected to be affected by real earnings management. In an at-tempt to increase earnings, managers may aggres-sively relax credit terms, by selling on credit to customers with high ex-ante credit risk. This would lead to increases in the percentage of ex-pected bad debts. Similar to the prior case, under the framework of the ASB, managers are expected to respond by increasing bad debt provisions. Failure to do so in an attempt to increase earnings would lead to aggressive instead of conservative accounting. The joint effect of both accruals and real activities manipulation in ex-post failed firms is expected to reduce the conservatism of account-ing numbers in these firms. Consequently, our third and final hypothesis is as follows:
H3: Ex-post failed firms present less conditionally conservative earnings numbers than continuing firms in the years preceding bankruptcy.
3. Research method and sample selection
procedure
We compare earnings quality between failed and continuing firms. Earnings quality is a broad con-cept with multiple dimensions (e.g. Al-Attar et al., 2008; Barker and Imam, 2008). We focus on earn-ings management and its influence on accounting reliability, as measured by conditional conser-vatism. Measures of earnings management and timely loss recognition are calculated for the full sample, to avoid biasing in favour of our hypothe-sis that earnings quality is lower in failed firms.7 This section provides details of the calculation of these measures and describes the sample selection procedure.
3.1. Measurement of accounting accruals manipulation
Ex-post failed firms may attempt to conceal de-teriorating firm performance by using income-in-creasing accounting accruals. Extant research calculates abnormal accruals using the Jones (1991) model in cross-section, to improve the esti-mation of the parameters, as suggested by DeFond 6 Beaver and Ryan (2005) identify two separate types of
conservatism: conditional and unconditional. It is important to distinguish between them. They define unconditional conser-vatism as a persistent understatement of assets due to the use of accounting conventions at the inception of assets and lia-bilities, such as the non-recognition of internally generated in-tangible assets or the use of historical cost. Ball and Shivakumar (2005) argue that unconditional conservatism in-troduces a bias of unknown magnitude in the financial state-ments that does not contribute to contracting efficiency. Thus, in our study, we analyse only the conditional form.
7Prior research on failed firms like Rosner (2003) compares failed firms earnings quality estimates to those of matched non-bankrupt control samples, considering only firms with sound financial performance and avoiding cases that exhibit net losses. Excluding distressed firms biases the procedure in favour of finding the hypothesised result of differences be-tween failed and continuing firms, especially if a number of continuing firms face financial problems, as happens in the UK (Neophytou and Mar Molinero, 2004).
and Jiambalvo (1994). The Jones model uses the unexplained part of a regression of total accruals on the change in revenue and gross property, plant and equipment as a proxy for abnormal accruals. We use the working capital version of the model because current research indicates that manage-ment has more discretion over current accruals, and that manipulation of long-term accruals such as depreciation is unlikely due to their high visi-bility and low flexivisi-bility (Becker et al., 1998; Young, 1999).
Aside from the working capital version of the Jones (1991) model, we also use the modified Jones model. The Jones (1991) model assumes that revenues are not discretionary. That is, the model disregards the possibility that managers also engage in real activities manipulation, by ac-cruing revenues before the cash is received and when it is still questionable that the revenues have been earned. By assuming all revenues are non-discretionary, the Jones model removes part of the manipulation from the abnormal accrual proxy. Contrarily, the modified Jones model proposed by Dechow et al. (1995) assumes that all increases in credit sales are driven by managerial opportunis-tic decisions and classifies them as discretionary, modifying the Jones model by removing the change in receivables from the change in sales. Dechow et al. (1995) show that their modification ameliorates the tendency of the Jones model to measure abnormal accruals with error when dis-cretion is exercised over revenues. Therefore, by using both the Jones and modified Jones models, we are able to analyse a proxy for manipulation capturing only ‘pure’ accounting manipulation (that is, the Jones model), and a proxy that pools together accounting and real activities manipula-tion (the modified Jones model). Finally, we em-ploy the Kasznik (1999) model, which differs from the modified Jones model in that it incorpo-rates the change in operating cash flow as an ex-planatory variable to account for the negative correlation between accruals and cash flows (Dechow, 1994).
To obtain a measure of abnormal working capi-tal accruals for all firms in industry jfor year t, we estimate the Kasznik model cross-sectionally for all industry-year combinations with at least six ob-servations of data, as follows:
(1)
where, WCAis working capital accruals, ∆REVis change in sales, ∆CFOis change in cash flow from operations and TAare total assets, and tis the time-period indicator. Next, for each firm, we calculate abnormal working capital accruals (AWCA) as fol-lows:
(2)
where, α^ 0, α
^ 1and α
^
2are the fitted industry-coeffi-cients from equation (1) and ∆RECis the change in accounts receivable. To run models (1) and (2), all available observations are used, including con-tinuing and failed firms, to avoid introducing bias-es in the analysis. By removing the change in receivables (∆REC) from the change in revenues in equation (2) the model classifies as discre-tionary accruals all changes in receivables, includ-ing those driven by the manipulation of real activities.
To obtain abnormal accruals measures using the modified Jones model, we use the same procedure, but we do not include ∆CFOas an additional vari-able in models (1) and (2). Finally, to estimate ab-normal accruals using the original Jones model, we follow this last procedure (i.e. exclude ∆CFO
from the models), but without subtracting change in accounts receivable from change in sales in the second step. The Jones model measures discre-tionary accruals not including the effect of real ac-tivities manipulation, as it classifies all changes in accounts receivables as ‘normal’ accruals.
3.1.1. Classification of observations
A key issue in our analysis of earnings manipu-lation by ex-post bankrupt firms is whether their attempts at masking poor performance in the years prior to failure were successful, and whether man-agers were able to mislead investors. To analyse if the accruals manipulation was successful at hiding poor performance we split sample observations in accordance to their ex-ante failure probability. Ex-post bankrupt firms that ex-ante do not show signs of failure are expected to have engaged in more aggressive accounting practices (Rosner, 2003), or at least, in practices that successfully masked poor performance.8 To identify them, we calculate the ex-ante one-year-ahead probability of bankruptcy of all failed firms. We use the Charitou et al., (2004) failure prediction model, which is built using the logit methodology. The model is as fol-lows:
(3a) 8An alternative explanation is that ex-post failed firms with
large ex-ante failure probability do not have scope to manage accruals given their extremely deteriorated financial condi-tion.
where,
(3b)
where, Pjt(Y= 1) is the probability of failure for entity j at the end of year t; EBITis earnings before interest and taxes; and CFO is cash flows from op-erations. Using this method, we obtain an ex-ante probability that the firm would end up being bank-rupt that we use to identify firms that are suspect of more aggressive earnings practices.9
3.2. Measurement of real earnings manipulation
To analyse the existence of real activities manip-ulation we focus on one specific type of real earn-ings management: sales manipulation, which we measure following the method of Roychowdhury (2006). Similar to the calculation of abnormal ac-cruals in equations (1) and (2), the first stage con-sists of deriving normal cash flow activity. We run the following cross-sectional regression for every industry-year combination with at least six obser-vations of data:
(4)
where all variables are defined as before. For every observation, abnormal cash flow (ACFO) is ob-tained by subtracting from actual firm CFO the normal CFO calculated using the estimated β^ co-efficients from equation (4). The procedure is the same as the one previously explained for estimat-ing a firm’s abnormal accruals. Once ACFO
has been estimated, we adapt the method by Roychowdhury (2006) to compare cash flow
be-haviour in suspect firms – in our case, the failed firms – with the sample of continuing firms as fol-lows:
(5)
where SIZE is defined as the natural logarithm of total assets, NetIncome is net income scaled by be-ginning-of-period total assets, and FAILING is a dummy indicator taking the value of 1 if the firm goes bankrupt; 0 otherwise, and t is the time-peri-od indicator. If failed firms manipulate sales up-wards by offering more lenient credit terms, then it is expected that the level of cash flow will be ab-normally low, given the level of sales. Thus, if failed firms are manipulating their sales, δ3will be negative and significant, consistent with an abnor-mally low level of CFO, given the reported sales.
3.3. Measurement of conditional conservatism
Both accounting accruals and real activities ma-nipulation are likely to result in a reduction of timely loss recognition in failed firms. To measure the differential recognition speed of economic gains and losses in earnings we use the time series and accruals-based measures of conditional con-servatism developed by Ball and Shivakumar (2005).
3.3.1. Time series tests based on the persistence of income changes
Basu (1997) and Ball and Shivakumar (2005) argue that the asymmetric recognition of econom-ic gains and losses in earnings leads to differences in the persistence of gains and losses. Losses are less persistent as their timely recognition makes them appear as one-time shocks to earnings, while gains are reflected only when cash flows are re-alised, and, consequently, they are seen as perma-nent earnings compoperma-nents. This leads Basu (1997: 20) to argue that ‘negative earnings changes have a greater tendency to reverse in the following peri-od than positive earnings changes’. The tendency of negative earnings changes to reverse is docu-mented by Brooks and Buckmaster (1976) and Elgers and Lo (1994).
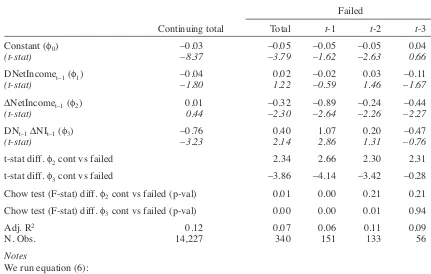
Using the Basu (1997) method as a starting point,10 Ball and Shivakumar (2005) develop a model to measure timely incorporation of gains and losses in accounting income ‘as the tendency for increases and decreases in earnings to reverse’ (p. 92). We follow Ball and Shivakumar (2005) and estimate the following model for our full sam-ple:
(6) 9We do not use Altman’s (1968) Z-score model because it
is built using LDA, a technique that makes strong demands on the structure of data. First, it requires that the financial ratios are normally distributed. This is known not to be the case (Ezzamel and Mar Molinero, 1987). Also, the ratios of failed companies should have the same variance-covariance struc-tures as those of continuing firms. Richardson and Davidson (1983; 1984) show this assumption does not hold in the con-text of failure prediction. Furthermore, we do not use a model developed with US data for UK firms since there are signifi-cant differences between the reporting practices and insolven-cy codes of the two countries (Charitou et al., 2004). Finally, Mensah (1984) finds distress prediction models to be funda-mentally unstable: coefficients varying according to the un-derlying health of the economy. Thus model derivation should be as close in time as possible to the period over which pre-dictions are made.
10We do not use the Basu (1997) model as FAME does not provide share prices for most of our sample of bankrupt firms. In addition, several studies including Dietrich et al., (2007) recommend the use of non-market-based versions of Basu specifications, such as the ones in Ball and Shivakumar (2005).
where ∆NetIncomet (∆NetIncomet–1) is change in net income from fiscal year t-1 to t (t-2 to t-1), scaled by beginning-of-period total assets.
DNetIncome is a dummy variable that takes the value of 1 if the prior-year change in net income is negative; 0 otherwise. Year is a dummy variable for the fiscal year.
As described by Ball and Shivakumar (2005: 92), ‘if gains are recognised in an untimely (smoothed) manner, they will be persistent compo-nents of net income that tend not to reverse and thus, φ2will be equal to zero’. That is, under con-servative accounting, they expect φ2 = 0. If man-agers choose aggressive accounting methods and foster good news recognition, positive income changes will behave as ‘temporary earnings com-ponents that tend to reverse’. In our setting, where we compare ex-post failed with continuing firms, we expect that the φ2coefficient will equal zero for continuing firms, as they will be conditionally conservative as required by accounting standards. However, for ex-post failed firms it will be signif-icantly negative (φ2< 0) if they engage, as expect-ed, in income-increasing accounting practices to conceal poor performance and postpone bankrupt-cy. Regarding economic losses, their timely recog-nition implies that ‘they are recognised as transitory income decreases, and hence reverse’ (Ball and Shivakumar, 2005: 92). As they show, the implication is that φ3 will be negative. However, given that failed firms engage in aggres-sive accounting policies (φ2< 0), in our setting we expect failed firms to show a significantly positive φ3 (φ3 > 0) if they delay the recognition of eco-nomic losses to the point that ecoeco-nomic gains are reflected in earnings faster than economic losses. A positive φ3 implies economic losses are more persistent than economic gains. That is, firms de-viate from conservative accounting and recognise losses in earnings at a slower pace than gains.
3.3.2. Accruals-based tests
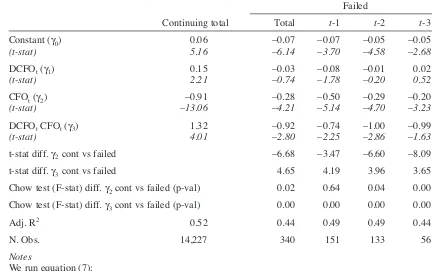
As developed in Ball and Shivakumar (2005), asymmetric gain and loss recognition results in an asymmetry in accruals, ‘because economic losses are more likely to be recognised on a timely basis as unrealised (i.e. non-cash) accrued charges against income. Economic gains are more likely to be recognised when realised, and hence accounted for on a cash basis.’ (p. 94). As a final test, follow-ing Ball and Shivakumar (2005) we estimate the model:
(7)
where TACC is total accruals divided by beginning of period total assets; CFO is cash flow from op-erations divided by beginning-of-period total
as-sets; DC is a dummy variable that takes the value of 1 if CFO is negative, and 0 otherwise. Year is a dummy variable for the fiscal year. Given that Dechow (1994) and Dechow et al. (1998) docu-ment a negative relation between accruals and cash flows, and that this negative relation is embedded in the very same nature of the accounting process (accruals reverse), Ball and Shivakumar (2005) expect a negative γ2, reflecting the negative asso-ciation between accruals and cash flows. Ball and Shivakumar (2005: 94) predict a positive γ3under the hypothesis that accrued losses are more likely when the firm presents negative cash flows. That is, under conditional conservatism, in the case of economic losses, the decrease in earnings and the decrease in cash flows happen in the same period, and, consequently, the negative correlation be-tween accruals and cash flows decrease in bad news periods. This is captured by a positive γ3. Our prediction is that failed firms have lower quality earnings than continuing firms, and therefore, are less likely to recognise losses as transitory items. This implies lower asymmetry, and thus, γ3is ex-pected to be lower for failed firms. In the case of aggressive accounting, γ3 would be negative. If managers manipulate earnings upwards (by releas-ing negative accruals or decreasreleas-ing cost of goods sold) this would increase the negative association between accruals and cash flows, even in bad news periods, contributing to a negative γ3 (aggressive accounting). If managers engage in real earnings management, and increase sales (and therefore, debtors) but not cash flows, this would again trans-late into creating more positive accruals in periods of negative cash flows, again contributing to a negative association between accruals and cash flows even in bad news periods, that is, to a nega-tive γ3. Consequently, income-increasing strate-gies, both through accounting or real earnings manipulation, lead to a negative γ3coefficient.11
Accrual behaviour in years of positive cash flows is expected to be different in failed and con-tinuing firms too. If managerial behaviour in failed firms results in accruals manipulation to increase earnings, this would translate into earnings captur-ing economic gains faster, and thus, the negative association between cash flows and accruals would be reduced. Consequently, we expect a
neg-11Exogenous economic events may contribute as well to this negative γ3coefficient. An example of these economic events would be if a major customer suddenly slows down payment without any sales management involved, leading to lower cash flows as compared to sales. The firm may decide not to make a provision against this slower payment. If the firm ran into a cash flow crisis, we would also observe a neg-ative association between cash flows and accruals in the model, a symptom of aggressive accounting. Thus, the model captures cases of aggressive accounting, regardless of the ori-gin and motive of the underlying economic events.
ative coefficient on γ2 for failed and continuing firms, but smaller in absolute value for failed firms.
3.4. Sample selection procedure
Financial statement data are collected from the FAME database. FAME contains detailed informa-tion on public (quoted at either the London Stock Exchange’s Primary Market or at the Alternative Investment Market (AIM)) and private firms in the UK and Ireland. All British publicly quoted firms included in the database ‘Active company file’ at the time of data collection entered our continuing sample. Where available, we collected data for these firms as far back as 1990. The continuing sample with full data available consists of 2,801 firms.
UK publicly quoted firms that received an ad-ministration order, went into receivership, or were liquidated, as per the Insolvency Act 1986, were identified from the FAME database ‘Inactive com-pany file’.12Furthermore, for a failed firm to qual-ify for our sample, it had to declare insolvency between 1998 and 2004, and to have at least three years of full financial data prior to its collapse. We exclude finance, insurance and real estate firms (division H, 60–67, of US SIC code system), as firms operating in these industries are structurally different and their financial reporting practices generally preclude combining them with non-fi-nancial firms (Gilbert et al., 1990). We also ex-clude duplicates and observations with missing data to run our earnings management tests.
These criteria result in 268 failed firms with full
data available. From those, 77 went into adminis-tration, 81 into receivership, and 110 were liquida-tions. We cannot distinguish between firms in the main market and AIM as once firms become inac-tive FAME classifies them as ‘Quoted Inacinac-tive’. Table 1 summarises the sample selection proce-dure and provides a classification of observations across types of failure.13
4. Empirical results
4.1. Accruals manipulation in failed vs. continuing firms
Using the method described in Section 3.1.1 above, we first classify failed firm-year observa-tions that have an ex-ante probability of failure lower than 15% as having a low probability Table 1
Sample selection procedure and distribution of observations
Panel A: Sample selection procedure
Firm-years Firms
Firms with data available in FAME entering bankruptcy 1998–2004 1,068 352
Less: Firms with less than three years of data previous to bankruptcy (49) (32)
Finance, real estate and insurance firms (63) (21)
Duplicated firms (56) (11)
Firms with missing data to calculate abnormal accruals (66) (20)
Failed firms with data to run earnings management tests 834 268
Continuing firms with full data available in FAME 1995–2004 14,742 2,801
Panel B: Distribution of failed firms by type of failure
Administration Liquidation Receivership Total
Number of firms 77 110 81 268
(proportion) (28.73%) (41.04%) (30.23%)
Number of firm-years 234 331 269 834
(proportion) (28.06%) (39.69%) (32.25%)
Notes
Failed firms are obtained from the FAME ‘inactive companies’ file. Abnormal Accruals are abnormal working capital accruals as calculated using the Kasznik (1999) model.
12From the ‘Inactive company’ file we choose companies registered in the UK, and select ‘public companies’ (‘legal form’) including only receiverships, administrations and liquidations. To confirm the nature of the failure and its formal date we look at announcements from other sources (e.g. press announcements). The list of failed firms is available from the authors upon request.
13Auditors play a significant role in ensuring financial state-ment quality, reducing the incidence of earnings managestate-ment (Becker et al., 1998) and opportunistic loss deferrals (Chung et al., 2003). We do not consider the monitoring role of auditors in our study due to insufficient data. Out of our sample of failed firms, 25 observations received a qualified opinion (19 of them in t-1), 277 an unqualified opinion and for all others data were not available. The year prior to bankruptcy, 10.1% of failed firms received a qualified opinion, while 39.7% received an unqualified opinion and no data were available for the remaining firms.
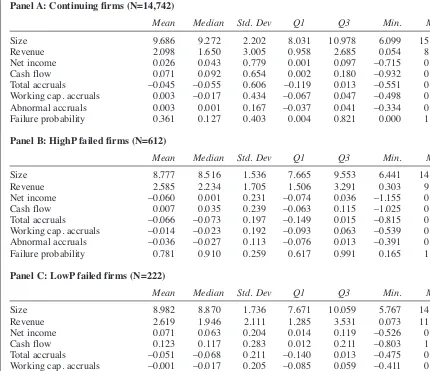
Table 2
Descriptive statistics of sample firms
Panel A: Continuing firms (N=14,742)
Mean Median Std. Dev Q1 Q3 Min. Max.
Size 9.686 9.272 2.202 8.031 10.978 6.099 15.878
Revenue 2.098 1.650 3.005 0.958 2.685 0.054 8.676
Net income 0.026 0.043 0.779 0.001 0.097 –0.715 0.487
Cash flow 0.071 0.092 0.654 0.002 0.180 –0.932 0.675
Total accruals –0.045 –0.055 0.606 –0.119 0.013 –0.551 0.694
Working cap. accruals 0.003 –0.017 0.434 –0.067 0.047 –0.498 0.739
Abnormal accruals 0.003 0.001 0.167 –0.037 0.041 –0.334 0.333
Failure probability 0.361 0.127 0.403 0.004 0.821 0.000 1.000
Panel B: HighP failed firms (N=612)
Mean Median Std. Dev Q1 Q3 Min. Max.
Size 8.777 8.516 1.536 7.665 9.553 6.441 14.314
Revenue 2.585 2.234 1.705 1.506 3.291 0.303 9.103
Net income –0.060 0.001 0.231 –0.074 0.036 –1.155 0.219
Cash flow 0.007 0.035 0.239 –0.063 0.115 –1.025 0.450
Total accruals –0.066 –0.073 0.197 –0.149 0.015 –0.815 0.447
Working cap. accruals –0.014 –0.023 0.192 –0.093 0.063 –0.539 0.529
Abnormal accruals –0.036 –0.027 0.113 –0.076 0.013 –0.391 0.204
Failure probability 0.781 0.910 0.259 0.617 0.991 0.165 1.000
Panel C: LowP failed firms (N=222)
Mean Median Std. Dev Q1 Q3 Min. Max.
Size 8.982 8.870 1.736 7.671 10.059 5.767 14.259
Revenue 2.619 1.946 2.111 1.285 3.531 0.073 11.756
Net income 0.071 0.063 0.204 0.014 0.119 –0.526 0.707
Cash flow 0.123 0.117 0.283 0.012 0.211 –0.803 1.094
Total accruals –0.051 –0.068 0.211 –0.140 0.013 –0.475 0.657
Working cap. accruals –0.001 –0.017 0.205 –0.085 0.059 –0.411 0.687
Abnormal accruals 0.017 0.001 0.118 –0.052 0.066 –0.309 0.394
Failure probability 0.030 0.009 0.040 0.001 0.051 0.000 0.136
Notes
HighP (LowP) are failed firms with a high (low) ex-ante probability of failure. A high (low) probability is set up as being higher or equal (lower) than 15%.
Size is the natural logarithm of total assets. All other variables are scaled by beginning-of-period total assets: Revenue is sales. Working Cap Accruals is working capital accruals. Failure Probability is the probability that a firm will go bankrupt calculated as in Charitou et al. (2004). Abnormal Accruals is a measure of firm abnor-mal working capital accruals calculated using the Kasznik (1999) model. Firms are classified as (1) Continuing
if they do not go bankrupt during the considered period (1998–2004), (2) Failed (LowP) if they go bankrupt and their ex-ante bankruptcy probability of going bankrupt is below 15%; or (3) Failed (HighP) if they go bankrupt and their ex-ante bankruptcy probability of going bankrupt is equal or above 15%.
(LowP) of failure, and all others as having a high probability (HighP) of failure.14
Table 2 presents descriptive statistics of sample firms. Continuing firms have a median (mean)
probability of bankruptcy of 12.7% (36.1%). Failed firms are split between LowP and HighP
firm-year observations.15 HighPfirms have a me-dian (mean) probability of bankruptcy of 91.0% (78.1%), whilst LowPfirms have a probability of 1% (3%). A more detailed look at the descriptive statistics reveals that LowPfirms have higher net income (NI) and cash from operations (CFO) than both continuing and HighP firms. Interestingly,
HighPfirms have, on average, higher sales relative 14Observations are classified almost identically if we
in-crease the threshold of failure to 20% or even 25%.
15 Throughout the text we make reference to HighPand LowPfirms for simplicity. It would be more correct to use the terms HighPand LowPfirm-year observations.
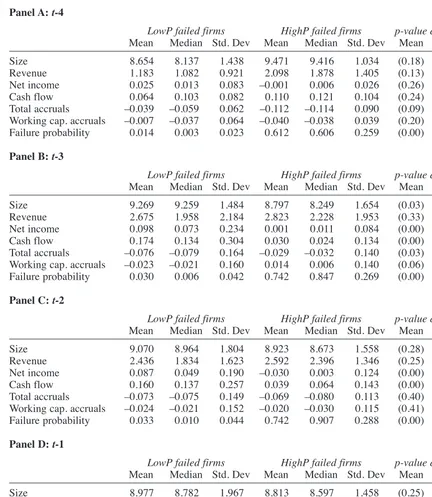
Table 3
Descriptive statistics of failed firms by year of bankruptcy
Panel A: t-4
LowP failed firms HighP failed firms p-value difference
Mean Median Std. Dev Mean Median Std. Dev Mean Medians
Size 8.654 8.137 1.438 9.471 9.416 1.034 (0.18) (0.13)
Revenue 1.183 1.082 0.921 2.098 1.878 1.405 (0.13) (0.19)
Net income 0.025 0.013 0.083 –0.001 0.006 0.026 (0.26) (0.45)
Cash flow 0.064 0.103 0.082 0.110 0.121 0.104 (0.24) (0.27)
Total accruals –0.039 –0.059 0.062 –0.112 –0.114 0.090 (0.09) (0.19)
Working cap. accruals –0.007 –0.037 0.064 –0.040 –0.038 0.039 (0.20) (0.27)
Failure probability 0.014 0.003 0.023 0.612 0.606 0.259 (0.00) (0.01)
Panel B: t-3
LowP failed firms HighP failed firms p-value difference
Mean Median Std. Dev Mean Median Std. Dev Mean Medians
Size 9.269 9.259 1.484 8.797 8.249 1.654 (0.03) (0.01)
Revenue 2.675 1.958 2.184 2.823 2.228 1.953 (0.33) (0.10)
Net income 0.098 0.073 0.234 0.001 0.011 0.084 (0.00) (0.01)
Cash flow 0.174 0.134 0.304 0.030 0.024 0.134 (0.00) (0.01)
Total accruals –0.076 –0.079 0.164 –0.029 –0.032 0.140 (0.03) (0.02)
Working cap. accruals –0.023 –0.021 0.160 0.014 0.006 0.140 (0.06) (0.03)
Failure probability 0.030 0.006 0.042 0.742 0.847 0.269 (0.00) (0.00)
Panel C: t-2
LowP failed firms HighP failed firms p-value difference
Mean Median Std. Dev Mean Median Std. Dev Mean Medians
Size 9.070 8.964 1.804 8.923 8.673 1.558 (0.28) (0.26)
Revenue 2.436 1.834 1.623 2.592 2.396 1.346 (0.25) (0.08)
Net income 0.087 0.049 0.190 –0.030 0.003 0.124 (0.00) (0.00)
Cash flow 0.160 0.137 0.257 0.039 0.064 0.143 (0.00) (0.00)
Total accruals –0.073 –0.075 0.149 –0.069 –0.080 0.113 (0.40) (0.46)
Working cap. accruals –0.024 –0.021 0.152 –0.020 –0.030 0.115 (0.41) (0.47)
Failure probability 0.033 0.010 0.044 0.742 0.907 0.288 (0.00) (0.00)
Panel D: t-1
LowP failed firms HighP failed firms p-value difference
Mean Median Std. Dev Mean Median Std. Dev Mean Medians
Size 8.977 8.782 1.967 8.813 8.597 1.458 (0.25) (0.39)
Revenue 2.272 1.636 1.781 2.376 1.999 1.659 (0.35) (0.14)
Net income 0.015 0.021 0.209 –0.106 –0.040 0.192 (0.00) (0.00)
Cash flow 0.074 0.093 0.258 0.011 0.036 0.196 (0.03) (0.00)
Total accruals –0.059 –0.101 0.292 –0.117 –0.100 0.169 (0.04) (0.19)
Working cap. accruals –0.015 –0.042 0.283 –0.065 –0.053 0.172 (0.06) (0.27)
Failure probability 0.041 0.021 0.045 0.865 0.966 0.211 (0.00) (0.01)
Notes
HighP (LowP) are failed firms with a high (low) ex-ante probability of failure. A high (low) probability is set up as being higher or equal (lower) than 15%. Size is the natural logarithm of total assets. Revenue is sales.
Working cap. accruals is working capital accruals. Failure probability is the probability that a firm will go bankrupt calculated as in Charitou et al. (2004). Abnormal accruals is a measure of firm abnormal working capital accruals calculated using the Kasznik (1999) model. Firms are classified as (1) Continuing if they do not go bankrupt during the considered period (1998–2004), (2) Failed (LowP) if they go bankrupt and their ex-ante bankruptcy probability of going bankrupt is below 15%; or (3) Failed (HighP) if they go bankrupt and their ex-ante bankruptcy probability of going bankrupt is equal or above 15%.
to cash flow than both LowPand continuing firms. The difference in mean and median CFO between these groups is significant at the 1% level using a
t- and a Wilcoxon-test, respectively, while the dif-ference in median sales is significant at the 5% level (p-value=0.022). This initial evidence is con-sistent with the sales manipulation hypothesis.
LowPfirms have significantly higher AWCAs than
HighP firms, suggesting that LowPfirms are po-tentially more successful at hiding their distress from the market, and can therefore manage earn-ings more aggressively than the sub-set of HighP
firms, which show more signs of being distressed. The difference in mean and median abnormal ac-cruals between the HighPand LowPgroups is
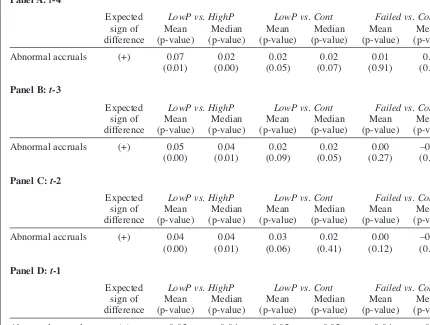
sig-nificant at the 1% level, (t=4.28, and Z=4.61). Tables 3 and 4 analyse the evolution of key fi-nancial indicators during the years prior to bank-ruptcy for HighPand LowPfirms. Extant research on bankruptcy suggests that significant differences exist between the accounting numbers of failed and non-failed firms up to five years before bank-ruptcy (Beaver, 1966). However, we expect that some firms (those classified as LowP) retain suffi-cient scope to manipulate their numbers, and thus, may successfully appear as healthy in the years prior to bankruptcy. Such successful manipulation could affect the classification performance of bankruptcy models, especially for a great number of firms that lie in what Jones (1987) refers to as Table 4
Yearly differences in abnormal accruals
Panel A: t-4
Expected LowP vs. HighP LowP vs. Cont Failed vs. Cont
sign of Mean Median Mean Median Mean Median
difference (p-value) (p-value) (p-value) (p-value) (p-value) (p-value)
Abnormal accruals (+) 0.07 0.02 0.02 0.02 0.01 0.01
(0.01) (0.00) (0.05) (0.07) (0.91) (0.92)
Panel B: t-3
Expected LowP vs. HighP LowP vs. Cont Failed vs. Cont
sign of Mean Median Mean Median Mean Median
difference (p-value) (p-value) (p-value) (p-value) (p-value) (p-value)
Abnormal accruals (+) 0.05 0.04 0.02 0.02 0.00 –0.01
(0.00) (0.01) (0.09) (0.05) (0.27) (0.10)
Panel C: t-2
Expected LowP vs. HighP LowP vs. Cont Failed vs. Cont
sign of Mean Median Mean Median Mean Median
difference (p-value) (p-value) (p-value) (p-value) (p-value) (p-value)
Abnormal accruals (+) 0.04 0.04 0.03 0.02 0.00 –0.01
(0.00) (0.01) (0.06) (0.41) (0.12) (0.19)
Panel D: t-1
Expected LowP vs. HighP LowP vs. Cont Failed vs. Cont
sign of Mean Median Mean Median Mean Median
difference (p-value) (p-value) (p-value) (p-value) (p-value) (p-value)
Abnormal accruals (–) –0.05 –0.04 –0.05 –0.05 –0.04 –0.03
(0.02) (0.00) (0.01) (0.02) (0.00) (0.00)
Notes
Firms are classified as (1) Cont (continuing) if they do not go bankrupt during the period studied (1998–2004), (2) LowPif they go bankrupt and their ex-ante probability of failing is below 15%; or (3) HighPif they go bankrupt and their ex-ante probability of failing is equal to or above 15%. To compare failed and continuing firms, every failed firm-year is matched to the average abnormal accruals of continuing firms in the same in-dustry and year.
Reported p-values are for a one-tail test of differences, calculated using a t-test for the means, and a Wilcoxon test for the medians.
Abnormal accruals are abnormal working capital accruals as measured by the Kasznik (1999) model.
the ‘grey’ area.
Table 3, Panels A to D show the evolution of some basic financial indicators of LowP and HighP
firms from four years prior to bankruptcy (t-4) until the year prior to the event (t-1), where t is the year of bankruptcy. In year t-4 the only relevant difference between LowPand HighP firms is on their ex-ante probability of failure. However, as bankruptcy approaches (years t-3 to t-1), LowP
firms manage to stay more profitable (higher net income, cash flows and less negative accruals) than HighPfirms. This evidence could be consis-tent with LowP firms successfully manipulating their earnings upwards prior to bankruptcy.
Table 4 analyses the evolution of abnormal ac-cruals (calculated with the Kasznik, 1999 model), comparing LowP with continuing and HighP
firms, as well as continuing firms with all failed firms grouped together. To compare failed and continuing firms, every failed firm-year is matched to the average abnormal accruals of con-tinuing firms in the same industry and year. LowP
firms are expected to manage earnings more ag-gressively than HighP and continuing firms. If they manipulate their earnings successfully in the years preceding bankruptcy, it is expected that in the fourth, third and second years before the fail-ure event (i.e. t-4 to t-2) the difference in mean (median) AWCA will be positive. However, be-cause these firms end up being bankrupt, there should be a reversal of the previously manipulated accruals in the year just before bankruptcy (t-1), and thus, the difference in AWCAshould become negative in this last year. In accordance with our expectations, Table 4, Panels A to C show that the differences between LowPand HighPare signifi-cantly positive from t-4 to t-2. This is consistent with LowP firms manipulating earnings upwards in the years prior to failure. Also in line with our predictions, we can observe that the difference be-comes negative the year just before bankruptcy (t-1). The results of year t-1, with a larger reversal of accruals for LowP firms are consistent with larger income-increasing earnings management in prior years. These results also discard the alterna-tive explanation for the existence of the relaalterna-tively large number of LowPfirms that these firms are not real failures but voluntary liquidations.
The differences in AWCA between LowP and continuing firms presented in the middle column of Table 4 follow a similar pattern, albeit the sig-nificance is slightly lower. Overall, the evidence supports our hypothesis that managers of distressed companies engage in earnings management to conceal their poor performance and, as bankruptcy looms closer and no improvement in the situation is observed, they eventually exhaust their instru-ments for successful accrual manipulation, and an accumulation of bad news will be observed.
The last column of Table 4 shows the difference in AWCA between all failed firms (LowP and
HighPcombined) and continuing firms. The dif-ferences are not significant except for t-1, where negative accruals accumulate both for LowPand
HighPfirms. Thus, whilst LowPfirms show signs of having aggressive accounting policies in place,
HighPfirms are likely to have exhausted their re-sources for successful manipulation, having aver-age negative abnormal accruals (as shown on Table 2), compensating those of the LowP firms when all failed firms are pooled together. These re-sults might imply that HighP firms are being closely monitored by the market as obvious cases of distress companies, whilst the market might not monitor LowPfirms as closely, permitting a high-er degree of manipulation in these companies.
Our results are robust to the use of other models of discretionary accruals. Specifically, we use the modified Jones model (Dechow et al., 1995), and the original Jones (1991) model. The modified Jones model classifies all increases in debtors as discretionary accruals, consequently capturing both pure accounting manipulation and real activities manipulation. The Jones (1991) model captures only pure accounting manipulation, as it classifies all increases in debtors as normal accruals.
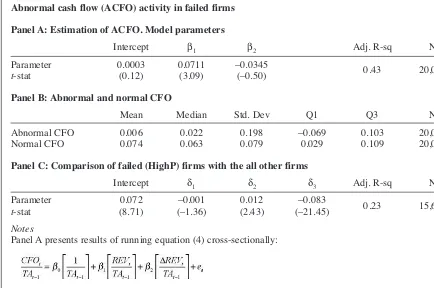
4.2. Real activities manipulation
Table 5, Panel A reports parameter estimates of running equation (4) to identify abnormally low cash flow levels relative to sales. We obtain results consistent with previous research by Roychowdhury (2006).16Table 5, Panel B reports descriptive statistics of normal (NCFO) and abnor-mal cash flow from operations (ACFO). These de-scriptive statistics are also consistent with previous research. Table 5, Panel C reports results of running equation (5) for sample firms. In accor-dance with our predictions, δ3 is significantly negative, consistent with failed firms having, on average, negative abnormal cash flows, given their reported levels of sales. HighP firms have the highest median level of sales of all firms in the sample (see Table 2); however, these sales do not create the expected level of cash flows. In fact, cash flows from operations in failed firms are abnormally low.
These results, combined with those of the prior section, provide some evidence consistent with the
16Whilst the calculation of abnormal accruals is a standard procedure in the literature, the calculation of abnormal cash flows (ACFO) is not yet so. Thus, we provide the results of running equation (4) and descriptive statistics of ACFO and NCFO. ACFO are calculated for the full sample of data avail-able (20,049 observations) to avoid biasing the estimates of normal and abnormal CFO. Equation (5) is run for the set of firms with full data to run our earnings management tests (15,654 observations, see Table 1 for details).