Contents list available at IJRED website, ISSN : 2252-4940
Int. Journal of Renewable Energy Development (IJRED)
Journal homepage: www.ijred.com
Wind Resource Assessment in Abadan Airport in Iran
Mojtaba Nedaei
*Dezful Branch, Islamic Azad University, Dezful, Iran
Article history:
Received Sep 13, 2012
Received in revised form Sep 19, 2012 Accepted September 29, 2012 Available online
ABSTRACT: Renewable energies have potential for supplying of relatively clean and mostly local energy. Wind energy generation is expected to increase in the near future and has experienced dramatic growth over the past decade in many countries. Wind speed is the most important parameter in the design and study of wind energy conversion systems. Probability density functions such as Weibull and Rayleigh are often used in wind speed and wind energy analyses. This paper presents an assessment of wind energy at three heights during near two years based on Weibull distribution function in Abadan Airport. Extrapolation of the 10 m and 40 m data, using the power law, has been used to determine the wind speed at height of 80 m. According to the results wind speed at 80 m height in Abadan is ranged from 5.8 m/s in Nov to 8.5 m/s in Jun with average value of 7.15 m/s. In this study, different parameters such as Weibull parameters, diurnal and monthly wind speeds, cumulative distribution and turbulence intensity have been estimated and analyzed. In addition Energy production of different wind turbines at different heights was estimated. The results show that the studied site has good potential for Installation of large and commercial wind turbines at height of 80 m or higher.
Keywords: Abadan, Iran, wind energy, wind resource, wind turbine, Weibull
* Corresponding author:
Email: [email protected] or [email protected]
1. Introduction
Energy is essential to economic and social development and improved quality of life in Iran, as in other countries. Because of the social and economic development of the country, the demand for energy, and particularly for electricity, is growing rapidly. The global wind power capacity has increased by a factor of 4.2 during the last five years. It has been estimated that roughly 10 million MW of energy are continuously available in the earth s wind while the total global installed capacity was 39,434 MW in 2004. Scientists and researchers began working on utilization of wind energy for electricity generation in Iran a decade ago. Based on calculations, Iran enjoys only a moderate supply of wind power, with some regions having continuous air flows with sufficient energy to produce electricity (the average wind velocity in such regions is measured at about 5 m/s). The potential capacity of wind power is figured at about 6500 MW for the country, mostly in the eastern sections. As a matter of
fact, this level of energy is considered to be of medium level among different countries; however, some locations in Iran are subjected to have strong winds to produce electricity. Considering the good potential of a well situated location, construction of the wind power stations began in 2003 in Iran [1].
Airport is processed in the next parts to assess the regional wind power potential [1].
Iran that is located in a low-pressure area on the one hand, and on the other hand, due to its proximity to high-pressure areas in north & northwest, generally it is affected by 2 kinds of wind [2]:
1. Winds that are blowing in winter from the Atlantic Ocean & Mediterranean sea and also central Asia. 2. Winds that are blowing in summer from Indian
Ocean & also from northwest.
In the year 2011 among 98 countries that they used wind energy, Iran was rated 43th [3]. Most of the
developed countries with similar wind energy potential to Iran are taking advantage of this phenomenon at an accelerating rate. Presently, more than 23 billion kWh of cheap and clean electricity are being produced annually across the globe. India power production utilizing wind energy is estimated around1000 MW. Germany produced some 4400 MW of electricity with wind. While Iran has a comparable level of available wind power, produces only 10 MW [4].
The wind resource is the most obvious factor to concentrate on when choosing a wind turbine location. The wind characterization in terms of speed, direction and wind power is the first step to obtain the initial feasibility of generating electricity from wind power through a wind farm, in a given region. In Iran, some relevant works have been developed in this aim:
Alamdari et al [5] analyzed wind speed data for 68 adopted and analyzed. It is found that the city is not an appropriate place for construction of large-scale wind power plants but is suitable for employment of off-grid electrical and mechanical wind driven systems. An economic evaluation was done in order to show feasibility of installing small wind turbines. Rahimzadeh et al [6] carried out a research about statistical study of 3 hourly wind data in Esfehan province based on Weibull distribution function. It was suggested that wind energy may be explored in Esfehan province by employing modern wind turbines that require lower start-up speeds. Saeidi et al [7] analyzed the wind data in one year based on Weibull model in two province of Iran, north & south Khorasan. Mostafaeipour [8] analyzed wind speed data over a period of almost 13 years between 1992 and 2005 from 11 stations in Yazd province in Iran, to assess the wind power potential at these sites. The results showed that most of the stations have annual average wind speed of less than 4.5 m/s which is considered as unacceptable for installation of the large-wind turbines. Mirhosseini et al [9] assessed the wind energy potential at five towns in province of Semnan in Iran using Weibull model. They used the
power law for extrapolation of 10 m data to determine the wind data at heights of 30 m and 40 m. Keyhani et al [1] analyzed three-hour period measured wind speed data of eleven years for the capital of Iran, Tehran at height of 10 m based on the Weibull model. Their study showed that, the studied site was not suitable for installing large-scale wind turbines. Mostafaeipour et al [10] carried out a statistical study of wind data based on Weibull distribution function in Manjil location in north of Iran. It was found that Manjil is one of the best locations in the world for establishing wind farms. Emami et al [11] presented a study about one year statistical analysis of wind data in Firouzkouh region using Weibull distribution function. The results show that this region, according to world classification of wind power, is in the 3rd class of power and has fairly
good conditions to install the wind turbines.
In this paper, wind data in Abadan Airport was analyzed to assess the wind energy potential and feasibility of installing wind turbines on the studied site.
1.1 Description of the studied site
1.1.1 Abadan Region
Abadan (30° 19' 55" N, 48° 18' 10" E, average elevation of 3 m) is a city in the Khuzestan province in southwest of Iran. It's 2796 km2 and it is located at 53
kilometers from the Persian Gulf, near the Iraq and Iran border. The city of Abadan is bordered from north by Shadegan region, from east and south, Persian gulf, from west and southwest ,Iraq country (between Iraq and Abadan is Aravand-rud waterway), from northwest, Khorramshahr. According to 2006 census, the population of Abadan was 217,988. Abadan is well-known for its refinery. It is one of the largest in the world [12]. Fig. 1 and 2 show map of Abadan in Iran. In Fig. 3 map of Abadan city in terms of some terrain features was provided from national geosciences database of Iran [13]. In addition, the position of data logger that was used for extraction of wind data for this study is shown on this map.
Fig. 1 Position of studied meteorological station in Iran (Red Balloon)
Fig. 2 Map of studied city, Abadan [13]
Fig. 3 Map of studied city in terms of some terrain features [13]
1.1.2 The climate of Abadan
North cold winds which mostly blow in the winter decrease the amount of temperature and sometimes northwest winds cause precipitation in this city. The average precipitation is estimated 193 mm. north winds are better appeared in Abadan in comparison with other winds. They come to Iran from Mediterranean ocean currents. The maximum temperature in Abadan is mostly between July and September and even gets up to upper than 50°C. The temperature difference between night and day is about 25 – 30°C [12].
2. Experimental Method
2.1 Weibull Probability Distribution Function
Statistical analysis can be used to determine the wind energy potential of a given site and estimate the wind energy output at this site. To describe the Statistical distribution of wind speed, various probability functions can be suitable for wind regimes. Weibull distribution is the best one, with an acceptable accuracy level. This function has the advantage of
making it possible to quickly determine the average of annual production of a given wind turbine [9]. The wind speed probability density function can be calculated as eq.1 [1]:
where f (v) is the probability of observing wind speed v, c is the Weibull scale parameter and k is the dimensionless Weibull shape parameter. The Weibull parameters k and c, characterize the wind potential of the region under study. Basically, the scale parameter, c, indicates how windy a wind location under consideration is, whereas the shape parameter, k, indicates how peaked the wind distribution is (i.e. if the wind speeds tend to be very close to a certain value, the distribution will have a high k value and is very peaked) [1].
2.2 Wind Power Density
Wind power density (WPD) is a truer indication of a site's wind energy potential than wind speed alone. Its value combines the effect of a site's wind speed distribution and its dependence on air density and wind speed.WPD is defined as the wind power available per
where n is number of records in the averaging interval, ρ is air density, vi3 is cube of the ith wind speed value.
Besides, calculation of wind power density based on the wind speed provided by field measurements can be developed by Weibull distribution analysis using the following form [4]:
smaller than or equal to a given wind speed, U. It is irregularities in the wind speed, direction, and vertical component. It is an important site characteristic because high turbulence levels may decrease power output and cause extreme loading on wind turbine components. The most common indicator of turbulence for siting purposes is the standard deviation σ of wind speed. Normalizing the value with the mean wind speed (U) gives the turbulence intensity (TI) and can be computational steps required to extrapolate the available wind speeds to the turbine hub height are given in Eqs.7 and 8. The basic equation of the wind shear power law is in eq.7[15]:
velocity at higher elevation zr, α is empirical wind shear
exponent. Therefore the value of α can be determined as eq.8 [15]:
2.6 Wind Turbine Energy Production
For a given wind regime probability distribution, P(U), and a known machine power curve, Pw(U), the
Therefore, with a summation over N, bins, the following expression can be used to find the average wind
Using Eq. (10) for the average wind machine power, it is possible to calculate the annual energy captured from
capacity factor, the energy generated (EI) by the turbine in a year is [4]: capacity factor can be calculated for one year having the annual power production of the wind turbine divided by the annual full power generation at rated power [4]. The capacity factor is the most effective parameter that indicates the power generation efficiency of the wind energy generator [15].
3. Results and Discussion
Wind data that has been extracted from Renewable Energies Organization of Iran (SUNA) [16] collected near 2 years from 2007 to 2009 in the time interval of 10 min and was analyzed by Windographer 2.5 software [17]. The average temperature was found 25.6°C. The wind data at 80 m was estimated using vertical extrapolation in Eq.7. The studied meteorological station is located in 30° 19' 55" N, 48° 18' 10" E and the average elevation is 3 m [16].
3.1 Wind speed patterns
speeds less than 5.5 m/s has not been observed in
Mean wind speeds with standard deviations and Weibull parameters at 80 m
At 40 m height the highest mean wind speed, Weibull k and Weibull c observed in Jun with values of 6.98 m/s, 2.64 and 7.83 m/s respectively. The highest standard deviation has occurred in Feb with value of 3.21 m/s. Monthly mean wind speeds at 40 m are ranged from 4.46 m/s in Nov to 6.98 m/s in Jun. In the months of Feb, Mar, May, Jun and July monthly mean wind speeds are upper than 6 m/s and therefore more wind energy can be captured by wind turbines. Possibility of monthly mean wind speeds less than 4 m/s has not been observed in Abadan airport at 40 m. According to the Table 1, Weibull c varies from 4.97 m/s in Nov to 7.83 m/s in Jun while Weibull k is ranged from 1.64 in Nov to 2.64 in Jun.
Table2
Mean wind speeds with standard deviations and Weibull parameters at 40 m
The annual mean wind speed is obtained 7.15 m/s, 5.81 m/s and 4.13 m/s at the heights of 80 m, 40 m and 10 m respectively. It is clear that Abadan site has an outstanding condition for development of wind energy
since the values of mean wind speed at each height are quite in good level.
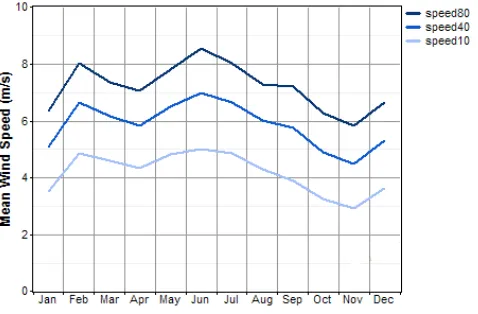
As a result of tables 1 and 2 monthly mean wind speed at heights of 80 m, 40 m and 10 m is plotted in fig. 4. It can be seen that wind speed patterns at 10 m, 40 m and 80 m heights are similar to each other. By looking at fig. 4 it is clear that at 10 m height monthly mean wind speeds are ranged from 2.9 m/s in Nov to 5 m/s in Jun. In the months of Feb, Mar, Apr May, Jun, July and Aug monthly mean wind speeds are upper than 4 m/s and therefore more wind energy can be captured by wind turbines. The highest standard deviation has occurred in Feb with value of 2.91 m/s. Possibility of monthly mean wind speed less than 3 m/s at 10 m height has observed only in Nov with value of 2.9 m/s.
Fig. 4 Monthly mean wind speed for studied region
Diurnal mean wind speed is demonstrated in fig. 5. This figure shows hours of day that have a suitable wind speed in all over the year. At 80 m best wind speeds almost occur at 6 pm - 7 am while for 40 m and 10 m heights they occur at 1 pm – 6 pm and 11 am – 5 pm respectively. Poor wind speeds at 80 m almost occur at 7 am – 6 pm while for 40 m height they occur at 6 am – 12 pm. As a result it can be concluded that for heights of 10 m and 40 m strong winds usually occur at daytime while for 80 m they mostly occur in the nighttime.
For the purpose of calculating seasonal mean wind speeds, the months in each of the four seasons in the northern hemisphere are generally divided as follows [4]: (a) winter: December, January and February; (b) spring: March, April and May; (c) summer: June, July and August and (d) autumn: September, October and November.
According to Table 1 for 80 m height it can be seen that in the winter from Dec to Feb, wind speed is ranged from 6.32 to 8 m/s. in the spring from March to May wind speed is ranged from 7.05 to 7.79 m/s. in the summer from June to August wind speed is ranged from 7.27 to 8.56 m/s. in the autumn from Sep to Nov wind speed is ranged from 5.81 to 7.19 m/s. As a result in the summer there is more potential of wind in Abadan Airport.
The higher heating demand in Abadan occurs from December to March, which can be grouped as the cold season. It is possible that wind energy could be applied as a supplement to the current gas or electricity heating, but more information is required for this purpose. From April to November is the warm season in Abadan airport. For the cold and warm seasons, the mean wind speed is calculated in Table 3 for Abadan Airport at three heights. It is clear that the mean wind speed in the warm season is a few higher than mean wind speed in the cold season for three heights of 10 m, 40 m and 80 m.
Table3
Seasonal mean wind speed for Abadan Airport at three heights
Height (m) Cold season Warm season
10 4.13 m/s 4.15 m/s
40 5.78 m/s 5.87 m/s
80 7.07 m/s 7.24 m/s
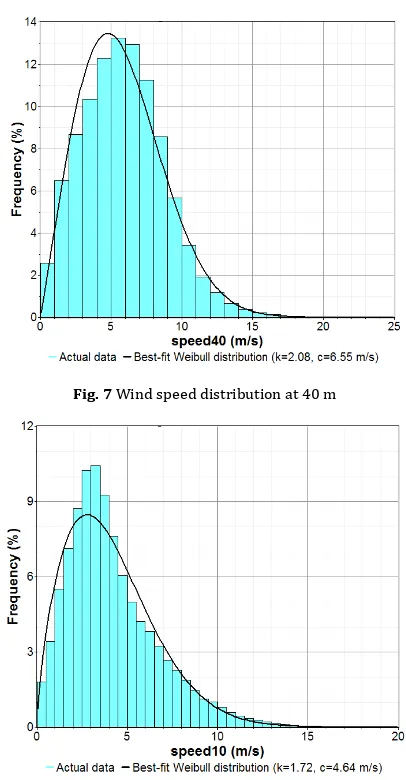
3.2 Wind Speed Distribution
Wind speed frequency distributions have been estimated using Weibull probability function.
Fig. 6 Wind speed distribution at 80 m
Fig. 7 Wind speed distribution at 40 m
Fig. 8 Wind speed distribution at 10 m
By looking at the graphical result, it can be seen from the Figs. 6 - 8 that the Weibull distribution fits actual distribution data well. Shape (k) and scale (c) values of the Weibull function were calculated and they can be seen in Figs. 6 - 8 for 80 m, 40 m and 10 m heights.
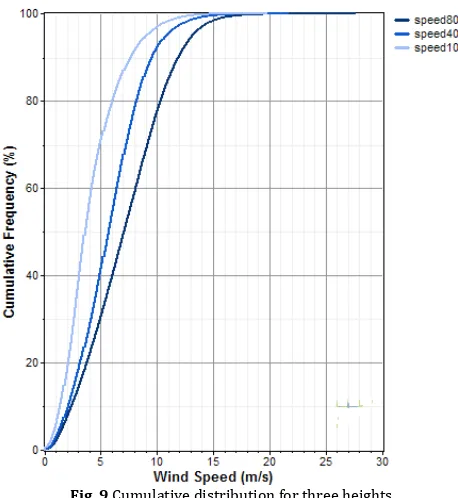
3.3 Cumulative Distribution
Fig. 9 Cumulative distribution for three heights
3.4 Wind Rose for Wind Direction
In wind data analysis the prediction of the wind direction is very important, especially in the time of planning the installation and the micro-siting of a wind turbine or a wind farm. A wind rose is a convenient tool for displaying the direction of the wind for siting analysis [9]. Fig. 10 shows wind rose at two heights of 30 m and 37.5 m for studied region. Mostly prevailing winds are from northwest.
Fig. 10 Wind rose at 30 m and 37.5 m heights
3.5 Turbulence Intensity
In the field of Wind resource assessment one of the most important parameters is the turbulence intensity. Turbulence intensity quantifies how much the wind varies typically within 10 minutes. Because the fatigue loads of a number of major components in a wind turbine are mainly caused by turbulence, the knowledge of the site s turbulence is very crucial. We have to distinguish between two different sources of turbulence intensity. Turbulence is generated by terrain features
(which is referred to as ambient turbulence intensity) as well as by neighbouring wind turbines (which referred to as induced turbulence (Fig. 11)). Sources of ambient turbulence are for example forests, hills, cliffs or thermal effects. Thus ambient turbulence can be reduced by avoiding critical terrain features. But the wake-induced turbulence has far more impact than the ambient turbulence intensity. Decreasing the spacing increases the turbulence induced by the wakes of neighbouring wind turbines meaning that there are limits to how close you can space the turbines. As a general rule the distance between wind turbines in prevailing wind direction should be a minimum of the equivalent of five rotor diameters. The spacing inside a row perpendicular to the main wind direction should be a minimum of three rotor diameters. Furthermore a steep slope might cause a negative gradient across some parts of the rotor (Fig. 12).
Fig. 11 Shadowing in wind farm [18]
Fig. 12 Distorted wind profile at steep slope (left) and behind a forest (right) [18]
Normally the wind speed increases with increasing height. In flat terrain the wind speed increases logarithmically with height. In complex terrain the wind profile is not a simple increase and additionally a separation of the flow might occur, leading to heavily increased turbulence. The resulting wind speed gradients across the rotor lead to high fatigue loads particularly on the yaw system. Obstacles like forest can have a similar effect on the wind profile and should be thus avoided [18]. In this study the diagram of turbulence intensity during near two years is plotted in fig.13. Maximum of turbulence intensity is shown 9 for 40 m height. In addition, the average of it is 0.11 and 0.16 at heights of 40 m and 10 m respectively.
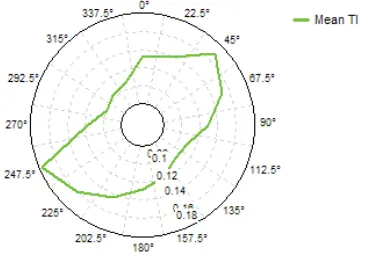
In Figs. 14 and 15, mean turbulence intensity at 40 m height versus wind direction at two direction sensors of 37.5 m & 30 m were plotted. It can be noted in fig.14, the maximum mean turbulence intensity occurred in direction sectors of 67.5° and 90° with value of 0.158. This wind rose also shows that in west and east the amount of turbulence intensity is higher than other directions. In Fig. 15 it can be seen that the maximum mean turbulence intensity occurred in direction sector of 247.5° with mean value of 0.178. It is clear that in this wind rose the amount of turbulence intensity in north-east and south-west is higher than other directions.
Fig. 14 Mean turbulence intensity at 40 m height vs. direction sensor of 37.5 m
Fig. 15 Mean turbulence intensity at 40 m height vs. direction sensor of 30 m
3.6 Wind Power Density
The estimation of the mean wind speed over a site is not a final step to assess the available wind potential in the considered site. Moreover, the value of the power density is an important parameter that can provide complementary information regarding the choice of suitable site, as well as an immediate classification of the site [19]. For this main reason, the wind power density available at Abadan airport has been computed. At 80 m height, wind power density is ranged from 272 W/m2 in Nov to 550 W/m2 in Jun. It can be understood
from fig.16 that in all months except Oct and Nov mean wind power density is higher than 300 W/m2. In the
months of Feb, May, Jun and July mean wind power density is higher than 400 W/m2. This shows that
Abadan site has good potential of wind power for using large and commercial wind turbines at height of 80 m or higher. At 40 m height, wind power density is ranged from 117 W/m2 in Nov to 317 W/m2 in Feb. It can be
seen that in months of Feb, Mar, May, Jun, July and Aug mean wind power density is upper than 200 W/m2. At
10 m height, mean wind power density is ranged from 39 W/m2 in Oct to 160 W/m2 in Feb. It can be seen that
in months of Feb, Mar, Apr, May, Jun, July and Aug mean wind power density is upper than 100 W/m2.
Fig. 16 Monthly wind power density at three heights
3.7 Wind Turbine Energy Production
In this part of study energy production of 10 wind turbines from different companies is compared at different heights. It should be mentioned that the wind speed at different heights is estimated using vertical extrapolation (Eq.7). Rotor diameter and Rated power for each wind turbine is shown in Table 4 [20 - 30]. All wind turbines have pitch control except Endurance G
and Proven kW that have stall control. The power curve of each wind turbine is plotted in Fig. 17 (some power curves are plotted for different air densities). As it is clear Proven kW has the cut-in wind speed of m/s while Acciona Aw / class
b , Nordex N / , AWE - , DeWind
(a) (b) (c)
(d) (e) (f)
(g) (h) (i)
(j)
Fig. 17. The power curve for (a) Acciona Aw 82/1500 class 111b [20]; (b) Endurance G-3120 [21]; (c) Nordex N117/2400 [22]; (d) Vestas V100-1.8MW [23]; (e) AWE 54-900 [24]; (f) DeWind D6 64 m [25]; (g) Enercon E101 [26]; (h) Mitsubishi MWT 92/2.4 [27]; (i) Proven 15 kW [28, 29];
(j) Suzlon S.52/600 [30]
As it can be seen at height of 105 m, wind speed is estimated 7.81 m/s. In Table 6 mean net energy output and capacity factor for each wind turbine is calculated. As it can be seen in table 6, maximum energy output occurred with value of MWh/yr for Enercon E1 at height of m. According to table it can be seen that energy production from the wind turbines
Acciona Aw / class b , Nordex
N / , Vestas V - . MW , Mitsubishi MWT
installation of wind turbines. As of April 2011, the Danish wind farm Horns Rev 2 (the world's largest when it was inaugurated in September 2009 comprising 91 Siemens SWT-2.3-93 wind turbines each of 2.3 MW) with a nominal total capacity of 209 MW, has the best capacity factor of any offshore wind farm at 46.7%. The record for an onshore wind farm is held by Burradale,
Acciona Aw 82/1500 class 111b 82 1500
Endurance G-3120 19.2 35
Nordex N117/2400 117 2400
Vestas V100-1.8MW 100 1800
AWE 54-900 54 900
Hub height wind speed for each wind turbine
Wind Turbine
Mean net energy output and capacity factor for each wind turbine
Wind Turbine
Acciona Aw 82/1500 class 111b 4562 34.7
Endurance G-3120 102 33.5
Nordex N117/2400 8775 41.7
Vestas V100-1.8MW 6584 41.8
AWE 54-900 2146 27.2 a result Abadan airport has an outstanding condition for development of large and commercial wind turbines. Therefore in order to utilize wind energy in Abadan, it is recommended to install large and commercial wind turbines for electricity supply. The three wind turbines
Nordex N / , Vestas V - . MW and
Enercon E due to their high values of energy production and capacity factor can be selected for
development of wind energy and production of electricity in Large-scale in Abadan Airport.
4. Conclusions
In this study, wind data at different heights in the time interval of 10 minutes was analyzed to determine the potential of the wind in Abadan Airport in Iran based on Weibull probability distribution function. The most important points are as follows:
1) The Weibull distribution presented in this paper indicates a good agreement with the data obtained from actual measurements.
2) The monthly mean wind speeds were found to range between 2.9-4.8 m/s, 4.4-6.9 m/s and 5.8-8.5 m/s for heights of 10 m, 40 m and 80 m
4) Wind Rose analysis showed that, prevailing wind directions are from north-west.
5) The mean power densities were found 387 w/m2,
208 W/m2 and 96 W/m2 for 80 m, 40 m and 10 m
heights respectively.
6) Wind energy extracted from 10 wind turbines was estimated. It is indicating a good potential of wind power at higher heights. At height of 105 m wind energy can be reached over 9640 MWh/yr. 7) Two years study of wind data in Abadan Airport
has showed that this site is suitable for installation and development of large and commercial wind turbines. The maximum wind turbine energy production and the highest capacity factor were calculated 9640 MWh/yr and 41.8% respectively. Therefore in order to utilize wind energy in Abadan, it is recommended to install large and commercial wind turbines for electricity supply.
Acknowledgement
The author is grateful to renewable energies organization of Iran (SUNA) for providing data for this study. The author would like to thank Mr. Ali Mostafaeipour and Mr. Mohammad Ali Behrang for their advice on this study.
References
[1] Keyhani A, Ghasemi-Varnamkhasti M, Khanali M, Abbaszadeh R (2010) an assessment of wind energy potential as a power generation source in the capital of Iran,Tehran. Energy 35(1): 188–201.
[2] Nedaei M (2012) Wind Energy Potential Assessment in Chalus County in Iran. Int. J. of Renewable Energy Research 2(2): 338 – 347.
[4] Mostafaeipour A, Sedaghat A, Dehghan-Niri AA, Kalantar V (2011) Wind energy feasibility study for city of Shahrbabak in Iran. Renewable and Sustainable Energy Review 15(6): 2545-2556.
[5] Alamdari P, Nematollahi M, Mirhosseini M (2012) Assessment of wind energy in Iran: A Review. Renewable and Sustainable Energy Reviews 16(1): 836-860.
[6] Rahimzadeh F, Noorian AM, Pedram M, Kruk MC (2011) Wind speed variability over Iran and its impact on wind power potential: a case study for Esfehan Province. Meteorological Applications 18(2): 198–210.
[7] Saeidi D, Mirhosseini M, Sedaghat A, Mostafaeipour A (2011) Feasibility study of wind energy potential in two provinces of Iran: North and South Khorasan. Renewable and Sustainable Energy Reviews 15(8): 3558-3569.
[8] Mostafaeipour A (2010) Feasibility study of harnessing wind energy for turbine installation in province of Yazd in Iran. Renewable and Sustainable Energy Reviews 14(1): 93-111. [9] Mirhosseini M, Sharifi F, Sedaghat A (2011) Assessing the wind
energy potential locations in province of Semnan in Iran. Renewable and Sustainable Energy Reviews 15(1): 449–459. [10] Mostafaeipour A, Abarghooei H (2008) Harnessing wind energy
at Manjil area located in north of Iran. Renewable and Sustainable Energy Reviews 12(6): 1758-1766.
[11] Emami N, Behbahani-nia A (2012) The Statistical Evaluation of Wind Speed and Power Density in the Firouzkouh Region in Iran. Energy Sources, Part A: Recovery, Utilization, and Environmental Effects 34(12): 1076-1083.
[12] Wikipedia, http://www.wikipedia.org Accessed 10 September 2012
[13] National Geosciences Database of Iran, www.ngdir.ir Accessed 10 September 2012.
[14] Google Earth Software, Available at
http://www.google.com/earth/index.html Accessed 10 September 2012.
[15] Ahmed S (2010) Wind energy theory and practice. PHI learning private limited, India.
[16] Renewable Energies Organization of Iran (SUNA), http://www.suna.org.ir Accessed 10 September 2012.
[17] Wind resource assessment software,
http://www.windographer.com Accessed 10 September 2012.
[18] World Wind Energy Association,
http://www.wwindea.org/technology/ch02/en/2_4_1.html Accessed 10 September 2012.
[19] Ouammia A, Dagdougui H, Sacile R, Mimet A (2010) Monthly and seasonal assessment of wind energy characteristics at four monitored locations in Liguria region (Italy). Renewable and Sustainable Energy Reviews 14 (7): 1959-1968.
[20] Acciona Wind Power Company, http://www.acciona.es/ Accessed 10 September 2012.
[21] Endurance Wind Power Company,
http://www.endurancewindpower.com/ Accessed 10 September 2012.
[22] Nordex Wind Power Company, http://www.nordex-online.com/ Accessed 10 September 2012.
[23] Vestas Wind Power Company, http://www.vestas.com/ Accessed 10 September 2012.
[24] AWE Wind Power Compnay, http://www.awe-wind.com/ Accessed 10 September 2012.
[25] DeWind Company, http://www.dewindco.com/ Accessed 10 September 2012.
[26] Enercon Wind Power Company, http://www.enercon.de/ Accessed 10 September 2012.
[27] Mitsubishi Heavy Industries, Ltd. http://www.mhi.co.jp/en/ Accessed 10 September 2012. [28] Angel Wind Energy Company, http://www.angelwindenergy.com/proven15.html Accessed 10 September 2012
[29] Idoha National Laboratory,
http://www.inl.gov/wind/software/powercurves/pc_proven.xl s Accessed 10 September 2012
![Fig. 1 Position of studied meteorological station in Iran (Red Balloon) [14]](https://thumb-ap.123doks.com/thumbv2/123dok/1132075.653823/2.595.320.539.565.730/fig-position-studied-meteorological-station-iran-red-balloon.webp)
![Fig. 2 Map of studied city, Abadan [13]](https://thumb-ap.123doks.com/thumbv2/123dok/1132075.653823/3.595.57.275.280.448/fig-map-studied-city-abadan.webp)
![Fig. 17 1.8MW . The power curve for (a) Acciona Aw 82/1500 class 111b [20]; (b) Endurance G-3120 [21]; (c) Nordex N117/2400 [22]; (d) Vestas V100-[23]; (e) AWE 54-900 [24]; (f) DeWind D6 64 m [25]; (g) Enercon E101 [26]; (h) Mitsubishi MWT 92/2.4 [27]; (i) Proven 15 kW [28, 29]; (j) Suzlon S.52/600 [30]](https://thumb-ap.123doks.com/thumbv2/123dok/1132075.653823/9.595.46.548.52.609/acciona-endurance-nordex-vestas-enercon-mitsubishi-proven-suzlon.webp)
