kang
INDO
BALA
REPO
THIRD Q
ONES
ANC
ORT
UARTER 2
SIA’S
E OF
2009
S
PAY
YMEN
NTS
Contact Address:
Balance of Payments Bureau
Directorate of Economic and Monetary Statistics Bank Indonesia
Sjafruddin Prawiranegara Tower, 16th
Floor Jl. M.H. Thamrin No. 2
Jakarta 10350
INDONESIA’S
BALANCE OF PAYMENTS
REPORT
THIRD QUARTER 2009
RINGKASAN ……… 1
SUMMARY INDONESIA’S BALANCE OF PAYMENTS IN Q3/2009 AND ITS CONTRIBUTING FACTORS ……… ……… 1 3 CURRENT ACCOUNT 1. Non-Oil and Gas Trade Balance ……… 7
1.1. Non-Oil and Gas Exports ……… 8
1.2. Non-Oil and Gas Imports ……… 11
2. Oil and Gas Trade Balance ……… 12
2.1. Oil ……… 13
2.2. Gas ……… 14
3. Services Account ……… 15
4. Income Account ……… 16
5. Current Transfers ……… 17
CAPITAL AND FINANCIAL ACCOUNT 1. Capital Account ……… 19
2. Financial Account ……… 20
2.1. Public Sector ……… 20
2.2. Private Sector ……… 24
RESERVE ASSETS ……… 29
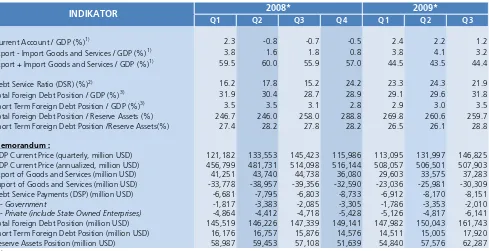
INDICATORS OF EXTERNAL SUSTAINABILITY ……… 31
LIST OF TABLES
Page Page
Table 1 Indonesia’s Balance of Payments and Several Economic Indicators in Q3/2009
5 Table 12 Import Value of Raw Materials Based on Country of Origin (C&F)
12
Table 2 Growth of Non-Oil and Gas Exports by Sector 8 Table 13 Import Value of Consumption Goods Based on Country of Origin (C&F)
12
Table 3 Growth of Major Export Commodities 8 Table 14 Import Value of Capital Goods Based on Country of Origin (C&F)
12
Table 4 Non-Oil and Gas Exports to Major Countries of Destination
9 Table 15 Oil Exports and Imports 13
Table 5 Copper Exports To Several Countries of Destination 9 Table 16 Demand and Supply of World Oil 13 Table 6 Coal Exports to Major Countries of Destination 9 Table 17 Indonesian Gas Reserves (billion cubic feet) 14 Table 7 CPO Exports to Major Countries of Destination 10 Table 18 Exports of LNG, LPG and Natural Gas 15 Table 8 Electronic Exports to Major Countries of Destination 10 Table 19 Non-Investment Grant 17 Table 9 Export of Chemical Products to Major Countries of
Destination
11 Table 20 Investment Grant 20
Table 10 Non-Oil & Gas Imports Based on Types of Goods 11 Table 21 Indicators of External Sustainability 31 Table 11 Non-Oil & Gas Import Based on Country of Origin 11
LIST OF CHARTS
Page Page
Chart 1 Current Account 7 Chart 18 Disbursement and Repayment of Government Loan
22
Chart 2 Non-Oil and Gas Trade Balance 8 Chart 19 Program Loan Disbursement 23 Chart 3 World Copper Price 9 Chart 20 Project Loan Disbursement 23 Chart 4 World Coal Price 10 Chart 21 Government Foreign Loan Position 23 Chart 5 World CPO Price 10 Chart 22 Loan Position by Major Creditor Countries 23 Chart 6 World Oil Price 14 Chart 23 Loan Position by Type of Major Currencies 24 Chart 7 Fuel Consumption 14 Chart 24 Financial Account of Private Sector 24 Chart 8 Services account 15 Chart 25 Foreign Direct Investment 25 Chart 9 Travel Services 16 Chart 26 Foreign Direct Investment Based on Country of
Origin
25
Chart 10 Income Account 16 Chart 27 Foreign Direct Investment based on Economic Sector
25
Chart 11 Workers’ Remittances 17 Chart 28 Oil & Gas Foreign Direct Investment 25 Chart 12 Capital and Financial Account by Type of
Investment
19 Chart 29 Non-Oil & Gas Foreign Direct Investment 26
Chart 13 Capital and Financial Account by Sector 20 Chart 30 Foreign Transaction in IDX and the Composite Index
26
Chart 14 Financial Account of Public Sector 20 Chart 31 Foreign Transaction in Private Sector Debt Securities
27
SUMMARY
In Q3/2009, the overall balance of payments recorded a surplus of USD3.5 billion, up from the USD1.1
billion surplus in Q2/2009. Positive contributions to this surplus came from both the current account as well as the
capital and financial account. In response, the international reserves position at end-Q3/2009 mounted to USD62.3
billion, a level equivalent to 6.1 months of imports and servicing of official external debt.
The current account posted a USD1.7 billion surplus in Q3/2009, lower than the Q2/2009 surplus of USD2.9
billion. The lower surplus is explained by reduced performance in the non-oil & gas trade balance and the oil trade
balance. Non-oil & gas exports forged ahead on the upward trend under way since the preceding quarter, bolstered
by strong demand in some Asian economies and rising international market prices for leading primary commodity
exports. However, the accelerated pace of domestic economic activity prompted a surge in non-oil & gas import
growth (16.3%, q.t.q) ahead of non-oil & gas exports (9.5%, q.t.q), resulting in a diminished non-oil & gas trade
balance surplus compared to one quarter earlier. Accelerated domestic economic activity and the seasonal factor of
the Eid-ul-Fitr festivities also led to increased consumption of oil-based fuels and imports of oil with a consequent
deficit in the oil trade balance. Nevertheless, the current account benefited from a heftier surplus in the gas trade
balance following commencement of production at the Tangguh gas field and increases in world oil prices.
Offsetting the reduced current account surplus was stronger performance in the capital and financial
account. During Q3/2009, the capital and financial account posted a USD3.0 billion surplus, after a USD2.2 billion
deficit in the preceding period. Key to this surplus was stronger performance in portfolio investment and other
investments. The steady improvement in domestic macroeconomic conditions combined with attractive interest rates
on rupiah-denominated instruments prompted higher portfolio capital inflows. In other investments, improved
outlook for the economy, easing of global liquidity conditions, and comparatively low international interest rates
have encouraged greater foreign borrowing by the private sector. Other investments also benefited from an
additional allocation of Special Drawing Rights (SDRs). This allocation is intended to bolster the international reserves
held by member countries in the International Monetary Fund (IMF), including Indonesia, as part of the efforts to
The global economic recovery contributed to the improvement in Indonesia’s Balance of Payments
in Q3/2009 that recorded a USD 3.5 billion surplus, higher than a USD 1.1 billion surplus in Q2/2009. This
positive performance was contributed by current account surplus of USD1.7 billion and capital and
financial accounts surplus of USD3.0 billion. The current account surplus contracted compared to the
surplus of preceding quarter. This was primarily due to the descending surplus of non oil/gas trade
balance in line with domestic economic growth acceleration causing non oil/gas imports grew higher than
non oil/gas exports. The decreased in current account surplus also stemmed from the increased deficit of
oil trade balance, services and income account as well as the descending current transfers surplus. The
declining surplus of current account was halted by the increase in gas trade balance surplus. Meanwhile
the performance of capital and financial account improved due to, among others, the growing portfolio
investment inflow. Capital and financial account improvement was also driven by decrease in other
investment deficit due to decrease in government foreign debt repayment, additional SDR allocation by
the IMF, as well as increase in private sector foreign debt disbursement . Following to the above
development, the amount of foreign reserves at end of the period rose to USD 62.3 billion or equivalent
to 6.1 months of imports and official debt service payments.
The development of Indonesia’s Balance of Payment during Q3/2009 was contributed by several
fundamental factors, both stemming from domestic and foreign aspects, such as:
• The global economy showed signs of recovery reflected from the economic growth of major trade
partners such as the US, Japan and the European Union that although still negative (y.o.y) but with a
declining tendency. In the meantime, several Asian countries such as China and India still posted
positive growth. Those countries continued their fiscal stimulus policy in the effort of economic
recovery acceleration. The improved economic performance of those trade partners positively
impacted Indonesian non oil/gas export performance.
• The global demand recovery supported the increased price of several major non oil/gas export
commodities, especially primary commodities. The expectation of global economy recovery promoted
the increase in world oil price that in turn boosted the prices of several other energy commodities
such as gas and coal. The development in the world’s oil price caused the Indonesian crude export
price (average unit price) in Q3/2009 rose to USD 66.5/bl from USD 56.9/bl in previous quarter. The
fluctuation of USD exchange rate against other major currencies also affected world oil price
INDONESIA
’
S BALANCE OF PAYMENTS IN Q3/2009 AND ITS
movement. In line with this increase, LNG price also rose from USD 6.3/MBTU in Q2/2009 to USD
8.2/MBTU during the reporting period.
• In line with the global economy recovery, Indonesian economy in Q3/2009 grew by 4.2%, higher than
4.0% in the previous quarter. By sectors, transportation and communication gave the biggest
contribution to economic growth in Q3/2009 followed by mining, construction, finance and services.
From demand side, consumption still provided considerable support to economic growth. In addition
to the improved consumer’s income and the low inflation rate prospects, the high rate of private
consumption was presumed related to Eid ul-Fitr festivities taking place during the period. This
situation accelerated the import growth especially imports of non oil/gas.
• Inflation rate was 2.8% in Q3/2009, lower than 3.7% in the preceding quarter. This condition was in
line with domestic demand that although increased, but was still considered insufficiently strong. The
appreciation of rupiah during the reporting period contributed to the low inflation rate. In line with
this and in order to boost domestic economic growth, Bank Indonesia mitigated monetary policy by
lowering BI rate. Nevertheless, the spread of domestic and foreign interest rates was still wide enough
to maintain, even increase, the high appeal of foreign portfolio investor.
• The strengthening world demand and the increasing gas production from Tangguh field gave a
positive impact to LNG export volume that rose to 243.7 MBTU, higher than 228.1 MBTU in the
preceding period. Oil production in Q3/2009 reached 0.943 barrel per day (bpd), slightly higher than
the previous period (0.941 bpd) but it was still below government target of 0.960 bpd for 2009.
Apart from natural decline due to old oil fields condition that have passed their optimal limits, several
technical problems were considered as contributing factors to oil production slow recovery. In the
meantime, in line with the increasing domestic economic growth and Eid ul-Fitr festivities, fuel
consumption in Q3/2009 reached 88.3 million barrels, higher than the preceding period (84.5 million
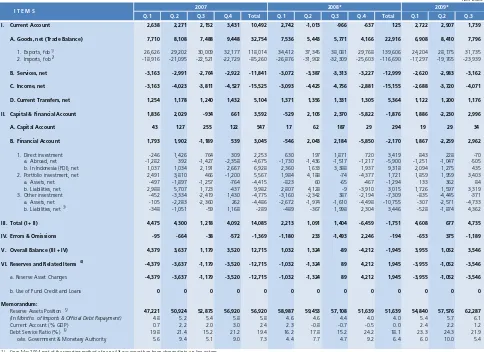
Table 1
Indonesia’s Balance of Payments and
Several Economic Indicators in Q3/2009
Q1 Q2 Q3 Q4 Q1 Q2 Q3
WORLD ECONOMIC INDICATORS
Economic Growth
‐ United States of America % (y.o.y) 2.1 2.0 1.6 0.0 ‐1.9 ‐3.3 ‐3.8 ‐2.3
‐ Japan % (y.o.y) 2.3 1.3 0.6 ‐0.3 ‐4.3 ‐8.6 ‐7.0 ‐4.5
‐ European Union % (y.o.y) 2.8 2.2 1.5 ‐0.4 ‐1.8 ‐2.5 ‐0.2 0.4
‐ Singapore % (y.o.y) 7.8 6.7 2.5 0.0 ‐4.2 ‐9.5 ‐3.3 0.6
‐ China % (y.o.y) 13.0 10.6 10.1 9.0 6.8 6.1 7.1 7.7
World Price Commodity
‐ Crude Oil (OPEC) USD/barel 69.1 92.5 117.5 113.8 53.1 42.9 58.7 67.6
‐ Coal USD/metric ton 66 114 139 163 93 72 66 71
‐ Copper USD/metric ton 7,118 7,796 8,443 7,680 3,905 3,428 4,663 5,859
‐ CPO USD/ton 780 1,156 1,198 928 512 577 743 679
‐ Rubber cent USD/kg 248 293 312 329 203 166 187 221
International Interest Rates ¹⁾
‐ United States of America % (y.o.y) 5.1 3.2 2.1 2.0 1.1 0.25 0.25 0.25
‐ Japan % (y.o.y) 0.5 0.6 0.5 0.5 0.3 0.1 0.1 0.1
‐ European Union % (y.o.y) 3.9 4.0 4.0 4.3 3.2 1.8 1.1 1.0
‐ Singapore % (y.o.y) 2.7 1.5 1.3 1.4 1.0 0.7 0.7 0.7
‐ China % (y.o.y) 6.8 7.5 7.5 7.4 5.9 5.3 5.3 5.3
Inflation ²⁾
‐ United States of America % (y.o.y) 4.1 4.0 5.0 4.9 0.1 ‐0.4 ‐1.4 ‐1.3
‐ Japan % (y.o.y) 0.7 1.2 2.0 2.1 0.4 ‐0.3 ‐1.8 ‐2.2
‐ European Union % (y.o.y) 3.1 3.6 4.0 3.6 1.6 0.6 ‐0.1 ‐0.3
‐ Singapore % (y.o.y) 4.4 6.7 7.5 6.7 4.3 1.6 ‐0.5 ‐0.4
‐ China % (y.o.y) 6.5 8.3 7.1 4.6 1.2 ‐1.2 ‐1.7 ‐0.9
DOMESTIC ECONOMIC INDICATORS
GDP % (y.o.y) 6.3 6.2 6.4 6.4 5.2 4.4 4.0 4.2
CPI Inflation ²⁾ % (y.o.y) 6.6 7.1 11.0 12.1 11.1 7.9 3.7 2.8
Exchange Rates ¹⁾ (Rp/USD) 9,136 9,260 9,264 9,219 11,023 11,630 10,532 10,002
Average Price of Crude Oil Export USD/barel 70.1 93.4 119.3 113.4 48.0 41.8 56.9 66.5
Oil Production mbpd 0.952 0.977 0.981 0.982 0.967 0.962 0.941 0.943
Fuel Consumption mbpy 382.8 95.4 99.0 100.8 86.3 80.7 84.5 88.3
Gas Export (LNG) mbtu 1,080 284 253 259 272 257 228 244
Gas Export Average Price (LNG) USD/mbtu 9.0 11.5 12.8 14.3 8.8 5.5 6.3 8.2
BI Rate 1) % (annual) 8.6 8.0 8.3 9.0 9.4 8.25 7.25 6.58
INDONESIAN BALANCE OF PAYMENTS
‐ Current Account million USD 10,493 2,742 ‐1,013 ‐966 ‐637 2,722 2,907 1,739
‐ Capital and Financial Account million USD 3,591 ‐529 2,105 2,370 ‐5,822 1,886 ‐2,230 2,996
‐ Total million USD 14,085 2,213 1,094 1,404 ‐6,459 4,608 677 4,735
‐ Net Errors and Omissions million USD ‐1,370 ‐1,180 231 ‐1,493 2,246 ‐653 375 ‐1,189
‐ Overall Balance million USD 12,715 1,032 1,324 ‐89 ‐4,212 3,955 1,052 3,546
‐ Foreign Exchange Reserves million USD 56,920 58,987 59,453 57,108 51,639 54,840 57,576 62,287
Source: CEIC, IMF, World Bank, Bank Indonesia, and other sources
¹⁾ an interest rate policy sets by central bank / monetary authority (calculated as the average monthly) ²⁾ end‐month position of the relevant quarter
The current account in Q3/2009 recorded a USD
1.7 billion surplus, lower than USD 2.9 billion surplus in
Q2/2009. This declining surplus was stemmed from the
weakening performance of non-oil & gas and oil trade
balances. Other current account components i.e.
services, income, and current transfers also recorded a
decreasing performance. However, the declining surplus
of current account was slightly offset by the increasing
gas trade balance surplus.
Chart 1 Current Account
Non oil & gas trade balance posted a surplus lower
than the preceding quarter in line with the acceleration
of domestic economic activities which boosted non oil &
gas imports to grow faster than non oil & gas export.
This acceleration accompanied by Eid-ul-Fitr seasonal
factors contributed to the hike of fuel consumption and
oil imports thus consequently generating deficit in oil
trade balance. In the meantime, the increased gas trade
balance surplus was influenced by the rise in gas export
price and volume pursuant to the production of
Tangguh gas field and the hike of world oil price.
The upturn in income balance deficit was due to
the hike of dividend payments to foreign portfolio
investors pursuant to the improving listing company
performance in the preceding year. Services balance
deficit slightly increased from the previous quarter and
was dominated by the increasing of transportation
expenses due to the strengthening of imported goods.
Meanwhile, the decreasing surplus of current transfer
balance was due to a slight inflow drop of workers’
remittance.
1. Non-Oil and Gas Trade Balance
In Q3/2009, non-oil & gas trade balance recorded a
USD5.9 billion surplus, lower than a USD6.4 billion
surplus in Q2/2009. The decreased surplus was due to a
steeper increase of non-oil & gas import growth
(16.3%, q.t.q) than non-oil & gas exports (9.5%, q.t.q).
Domestic economy posted a positive growth of
4.2% (y.o.y) in Q3/2009, higher than the preceding
period (4.0%, y.o.y). Economic growth was mainly due
to private consumption that influenced the hike of
non-oil & gas import. The annual growth of non-non-oil & gas
imports improved from 27.0% (y.o.y) in Q2/2009 to
-19.6% (y.o.y) in this period. The performance of non-oil
& gas exports also improved from 14.8% (y.o.y) to
-9.6% (y.o.y). -5,000
-3,000 -1,000 1,000 3,000 5,000 7,000 9,000
Q.1 Q.2 Q.3 Q.4 Q.1 Q.2 Q.3 Q.4 Q.1 Q.2 Q.3
2007 2008* 2009*
million USD
Services Income Trade Balance Current Trans. Current Account
Chart 2
Non-Oil and Gas Trade Balance
1.1.Non-Oil and Gas Exports
In Q3/2009, non-oil & gas export improved to
USD26.0 billion compared to USD23.8 billion in the
preceding quarter.
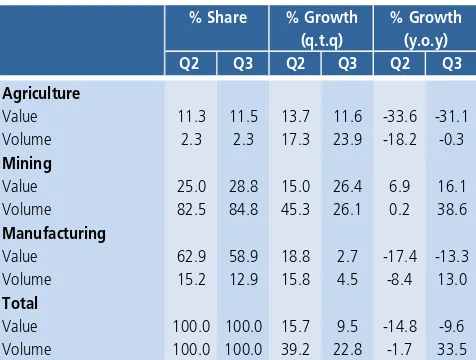
The strengthening performance of export value was
mainly related to mining products which increased by
26.4% from the previous quarter. Exports of major
mining commodities, such as coal and copper, increased
mainly in terms of volume in line with the increasing
world demand, especially China. Meanwhile, exports of
agricultural and manufacturing products also posted a
positive growth of 11.6% and 2.7%, respectively.
The improved export performance of the above
three sectors was also reflected on their annual growth.
Mining sector recorded a growth of 16.1% (y.o.y)
compared to 6.9% (y.o.y) in the preceding period.
Despite the negative growth of 31.1% (y.o.y),
agricultural sector showed an improvement compared
to the previous year (-33.6%, y.o.y). Manufacturing
sector still recorded a negative growth of 13.3% (y.o.y)
but not as high as in the preceding quarter (-17.4%,
y.o.y).
Table 2
Growth of Non-Oil and Gas Exports by Sector
The improving performance of non-oil & gas export
value was also reflected in the development of 10 major
commodities. In Q3/2009, almost all major commodities
of non-oil & gas exports, except machinery and
mechanic, recorded an increase compared to the
previous quarter. Five commodities posted a
strengthening annual growth. They are among others,
copper, coal, CPO, chemical and electronic products.
Demand on the above mentioned commodities mainly
came from Asian countries and partly from developed
countries pursuant to the improving economic
performance in those countries.
Table 3
Growth of Major Export Commodities 1,000 2,000 3,000 4,000 5,000 6,000 7,000 8,000 3,000 8,000 13,000 18,000 23,000 28,000 33,000 38,000
Q.1 Q.2 Q.3 Q.4 Q.1 Q.2 Q.3 Q.4 Q.1 Q.2 Q.3
2007 2008* 2009*
million USD million USD
Export Import Trade Balance (RHS)
Q2 Q3 Q2 Q3 Q2 Q3
Agriculture
Value 11.3 11.5 13.7 11.6 -33.6 -31.1
Volume 2.3 2.3 17.3 23.9 -18.2 -0.3
Mining
Value 25.0 28.8 15.0 26.4 6.9 16.1
Volume 82.5 84.8 45.3 26.1 0.2 38.6
Manufacturing
Value 62.9 58.9 18.8 2.7 -17.4 -13.3
Volume 15.2 12.9 15.8 4.5 -8.4 13.0
Total
Value 100.0 100.0 15.7 9.5 -14.8 -9.6
Volume 100.0 100.0 39.2 22.8 -1.7 33.5
% Share % Growth % Growth
(q.t.q) (y.o.y)
Q2 Q3 Q2 Q3 Q2 Q3 Q2 Q3
Copper ‐4.3 41.3 ‐19.2 18.1 7.0 108.1 57.0 193.7
Nickel ‐53.1 29.6 137.3 27.0 ‐79.4 ‐79.7 ‐23.3 136.7
Coal 39.5 23.5 78.6 26.1 42.1 49.7 7.8 48.4
CPO 38.6 16.9 11.5 16.0 ‐29.1 21.9 17.4 90.0
Electrical Appliances 24.2 14.5 21.1 13.3 8.2 15.9 ‐1.6 4.8
Rubber 17.8 13.6 19.2 0.6 ‐56.3 ‐56.4 ‐15.7 ‐16.1
Chemical Product 24.5 7.6 28.5 ‐3.4 ‐16.4 ‐15.2 ‐42.6 ‐5.9
Paper 4.2 5.7 ‐1.5 ‐5.7 ‐27.7 ‐28.9 1.0 ‐16.8
Textile & Tex. Prod 5.9 5.0 12.4 ‐0.7 ‐11.6 ‐13.2 ‐0.9 ‐4.5
Machinery & Mechanic 19.5 ‐27.0 5.4 ‐30.4 ‐13.1 ‐46.9 ‐22.5 ‐57.0
% Growth (q.t.q) % Growth (y.o.y)
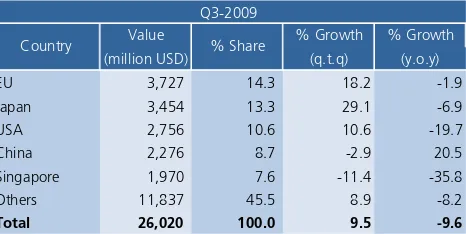
Non-oil & gas exports to Japan recorded the
highest growth of 29.1% (share 13.3%) compared to
the preceding period, followed by export to European
Union (grew by 18.2%, share 14.3%) and the US (grew
by 10.6%, share 10.6%). On annual basis, however,
the non-oil & gas export performance to almost all
major countries of destination still recorded a
downturn, except to China which recorded an increase
of 20.5% (share 8.7%).
Table 4
Non-Oil and Gas Exports to Major Countries of Destination
Copper
In Q3/2009 copper exports reached USD2.1 billion
or grew by 41.3% from the preceding quarter. This
growth was contributed by both price and volume
factors. During this period copper price reached
USD5,859/Mton, higher than the preceding quarter
(USD4,663/Mton). Copper export volume rose by
18.1% (q.t.q) in line with the growing demand,
especially from Japan, South Korea and Malaysia.
Chart 3 World Copper Price
Compared to the same period in the previous year,
copper export performance recorded a positive growth
by 108.1% (y.o.y), far higher than 7% (y.o.y) in the
preceding period.
Table 5
Copper Exports to Several Countries of Destination
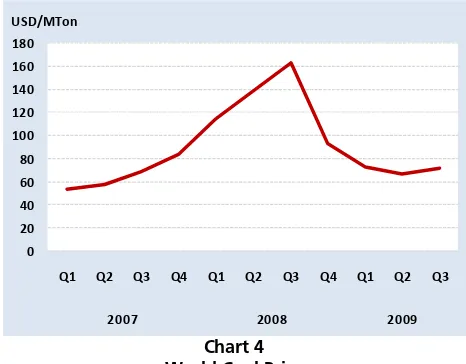
Coal
In Q3/2009 coal export value reached USD4.4
billion or grew by 23.5% from the preceding quarter.
This growth was supported by the increase of export
volume by 26.1% (q.t.q). China’s dependency on coal
in fulfilling this country’s demand of steam power was
still high. Besides China, the main destinations of coal
export were Japan, South Korea, India and Taiwan.
Coal export value also showed a growing trend
compared to the same period in the previous year. In
Q3/2009, coal export grew by 49.7% (y.o.y), higher
than 42.1% (y.o.y) in the preceding year.
Table 6
Coal Exports to Major Countries of Destination
World economic recovery increased the demand on
energy products including coal, which affected the hike
of its price to USD71.31/Mton, higher than the
preceding period (USD66.48/MTon). This rise was in line
Value % Growth % Growth
(million USD) (q.t.q) (y.o.y)
EU 3,727 14.3 18.2 -1.9 Japan 3,454 13.3 29.1 -6.9 USA 2,756 10.6 10.6 -19.7 China 2,276 8.7 -2.9 20.5 Singapore 1,970 7.6 -11.4 -35.8 Others 11,837 45.5 8.9 -8.2
Total 26,020 100.0 9.5 -9.6
Q3-2009
Country % Share
3,000 4,000 5,000 6,000 7,000 8,000 9,000
Q1 Q2 Q3 Q4 Q1 Q2 Q3 Q4 Q1 Q2 Q3
2007 2008 2009
USD/MTon
Value % Growth % Growth (million USD) (q.t.q) (y.o.y) Japan 874 41.1 65.8 299.4 South Korea 243 11.4 19.9 256.2 Malaysia 210 9.9 72.6 36.7 Others 799 37.6 22.2 37.5 Total 2,127 100.0 41.2 108.1
Q3-2009
Country % Share
Value % Growth % Growth
(million USD) (q.t.q) (y.o.y)
Japan 907 20.7 57.2 47.1 China 570 13.0 51.8 122.3 South Korea 565 12.9 11.3 66.7 Taiwan 542 12.4 9.9 17.3 India 529 12.1 -8.7 70.2 Others 2,333 53.3 12.0 36.4 Total 4,374 100.0 23.5 49.7
Q3-2009
with the growing oil price as coal was considered as an
alternative energy commodity.
Chart 4 World Coal Price
CPO
In Q3/2009 CPO exports reached USD2.7 billion or
grew by 16.9% from the previous quarter. The
strengthening export value was in line with the increase
of export volume by 16% (q.t.q). The cancellation of
rise in import duty in India and the celebration of Idul
Fitri in India, Pakistan, Bangladesh and Middle East had
also affected CPO demand. The improving CPO export
performance was also reflected on its annual growth.
CPO exports in this period experienced a significant
growth by 21.9% (y.o.y) in contradiction with the
previous quarter (-29.1%, y.o.y).
Table 7
CPO Exports to Major Countries of Destination
Despite a significant increase in export volume,
CPO export price experienced a decrease. The average
CPO price in Q3/2009 was USD679/MTon, slightly
than the previous quarter (USD743/MTon). According
to Association of Crude Palm Oil Producers (GAPKI), the
decrease of CPO price was due to the increasing supply
from Malaysia and Indonesia. In line with CPO price
drop, the government decreased the export duty from
3% to 0% starting August 2009. This decision refers to
price development in Rotterdam market that reached
USD 674.84/MTon in August 2009, below the price
reference of USD750/MTon.
Chart 5 World CPO Price
Electronic
Export of electronic products reached USD2.9
billion in Q3/2009 or grew by 14.5% from the
preceding quarter. This increase was mainly driven by
the export of digital camera and video player destinated
to European Union and East Asia. The major countries
of electronic export destination were Singapore
(20.2%), European Union (18.5%) and the US (15.4%).
Table 8
Electronic Exports to Major Countries of Destination
0 20 40 60 80 100 120 140 160 180
Q1 Q2 Q3 Q4 Q1 Q2 Q3 Q4 Q1 Q2 Q3
2007 2008 2009
USD/MTon
Value % Growth % Growth
(million USD) (q.t.q) (y.o.y)
India 872 31.8 13.8 -2.9
EU 549 20.0 78.2 81.2
China 414 15.1 -5.6 190.1
Others 905 33.0 9.0 0.0
Total 2,740 100.0 16.9 21.9
Q3-2009
Country % Share
0 200 400 600 800 1,000 1,200 1,400
Q1 Q2 Q3 Q4 Q1 Q2 Q3 Q4 Q1 Q2 Q3
2007 2008 2009
USD/MTon
Value % Growth % Growth (million USD) (q.t.q) (y.o.y)
Singapore 579 20.2 9.9 -22.6
EU 531 18.5 18.3 69.6
USA 442 15.4 14.8 53.4
Others 1,317 45.9 13.8 -46.8
Total 2,868 100.0 14.5 15.9 Q3-2009
The performance of electronic exports showed an
improvement compared to the previous year reflected
by the annual growth of 15.9% (y.o.y) or higher than
8.2% (y.o.y) in the preceding period.
Chemical Products
Export of chemical products in Q3/2009 reached
USD 1.7 billion or grew by 7.6% compared to the
preceding quarter. This increase was mainly driven by
price factor while the volume recorded a decrease of
3.4% from the previous quarter. The main export
destinations were China, European Union and Malaysia.
The improved export performance of chemical
products was also reflected in the annual growth of
negative 15.2% (y.o.y), better than the preceding
period (-16.4%, y.o.y).
Table 9
Exports of Chemical Products to Major Countries of Destination
1.2.Non-Oil & Gas Import
In Q3/2009 non-oil & gas import experienced a
steeper increase by recording a growth of 16.3%
(q.t.q), higher than 14% (q.t.q) in Q2/2009. This
growth was related to import of consumption goods,
raw material as well as capital goods.
Table 10
Non-Oil & Gas Imports Based on Types of Goods
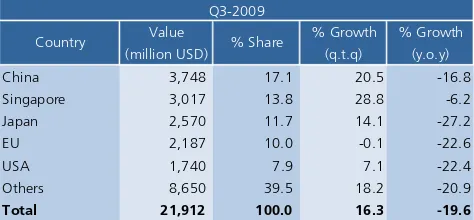
Non-oil & gas imports in Q3/2009 reached USD20.1
billion, higher than USD17.3 billion in the preceding
quarter. The imported goods were mainly from China,
Singapore, Japan, European Union and the US.
Table 11
Non-Oil & Gas Import Based on Country of Origin
Import of Raw Materials
In Q3/2009 import of raw materials reached
USD14.2 billion or grew by 16.7% compared to the
preceding period. Demand recovery of imported raw
material was also reflected from the annual growth.
Value % Growth % Growth (million USD) (q.t.q) (y.o.y)
China 248 15.0 23.4 75.0
EU 183 11.0 10.9 -14.1
Malaysia 141 8.5 5.9 -26.7
Others 1,088 65.5 4.2 -22.9
Total 1,660 100.0 7.6 -15.2 Q3-2009
Country % Share
Q2 Q3 Q2 Q3 Q2 Q3
Consumption Goods
Value 7.8 8.1 18.6 20.8 -37.5 -34.5 Volume 5.4 5.0 3.7 9.9 -28.9 -23.1 Raw Material
Value 64.4 64.7 15.6 16.7 -34.6 -24.2 Volume 90.4 91.0 42.7 18.8 -19.9 1.0 Capital Goods
Value 27.0 26.2 9.5 13.1 7.2 2.3 Volume 4.2 4.0 -5.6 13.1 -10.7 -5.4 Total
Value 100.0 100.0 14.0 16.3 -27.0 -19.6 Volume 100.0 100.0 37.0 18.1 -20.1 -0.8 % Share % Growth % Growth
(q.t.q) (y.o.y)
Value % Growth % Growth
(million USD) (q.t.q) (y.o.y)
China 3,748 17.1 20.5 -16.8
Singapore 3,017 13.8 28.8 -6.2 Japan 2,570 11.7 14.1 -27.2
EU 2,187 10.0 -0.1 -22.6
USA 1,740 7.9 7.1 -22.4 Others 8,650 39.5 18.2 -20.9
Total 21,912 100.0 16.3 -19.6
Q3-2009
Despite recording an ongoing minus rate (-24.2%),
it was not as steep as in the previous quarter (-34.6%).
The growing demand on imported raw materials was in
line with the condition of manufacturing sector which
was estimated to recover after the global economic
crisis.
The highest growth of raw materials imports was
from China (14.2%), followed by Singapore (12.4%)
and Japan (12.3%). Major raw materials import
commodities recorded positive growth include animal
feed, steel raw material and electrical equipment. The
growing demand of steel raw material was considered
related to the rise in investment in property sector.
Table 12
Import Value of Raw Materials Based on Country of Origin (C&F)
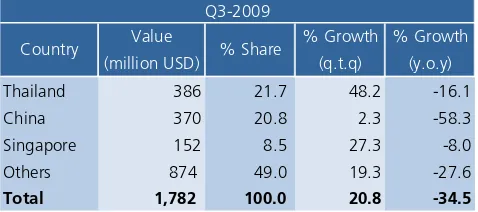
Import of Consumption Goods
In Q3/2009 imports of consumption goods reached
USD1.8 billion or grew by 20.8% compared to the
preceding quarter. This increase was considered related
to Ramadhan and Eid ul-Fitr celebration reflecting hike
in food, beverage and clothes consumption. This
development was in line with the consumption increase
on GDP in Q3/2009.
The annual growth of consumption goods imports
also increased to minus 34.5% (y.o.y) compared to
minus 37.5% (y.o.y) in the preceding period.
Imports of consumption goods were mainly from
Thailand (share 21.7%), China (20.8%) and Singapore
(8.5%).
Table 13
Import Value of Consumption Goods Based on Country of Origin (C&F)
Import of Capital Goods
Import of capital goods in Q3/2009 reached
USD5.8 billion or grew by 13.1% from the preceding
period. The annual growth of capital goods, however,
showed a downturn to 2.3% (y.o.y) from 7.2% (y.o.y)
in the previous quarter.
Imports of capital goods were mainly from China
(share 23.2%), Singapore (18.7%) and Japan (12.3%).
Table 14
Import Value of Capital Goods Based on Country of Origin (C&F)
2. Oil & Gas Trade Balance
In Q3/2009, oil and gas trade balance still provided
a positive contribution to the development of overall
trade balance by posting a USD2.0 billion surplus or
relatively equal to the surplus recorded in Q2/2009
(USD2.0 billion). Despite this equivalent surplus, the
trade balance composition was different with higher
gas surplus and oil deficit.
Value % Growth % Growth
(million USD) (q.t.q) (y.o.y)
China 2,010 14.2 19.2 -18.9 Singapore 1,762 12.4 30.6 -27.4 Japan 1738 12.3 14.3 -31.2 Others 8,661 61.1 14.2 -23.1 Total 14,171 100.0 16.7 -24.2
Q3-2009
Country % Share
Value % Growth % Growth (million USD) (q.t.q) (y.o.y)
Thailand 386 21.7 48.2 -16.1
China 370 20.8 2.3 -58.3
Singapore 152 8.5 27.3 -8.0
Others 874 49.0 19.3 -27.6
Total 1,782 100.0 20.8 -34.5 Q3-2009
Country % Share
Value % Growth % Growth (million USD) (q.t.q) (y.o.y)
China 1,332 23.2 28.0 20.9 Singapore 1,075 18.7 25.5 79.7
Japan 707 12.3 14.3 -20.3
Others 2,636 45.8 2.5 -13.1
Total 5,750 100.0 13.1 2.3 Q3-2009
A growing surplus was recorded in gas trade
balance driven by gas price development while LNG
export volume showed a climbing tendency. Meanwhile
oil import was larger than oil export in response to
domestic demand acceleration related to Eid ul-Fitr
seasonal factor.
2.1. Oil
After recording a surplus of USD68 million in
Q2/2009, oil trade balance experienced a USD779
million deficit in Q3/2009 pursuant to oil import
increase. This trend was related among others to the
growth of fuel consumption before and during Eid
ul-Fitr period.
Table 15 Oil Exports and Imports
Oil exports during the reporting period rose to
USD3.0 billion or grew by 23.1% compared to the
preceding quarter. This mounting trend was mainly
driven by oil price that recording a growth of 18%
while a slight increase was also recorded (around 5%
for crude oil and 1% for oil product) in terms of
volume.
Refinery product exports experienced a slight
increase from 9.9 million barrel in Q2/2009 to 10.0
million barrel in the reporting period with a value
amounting to USD761 million. This export was largely
destinated to Asian countries such as Malaysia, Japan,
Korea, Singapore and China. Crude oil export volume
increased from 31.6 million barrel to 33.1 million barrel
followed by the hike of export value from USD1.8
billion to USD2.2 billion. This exported was mainly to
Australia, Japan, China and Korea and the types of
crude oil exported included SLC, Duri, Senipah and
Belanak.
Oil imports in Q3/2009 recorded a significant
increase from USD2.3 billion to USD3.7 billion. Similar
to export trend, this raise was also partly driven by the
oil price movement. Oil import¹ price rose from
USD58.4/barrel to USD70.3/barrel in average during the
reporting period. In terms of volume oil import
increased from 40.1 million barrel to 50.4 million barrel.
Imports of crude oil during Q3/2009 for refinery
intake were originated from the Middle East with ALC
(Arab Light Crude) oil type and followed by crude oil
from Brunei, Africa, China and Malaysia. These types of
crude oil were used for several refineries such as
Cilacap, Balikpapan and Balongan that are the principal
refineries providing for domestic fuel supply.
Table 16
Demand and Supply of World Oil
The movements of Indonesian oil prices were in
line with world oil price movement. OPEC and WTI
basket crude oil price showed an increase reaching
respectively USD67.17/barrel and USD69.34/barrel. The
expectation for global economic recovery in 2010 and
the weakening USD exchange rate contributed to the
hike in oil price. The oil price still experienced an
increase despite the indication of oversupply in terms of
demand and supply (OPEC Monthly Report).
Exports 2,411 41.5 2,967 43.1
Crude Oil 1,775 31.6 56.2 2,206 33.1 66.6
Refinery Products 635 9.9 64.4 761 10.0 76.4
Imports 2,343 40.1 0.0 3,746 53.3 0.0
Crude Oil 857 17.3 49.4 1,489 22.8 65.2
Refinery Products 1,486 22.8 65.3 2,258 30.5 74.1
Oil Trade Balance 68 ‐779
Source: BPMigas & PT Pertamina (Processed) Price (USD/barel) Details 2009 Q2 Q3
Value (mill.
USD) Volume
(mbbl) Price
(USD/barel) Value (mill.
USD) Volume
(mbbl)
Q1 Q2 Q3
Oil Demand
Northern America 25.5 24.2 23.5 23.0 23.3
China 7.6 8.0 7.6 8.3 8.4
Western Europe 15.3 15.3 14.9 14.4 14.8
Others 37.6 38.1 37.9 37.5 38.0
Total Oil Demand 86.0 85.6 83.9 83.2 84.5 Oil Supply 0.0 0.0 0.0 0.0 0.0
OPEC 30.2 31.2 28.4 28.5 28.8
Non OPEC 54.6 54.8 55.5 55.2 55.7
84.6 0.0 0.0 0.0 0.0
Total Oil Supply 84.8 86.0 84.0 83.7 84.5 Netto Demand ‐ Supply ‐1.2 0.3 0.1 0.5 0.0
Source: OPEC Oil Monthly Report ‐ October 2009
Details
(in mbpd) 2007 2008
Chart 6 World Oil Price
With reference to domestic supply the average
Indonesian oil production reached 0.943 million barrel
per day, slightly higher than the average production in
the previous quarter (0.941 milion barrel per day). This
production was however still below oil production
assumption defined in the 2009 APBN-P 2009 (0.960
million barrel per day). This condition was driven among
others by the production of Cepu field that had not
worked in accordance with the initial target as well as
by the natural declining of old oil fields.
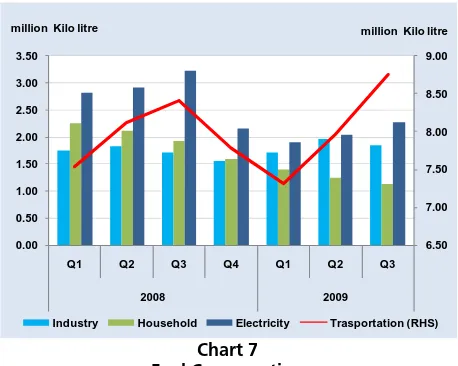
In terms of domestic demand, fuel consumption
during the reporting period experienced an increase to
88.3 million barrel compared to 84.5 million barrel in
the preceding period. Pertaining to user sectors, the
hike in fuel consumption was mainly reflected in
industrial, electrical and transportation sectors while the
use in household sector showed a decrease. Despite
posting an increase compared to the preceding quarter,
the hike of fuel consumption was not steep and the
level was still below the previous year. This was driven
by the success of the conversion program to replace
household oil-based fuels with gas as well as the energy
conversion to coal in several power plants. This success
was reflected in oil consumption which declined to 88.9
million barrel from 100.8 million barrel in the previous
Chart 7 Fuel Consumption
2.2. Gas
The growing trend of oil and gas price had driven
a positive contribution to gas trade balance in Q3/2009
by recording a USD2.7 billion surplus from a USD1.9
billion surplus in Q2/2009. This higher surplus was also
related to the increasing LNG export volume.
The exported LNG product in the reporting period
reached USD2.0 billion (244 mmbtu) or grew from
USD1.4 billion (228 mmbtu) in Q2/2009. This growing
trend was in line with addition of oil production from
Tangguh field. Indonesia has an extensive gas reserves
amounting to 170.1 TSCF (Trillion Standard Cubic Feet)
with the following composition: 112.5 TSCF of proven
reserves and 57.7 TSCF of potential reserves. Gas
reserves was higher in 2008 compared to 2007.
Table 17
Indonesian Gas Reserves (billion cubic feet)
Price factor also improved the export value of
natural gas, compensating the decrease in its export
volume. Export value of natural gas increased from
USD565 million to USD759 million. 30 40 50 60 70 80 90 100 110 120 130 140
Jul Sep Nov Jan Mar May Jul Sep Nov Jan Mar May Jul Sep
2007 2008 2009
USD/barel
SLC
Indonesian Export Price WTI
OPEC
Source: OPEC, Ditjen Migas
6.50 7.00 7.50 8.00 8.50 9.00 0.00 0.50 1.00 1.50 2.00 2.50 3.00 3.50
Q1 Q2 Q3 Q4 Q1 Q2 Q3
2008 2009
Industry Household Electricity Trasportation (RHS)
million Kilo litre million Kilo litre
Year Reserves
Proven 91 91 97 94 106 113 Potential 87 98 89 93 59 58
Total 178 188 186 187 165 170
2006 2007 2008
Table 18
Exports of LNG, LPG and Natural Gas
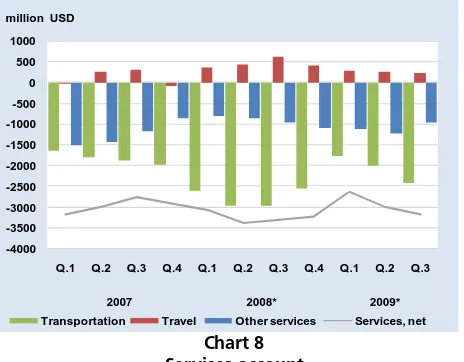
3. Services Account
In line with the strengthening domestic economic
activities that consequently affected the increase of
transportation expenses related to imported products,
the deficit of services account in Q3/2009 rose to
USD3.2 billion compared to USD3.0 billion in
Q2/2009.The hike in economic activities had also
triggered increase in deficit of other services such as
insurance and other financial intermediary services. The
increase in services account deficit was also related to
the declining surplus of travel, communication and
government services.
Chart 8 Services account
Transportation services recorded a deficit of
USD2.4 bilion, higher than USD2.0 billion in the
preceding quarter. The hike in deficit among others
reflected the considerable dependency on foreign fleet
in fulfilling transportation demand. In the effort of
lessening this dependency, the government emanated a
policy of cabotage principle that oblige the shipping of
commodities between domestic ports conducted by
national fleet. This policy had been implemented for
commodities such as palm oil and agricultural products
however the application was still very limited due to
difficulties in new fleet financing.
In Q3/2009 travel services (tourism sector)
recorded a USD223 million surplus, slightly lower than
USD248 million in Q2/2009. This declining surplus was
due to the increase of foreign exchange expenses by
Indonesian travelers abroad from USD1,323 million to
USD1,441 million exceeding the expenses of
international travelers in Indonesia from USD1,572
million to USD1,664 million.
The economic recovery experienced by several
countries contributed to the increase of international
tourists visiting Indonesia. The number of international
tourists (inbound) in Q3/2009 reached 1,671 thousand
people higher than 1,590 thousand people in Q2/2009.
This increase was also triggered by the organization of
several international tourism activities such as Darwin
Ambon Yacht Race 2009 in July 2009 involving
participants from UK, Australia and Germany and Sail
Bunaken event organized early August 2009 in Manado
gathering participants from 33 countries.
The statistic of international tourists was still
dominated by travelers coming from neighboring
countries. Tourists from Singapore were in the first rank
(share 13.9%) followed by Australia (10.8%), Malaysia
(10.8%), Japan (9.01%) and China (6.9%). Only
Australia out of 3 countries (Singapore, Malaysia and
Australia) shows a consistent increase in the number of
tourists since Q1/2009.
Q1 Q2 Q3
LNG
Volume (mmbtu) 1,080 1,068 257 228 244 Value (million USD) 9,723 12,785 1,426 1,448 1,989 Price(USD/mmbtu) 9.0 11.9 5.5 6.3 8.2
LPG
Volume (000 metric ton) 337 101 ‐ ‐ ‐ Value (million USD) 210 79 ‐ ‐ ‐ Price (USD/MTon) 604.7 394.9 ‐ ‐ ‐
Natural Gas
Volume (mmbtu) 293 303 78 77 76 Value (million USD) 2,443 3,469 441 565 759 Price (USD/mmbtu) 8.3 11.3 5.7 7.4 10.0
Gas Trade Balance 12,345 16,147 1,744 1,906 2,697
Export (million USD) 12,376 16,333 1,867 2,013 2,748
Import million USD) 31 186 123 107 51
Source: BPMigas
Details 2007 2008* 2009*
-4000 -3500 -3000 -2500 -2000 -1500 -1000 -500 0 500 1000
Q.1 Q.2 Q.3 Q.4 Q.1 Q.2 Q.3 Q.4 Q.1 Q.2 Q.3
2007 2008* 2009*
Transportation Travel Other services Services, net
Bali was still considered as the main tourist
destination representing 41.4% of the market share,
followed by Jakarta (21.8%) and Batam (13.0%).
Australia (share 19.5%), Japan (14.0%) and China
(8.3%) were countries with the largest number of
tourists visiting Bali.
Chart 9 Travel Services
On the other hand, the number of Indonesian
people going abroad also grew to 1,495 thousand
people in Q3/2009 from 1,373 thousand people in the
preceding quarter. This growth was followed by the
increase of foreign exchange expenses related to this
trip from USD1.3 billion to USD1.4 billion.
Neighboring ASEAN countries still remained the
main destination of Indonesian travelers such as
Singapore (share 43.9%), Malaysia (25.4%) and
Thailand (3.9%). Australia (5.5%) and the US (4.3%)
were the main destination of Indonesian tourists outside
ASEAN countries.
4. Income Account
In Q3/2009 the income account recorded a
USD4.1 billion deficit, higher than USD3.7 billion deficit
in Q2/2009. This increase was mainly related to the
growing dividend payment to foreign investor portfolio.
The growth of deficit was also contributed by the
increasing profit transfer to foreign companies dealing
with oil & gas sector pursuant to the rise in oil & gas
production. In contrast, the interest payment of
government foreign debt decreased in the reporting
period according to its cyclical pattern.
Chart 10 Income Account
Income from portfolio investment recorded a
USD1.4 billion deficit, higher than USD0.7 billion in the
preceding quarter. The increase of this deficit was
mainly triggered by the rise in dividend payment on
shares owned by foreign investors to USD1.0 billion
from USD0.5 billion. This condition was consistent with
the increase of foreign ownership of domestic shares in
the preceding periods.
The deficit in direct investment income also
mounted to USD2.2 billion from USD2.1 billion in
Q2/2009. This growing deficit was related to the
increased profit transfer reported by oil & gas
companies from USD0.8 billion to USD1.3 billion in the
reporting period.
On the other hand, deficit in other investment in
Q3/2009 decreased to USD0.3 billion from USD0.9
billion in Q2/2009. This contraction was related to the
decrease in foreign debt repayments by the government
from USD0.7 billion to USD0.2 billion.
-800 -600 -400 -200 0 200 400 600 800 -600 -500 -400 -300 -200 -100 0 100 200 300 400 500 600 700
J F M A M J J A S O N D J F M A M J J A S O N D J F M A M J J A S
2007 2008 2009
million USD
Inbound (thousan people) Outbound (thousand people)
Trav. Balance (thousand people) Inflows (million USD) RHS
Trav. Balance (million USD) RHS Outflows (million USD) RHS
Thousand people -5,000 -4,500 -4,000 -3,500 -3,000 -2,500 -2,000 -1,500 -1,000 -500 0
Q.1 Q.2 Q.3 Q.4 Q.1 Q.2 Q.3 Q.4 Q.1 Q.2 Q.3
2007 2008* 2009*
Income, net Inv. Income DI Income
PI Income OI Income
5. Current Transfers
In Q3/2009 the current transfer posted a
USD1,176 million surplus, slightly lower than USD1,200
million in the previous quarter. The decreased inflows of
remittances from Indonesian labor abroad and the
increased outflows of remittances by foreign labor had
caused this declining surplus. The revenue from
remittances of Indonesian workers was posted
USD1,603 million, slightly lower than USD1,652 million
in the previous period. On the other hand, outflows
from remittance of foreigners working in Indonesia
reached USD440 million, slightly higher than USD432
million in Q2/2009.
Chart 11
Workers’ Remittances
Other component contributing the surplus of
current transfer was the revenue related to
non-investment grant in the form of food, clothes,
medicines and medical equipment. In Q3/2009 this
revenue reached USD40 million, higher than USD32
million in Q2/2009. The grants received during this
quarter was among other from Dutch Government in
the form of hospital medical equipment that officially
accepted by the Indonesian Ambassador for the
Netherland on August 24, 2009. UNICEF had also
provided aid in the form of tents for earthquake victims
in Tasikmalaya, West Java.
Table 19 Non-Investment Grant
-1000 -500 0 500 1000 1500 2000
Q.1 Q.2 Q.3 Q.4 Q.1 Q.2 Q.3 Q.4 Q.1 Q.2 Q.3
2007 2008* 2009*
TKI Inflow TKA Outflow worker remittance, net
million USD (million USD)
Non Investment Grants
(Current Transfer) Q.1. Q.2. Q.3. Q.4. Q.1. Q.2. Q.3.
Total 86 41 62 145 73 32 40
Public (Govt.) 17 27 38 128 4 15 20
Private (NGO) 69 14 24 17 69 17 20
Source : Ministry of Finance & United Nation
In Q3/2009 capital and financial account posted a
USD3.0 billion surplus, better than a USD 2.2 billion
deficit in the previous quarter. This surplus was
contributed by the improving performance of portfolio
investment and other investment. The strengthening
domestic macroeconomic conditions, supported by a
relatively attractive rupiah interest rate, had triggered
the inflows of portfolio investment. In the meantime,
other investment deficit declined due to the decrease of
scheduled foreign debt repayments by the government,
additional SDR allocation by IMF, and the growing
foreign loan disbursement by private sector. The
strengthening economic prospect, relaxing global
liquidity as well as relatively low overseas interest rate
had contributed to growing private sector foreign
financing.
Unlike portfolio and other investments, direct
investment performance contracted in Q3/2009
compared to the previous period. This decrease was
estimated more related to the descending world
demand on export products since the number of export
oriented foreign direct investment was relatively high. In
line with the existing signs of world economic recovery
it was forecasted that direct investment inflows would
increase in the coming quarters.
Chart 12
Capital and Financial Account by Type of Investment
1. Capital Account
The capital account in Q3/2009 recorded a USD34
million surplus, higher than a surplus of USD29 million
in the previous quarter. This surplus was contributed
mainly by the investment grants such as those for
construction of bridges, schools and housing. The
majority of the grants were allocated in the framework
of aids for natural disaster’s victims in several locations
in the country. As in previous quarters, most of the
grants (88%) was in the form of investment grant
received through private sector (NGO) amounting to
USD30 million and rest through the public sector
(government).
-8,000 -6,000 -4,000 -2,000 0 2,000 4,000 6,000
Q.1 Q.2 Q.3 Q.4 Q.1 Q.2 Q.3 Q.4 Q.1 Q.2 Q.3
2007 2008* 2009*
Direct Investment Portfolio Investment
Other Investment Financial Account
million USD
One example of investment grant was the aid from
Australian government for the construction of 2,000
Junior High School buildings which was estimated for
completion at the end of 2009.
Table 20 Investment Grant
2. Financial Account
The financial account performance in Q3/2009
showed an improvement by recording a USD3.0 billion
surplus after experiencing a USD2.3 billion deficit in
Q2/2009. This improvement emerged in portfolio
investment and other investment accounts. On the
contrary, direct investment posted a deficit after
recording a surplus in the previous quarter. This drop
appeared both in oil & gas and non-oil & gas sectors.
In terms of sector, financial account of public
sector posted a USD5.6 billion surplus compensating a
USD2.6 billion deficit registered by private sector.
Chart 13
Capital and Financial Account by Sector
The growth of portfolio investment inflow was
condition. The improved economic condition had also
increased private corporates’ demand for foreign
financing. Meanwhile, the improved performance of
other investment was contributed by the decrease in
official foreign debt repayment due to seasonal factor
and additional SDR allocation from IMF.
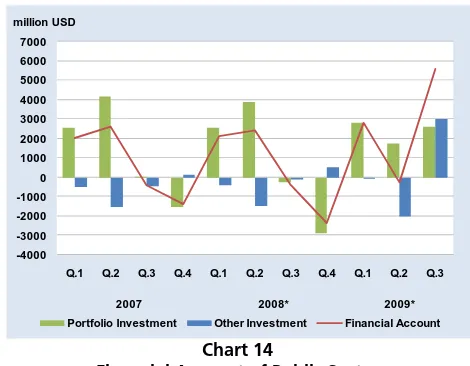
2.1 Public Sector
Public sector’s financial account posted a USD5.6
billion surplus in Q3/2009, in contrast with a USD0.2
billion deficit in Q2/2009. This surplus was related to
portfolio investment and other investment.
Chart 14
Financial Account of Public Sector
Portfolio Investment
Portfolio investment in public sector recorded a
USD2.6 billion surplus, higher than a USD1.8 billion
surplus in the preceding quarter. This surplus was
mainly resulted from the purchase of SBI and
government’s rupiah bond (SUN) by foreign investors
and supported by the issuance of Samurai Bond by the
government amounting to USD0.4 billion.
Transaction on SBI by foreign investor during the
reporting period recorded a USD1.6 billion surplus,
higher than the USD0.4 billion surplus in the preceding
period. SUN transaction also recorded a net buying by
foreign investors amounted to USD0.6 billion but lower
(million USD)
Investment Grants
(Capital Transfer) Q.1. Q.2. Q.3. Q.4. Q.1. Q.2. Q.3.
Total 17 61 186 29 19 29 34
Public (Govt.) 4 6 7 3 2 3 4
Private (NGO) 13 55 179 26 17 26 30
Source : Ministry of Finance & United Nation
2008* 2009* -8,000 -6,000 -4,000 -2,000 0 2,000 4,000 6,000 8,000
Q.1 Q.2 Q.3 Q.4 Q.1 Q.2 Q.3 Q.4 Q.1 Q.2 Q.3
2007 2008* 2009*
Public sector Private sector Capital & financial account million USD -4000 -3000 -2000 -1000 0 1000 2000 3000 4000 5000 6000 7000
Q.1 Q.2 Q.3 Q.4 Q.1 Q.2 Q.3 Q.4 Q.1 Q.2 Q.3
2007 2008* 2009*
Portfolio Investment Other Investment Financial Account
Transaction on rupiah-denominated government
bonds by foreign investor was dominated by the
purchase of mid to long term tenor that has relatively
low risk of capital reversal. This low risk was due to its
less liquid characteristic and, referring to historical data,
investor generally purchases the government bond on
real money account.
Foreign capital inflows in the form of portfolio
investment during the reporting period were due to
several factors. From external side, relaxed liquidity in
the global financial market as well as the weakening
trend of US Dollar had triggered foreign interest to
invest in developing countries. From domestic side, the
strengthening domestic economic condition, reflected
among others from Moody’s decision to improve
Indonesia’s sovereign credit rating from Ba3 to Ba2 in
September 2009 and favorable Rupiah interest rate was
adequate to attract foreign investment inflows.
In addition to that, portfolio investment inflow was
supported by the descending risk factor. During the
reporting period, the risk rates reflected from several
risk indicators such as CDS (Credit Default Swap), yield
spread Global Bond, and spread EMBIG showed a
descending trend. CDS on Indonesia dropped from 310
bps in Q2/2009 to 183 bps in Q3/2009, while yield
spread between Global Bond Indonesia and US T-Note
dropped from 396 bps to 251 bps. Spread EMBIG also
showed similar trend declining from 432 bps to 345
bps.
Financial asset yield in Rupiah denomination was
still relatively high. The difference of local and overseas
interest rates, known as Uncovered Interest Rate Parity
(UIP), was still high despite showing a descending trend
from 7.00% at the end of Q2/2009 to 6.45% in
Q3/2009. On the other hand, the yield spread between
SUN and US T-Note still recorded the highest rate in
Asian region. The same tendency was also reflected
from the relatively high SBI interest rate.
Chart 15
Indonesia’s Yield Global Bond and US T-Note
Up to the end of the reporting period, BI rate, the
policy rate, was sustained at the level of 6.5%, lower
than the preceding period (7%), but higher than the
Fed Fund rate (almost 0%).
Chart 16
BI Rate and Fed Fund Rate
In general, SUN market performance showed an
ongoing improvement during the reporting period,
albeit experiencing a decline in August 2009. The
consistent foreign investment inflows were able to
support high activities in SUN market. This development
generated an average decline to SUN yield of all types
of tenor by 54 bps thus reaching the lowest point in
2009 of 10.4% (at average).
Pertaining to this development, the amount of SUN
owned by foreign investors experienced an increase at
the end of the reporting period to USD9.6 billion from 0 2 4 6 8 10 12 14 16 18
Oct Nov Dec Jan Feb Mar Apr May Jun Jul Aug Sep
2008 2009
Yield Global Bond Indonesia Yield US T Note
% 0 1 2 3 4 5 6 7 8 9 10 Ja n Fe b Ma r Apr Ma y Ju n Ju l
Aug Sep Oc
t No v De c Ja n Fe b Ma r Apr Ma y Ju n Ju l
Aug Sep Oc
t No v De c Ja n Fe b Ma r Apr Ma y Ju n Ju l Aug Sep
2007 2008 2009
%
BI Rate
USD8.5 billion in Q2/2009. The same trend underwent
with SBI climbing from USD2.0 billion in Q2/2009 to
USD3.8 billion in Q3/2009.
Chart 17
SUN & SBI Owned by Foreign Investors
During the reporting period, for the first time the
government issued Samurai Bond in Japanese financial
market. The issuance volume was ¥35 billion (USD370
million) for 10 year’s tenor and 2.73% coupon (at par).
The issuance was implemented using private placement
method to Qualified Institutional Buyers, such as
insurance companies and banks in Japan.
The volume of Samurai Bond issuance was relatively
small despite the high interest showed by investors due
to several considerations, among others: (i) the objective
of this issuance was to expand SUN investor-based in
Japanese financial market, (ii) domestic market
condition was still conducive to absorp the targeted
SUN issuance in 2009 and in line with government’s
effort to concentrate on domestic financing, (iii) optimal
use of JBIC’s guarantee facility available until 2010.
Other Investment
Public sector’s other investment transaction
recorded a USD3.0 billion surplus in Q3/2009, in
contrast with the USD2.0 billion deficit posted in
Q2/2009. This surplus was due to the descending
foreign debt repayments and the increasing external
loan disbursement compared to the preceding period.
The government external debt repayment
decreased to USD1.0 billion from USD2.3 billion in
Q2/2009. The loan disbursement increased to USD1.3
billion compared to USD0.3 billion in the previous
quarter.
Chart 18
Disbursement and Repayment of Government Loan
The growing foreign loan disbursement was related
to both program loan and project loan. Program loan
disbursement rose to USD554 million from USD11
million in the preceding quarter. USD300 million of this
amount was obtained from France through the second
phase loan of Agence Française de Développement
(AFD). This long-term loan was part of Climate Change
Program Loan (CCPL) which was aimed at supporting
policy reformation in sectors related to climate change
issue, such as forestry, energy, agriculture and water.
In the reporting quarter, the government received
program loan amounting to USD254 million from the
World Bank (IBRD). This loan was a part of USD500
million World Bank commitments to be allocated for the
financing of the National Program for Community
Empowerment (PNPM Mandiri) 2009. 0 2 4 6 8 10 12 14 Ja n Fe b Mar Ap r Ma y Ju n Ju l Au g Se p Oc t No v De c Ja n Fe b Mar Ap r Ma y Ju n Ju l Au g Se p 2008 2009 Billion USD
SUN Foreign Ownership SBI Foreign Ownership
0 500 1000 1500 2000 2500 3000
Q1 Q2 Q3 Q4 Q1 Q2 Q3 Q4 Q1 Q2 Q3
2007 2008* 2009*
million USD
Chart 19
Program Loan Disbursement
Project loan disbursement increased to USD709
million compared to USD276 million in the preceding
period. Most of this project loan was obtained from
former CGI member countries reaching USD656 million,
higher than USD213 million in the preceding quarter.
The entire loans were under ODA scheme and mostly
were implemented in the form of bilateral loan
(USD462 million). The government also received loan
from countries outside former CGI members amounting
to USD54 million, lower than the loan disbursement in
the previous quarter (USD63 million).
Chart 20
Project Loan Disbursement
Chart 21
Government Foreign Loan Position
With this development, the outstanding
government external debt (excluding SUN and SBI
owned by foreign investors) rose to USD80.5 billion
from USD77.7 billion in the preceding period. With
reference to creditors, Japan/JBIC was still the biggest
donor for Indonesia (representing 36.2% of total
external debts). The Japanese outstanding loan grew
from USD27.1 billion to USD29.1 billion in Q3/2009
while the outstanding debts from the US (share
19.3%), ADB (share 13.2%) and IBRD (share 8.2%)
were relatively constant at respectively USD15.6 billion,
USD10.6 billion and USD6.6 billion.
Chart 22
Government Foreign Loan Position by Major Creditor Countries 0 200 400 600 800 1000 1200
Q1 Q2 Q3 Q4 Q1 Q2 Q3 Q4 Q1 Q2 Q3
2007 2008* 2009*
million USD
ADB IBRD Japan (JBIC) Others
0 50 100 150 200 250 300 350 400 450 500
Q1 Q2 Q3 Q4 Q1 Q2 Q3 Q4 Q1 Q2 Q3
2007 2008* 2009*
million USD
Bilateral-CGI Multilateral-CGI Non CGI
50000 55000 60000 65000 70000 75000 80000
Q1 Q2 Q3 Q4 Q1 Q2 Q3 Q4 Q1 Q2 Q3
2007 2008* 2009*
million USD 0 5000 10000 15000 20000 25000 30000 35000
Q1 Q2 Q3 Q4 Q1 Q2 Q3 Q4 Q1 Q2 Q3
2007 2008* 2009*
Million USD
By currency, the USD loans still dominated the
government external debts (46.6%) while the Yen and
Euro-denominated reached respectively 35.8% and
11.5% of share. The USD loan was USD37.5 billion,
relatively the same as the preceding quarter while Yen
and Euro-denominated loans rose to USD28.8 billion
and USD9.3 billion from respectively USD26.8 billion
and USD9.0 billion in Q2/2009.
Chart 23
Government Foreign Loan Position by Major Currencies
The government continued its effort to lessen the
dependency on foreign financing and improve the
structure of financial balance. One of the efforts was
debt swap on various projects in Indonesia. During the
reporting period, the government was negotiating with
creditor countries on forestry-related debt swap (known
as debt for nature). One of the examples was debt swap
from Germany amounting to €20 million. The
government has also negotiated with Australia on
conservation project amounting to AUD75 million. The
same effort had also been implemented with the Italian
government.
2.2.Private Sector
The deficit on private sector financial account rose
in Q3/2009 to USD2.6 billion from USD2.0 billion in
Q2/2009. The highest deficit underwent on other
credit on assets side and domestic bank and non-bank
placements in overseas banks. The increase on asset