HYPERSPECTRAL IMAGE DENOISING WITH CUBIC TOTAL
VARIATION MODEL
H. Zhang
The State Key Laboratory of Information Engineering in Surveying, Mapping and Remote
Sensing, Wuhan University, Wuhan, Hubei, China,
[email protected]
Commission VII, WG VII/3
KEY WORDS: Hyperspectral Image, Denoising, Cubic Total Variation, Augmented Lagrangian Method
ABSTRACT:
Image noise is generated unavoidably in the hyperspectral image acquision process and has a negative effect on subsequent image
analysis. Therefore, it is necessary to perform image denoising for hyperspectral images. This paper proposes a cubic total variation
(CTV) model by combining the 2-D total variation model for spatial domain with the 1-D total variation model for spectral domain,
and then applies the termed CTV model to hyperspectral image denoising. The augmented Lagrangian method is utilized to improve
the speed of solution of the desired hyperspectral image. The experimental results suggest that the proposed method can achieve
competitive image quality.
1. INTRODUCTION
Hyperspectral remote sensing image acquision is a
complicated process, in which image noise is generated
unavoidably. Hyperspectral image noise has a negative effect
on subsequent image processing and analysis, such as
classification, target detection, unmixing and etc. Therefore, hyperspectral image denoising aims at removing the noise
included in hyperspectral images and supporting improved
image analysis capabilities.
To date, many hyperspectral remote sensing image
denoising algorithms have been proposed, such as [1–6].
Othman and Qian [1] proposed a hybrid spatial-spectral
derivative-domain wavelet shrinkage noise reduction approach.
Chen and Qian [2, 3] perform simultaneous dimension
reduction and hyperspectral image denoising using wavelet
shrinking and principal component analysis. A
tenser-filter-based hyperspectral image denoising algorithm
was proposed by Salah Bourennane et al. [4]. Another type of
filter-based hyperspectral image denoising approach using
anisotropic diffusion was proposed in [5]. Recently, Chen et al.
[6] proposed a new hyperspectral image denoising algorithm by
adding a PCA transform before using wavelet shrinkage; first, a
PCA transform was implemented on the original hyperspectral
image, and then the low-energy PCA output channel was
denoised with wavelet shrinkage denoising processes.
However, most of these denoising algorithms deal with
hyperspectral image band by band without considering
hyperspectral image cube as a whole integrity. It should be
noted that hyperspectral image cube exhibits a 3 dimensional
(3-D) concept. On one hand, from the spatial point of view,
each band image is a 2-D signal. On the other hand, from the
spectral point of view, the spectral curvature forms a 1-D signal.
Therefore, this paper proposes a cubic total variation (CTV)
model based hyperspectral image denoising method to treat the
hyperspectal image as a whole 3-D integrity from both the
spatial and spectral dimension.
2. CUBIC TOTAL VARIATION MODEL BASED
HYPERSPECTRAL IMAGE DEBOISING
2.1 Cubic Total Variation (CTV) Model
Total variation (TV) model, firstly proposed by Rudin et al. in 1992 [7], has been widely used in image denoising
because of its excellent denoising performance and
edge-preserving property.
The standard TV model for
gray-level image looks like
ISPRS Annals of the Photogrammetry, Remote Sensing and Spatial Information Sciences, Volume I-7, 2012 XXII ISPRS Congress, 25 August – 01 September 2012, Melbourne, Australia
2
2horizontal and vertical directions, and
M
is the total number of pixels ingray-level
imagev
.Now, we consider the total variation model for
hyperspectral image. Firstly, from the perspective of the 2-D
spatial domain band by band, each band of the hyperspectral
image is a 2-D gray-level image signal. Therefore, the most
direct TV model of hyperspectral image is to add the standard
TV model of each band and we can get the following 2-D TV
model:
band of hyperspectral image:
2
2 hyperspectral image.Secondly, from the perspective of the 1-D spectral domain
pixel by pixel, each pixel of the hyperspectral image is a 1-D
spectral signal. The 1-D TV model [8] for the
m
th pixel ofthe hyperspectral image can be written as:
:, ,hyperspectral image, and
z represent the gradient operatorof the spectral domain.
It should be noted that the hyperspectral image cube
exhibits a 3-D concept. Therefore, it is natural for us to
combine the 2-D total variation model for spatial domain with
the 1-D total variation model for spectral domain and propose
the termed cubic total variation model for the hyperspectral
image, which can be written as:
,:where
represents the weight of spectral dimension relativespatial domain.
2.2 CTV based Hyperspectral Image Denoising
In recent years, the maximum a posteriori (MAP) [9] estimation theory, which inherently includes prior constraints in
the form of prior probability density functions, has been
attracting attention and enjoying increasing popularity. Based
on the MAP estimation theory, the denoising model for a
hyperspectral image can be represented as the following
constrained least squares problem:
where
g
represents the observed hyperspectral image, theterm 2
2
g
u
represents the data fidelity between theobserved noisy image and the original clean image, and R(u) is
the regularization item, which gives a prior model of the
original clear hyperspectral image.
is the regularization parameter which controls the relative contribution of datafidelity term 2
2
g
u
and regularization termR
u
.We apply the proposed CTV model in (5) to the
hyperspectral image denoising framework and obtain the
following cost function:
The desired hyperspectral image can be solved by optimizing
the cost function shown in (6). Because of the high dimension
property of hyperspectral images and the non-difference
property of the proposed CTV model, how to efficiently resolve
the hyperspectral image denoising model is very important. In
this paper, the augmented Lagrangian method [10] is utilized to
optimize the CTV denoising model.
3. EXPERIMENTS
3.1 Simulation Results
The hyperspectral image used in this experiment is a
remote sensing image of size
307 280
collected withHYDICE from Washington DC Mall. In the simulated process,
zero-mean Gaussian-noise and salt-and-pepper noise was added
to the hyperspectral image. The denoising result with
ISPRS Annals of the Photogrammetry, Remote Sensing and Spatial Information Sciences, Volume I-7, 2012 XXII ISPRS Congress, 25 August – 01 September 2012, Melbourne, Australia
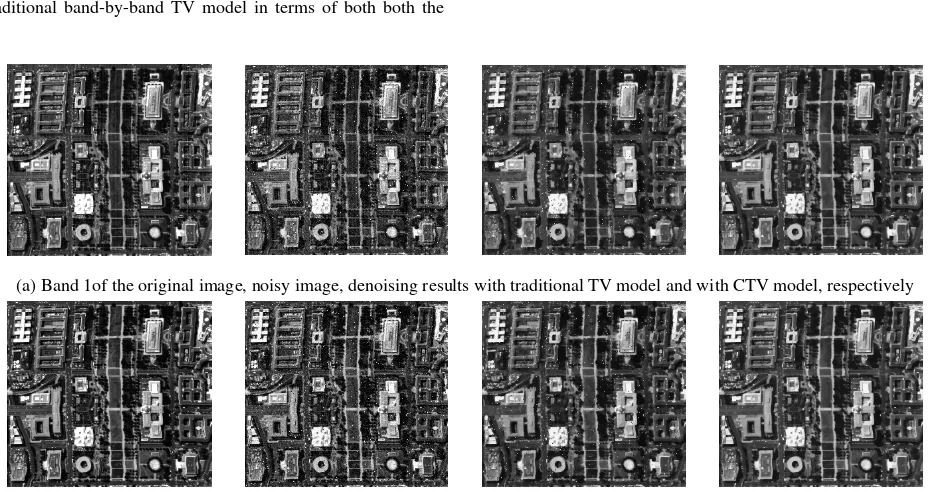
traditional band-by-band TV model is compared as benchmark.
The parameters of the proposed method are set as
12
and
0.063
. Bands 1 and 21 of the original image, noisyimage, denoising results with traditional TV model and with
CTV model are shown in Fig. 1. The objective evaluations
results are shown in Table 1. It is clearly observed that the
proposed hyperspectral image denoising method outperforms
the the hyperspectral image denoising method with the
traditional band-by-band TV model in terms of both both the
quantitative measurements and visual evaluation.
Table 1 Objective evaluations of denoising results
Noisy image Traditional TV CTV
MSE 440.73 319.39 305.54
PSNR 21.69 23.09 23.28
(a) Band 1of the original image, noisy image, denoising results with traditional TV model and with CTV model, respectively
(a) Band 21of the original image, noisy image, denoising results with traditional TV model and with CTV model, respectively
Fig. 1 The denoising result of Washington DC Mall image.
3.2 Real Results
The image data used in this experiment is the AVIRIS
image of Indian Pine (
145 145
pixel) acquired in June1992. The image has 200 bands after discarding water
absorption bands. The parameters of the proposed method are
set as
5
and
0.1
. Bands 1, 2, 3 and 103 of the original image, noisy image, denoising results with traditionalTV model and with CTV model are shown in Fig. 2. It is
clearly observed that the quality of the denoising results image
has improved a lot comparing to the original noisy
hyperspectral, and that the hyperspectral image denoising
method with the proposed CTV model outperforms the the
hyperspectral image denoising method with the traditional
band-by-band TV model.
(a) Band 1, 2, 3 and 103 of the original image
ISPRS Annals of the Photogrammetry, Remote Sensing and Spatial Information Sciences, Volume I-7, 2012 XXII ISPRS Congress, 25 August – 01 September 2012, Melbourne, Australia
(b) Band 1, 2, 3 and 103 of the denoising results with traditional band-by-band TV model
(c) Band 1, 2, 3 and 103 of the denoising results with the proposed CTV model
Fig. 2 The denoising result of Indian image.
4. CONCLUSIONS
This paper proposes a cubic total variation model by
combining the 2-D total variation model for spatial domain
with the 1-D total variation model for spectral domain, and
applies the termed cubic total variation model to the
hyperspectral image denoising framework. The augmented
Lagrangian method is utilized to improve the speed of solution
of the desired hyperspectral image. The experimental results
suggest that the proposed method can achieve competitive
image quality.
5. ACKNOWLEDGEMENTS
This work was supported in part by the National Basic
Research Program of China (973 Program) under Grant
2011CB707105, by the National Natural Science Foundation of
China under Grants 40930532 and 61102112, by Post-doctoral
Science Foundation of China under Grant 2011M501242.
REFERENCE
[1] Othman H. and Qian S., 2006. Noise reduction of hyperspectral imagery using hybrid spatial-spectral derivative-domain wavelet shrinkage. IEEE Trans. Geosci. Remote Sens., 44(2), pp. 397– 408.
[2] Chen G. and Qian S., 2008. Simultaneous dimensionality reduction and denoising of hyperspectral imagery using bivariate wavelet shrinking and principal component analysis. Can. J. Remote Sens., 34(5), pp. 447–454.
[3] Chen G. and Qian S., 2009. Denoising and Dimensionality Reduction of Hyperspectral Imagery using Wavelet Packets, Neighbour Shrinking and Principal Component Analysis. Int. J. Remote Sens., 30(18), pp. 4889–4895.
[4] Letexier D. and Bourennane S., 2008. Noise Removal from Hyperspectral Images by Multidimensional Filtering. IEEE Trans. Geosci. Remote Sens., 46(7), pp. 2061–2069.
[5] Wang Y., Niu R., and Yu X., 2010. Anisotropic Diffusion for Hyperspectral Imagery Enhancement. IEEE Sensors J., 10(3), pp. 469–477.
[6] Chen G., Qian S., and Xie W., 2011. Denoising of Hyperspectral Imagery Using Principal Component Analysis and Wavelet Shrinkage. IEEE Trans. Geosci. Remote Sens., 49(3), pp. 973–980.
[7] Rudin L., Osher S., and Fatemi E., 1992. Nonlinear total variation based noise removal algorithms. Physica D, 60(4), pp. 259–268. [8] Karahanoglu F. I., Bayram I. and De Ville D. V., 2011. A Signal
Processing Approach to Generalized 1-D Total Variation. IEEE Trans. Signal Processing, 59(11), pp. 5265-5274.
[9] Zhang L., Zhang H., Shen H., and Li P., 2010. A super-resolution reconstruction algorithm for surveillance images. Signal Process., 90(3), pp. 848–859.
[10] Chan S., Khoshabeh R., Gibson K., Gill P., and Nguyen T., 2011. An Augmented Lagrangian Method for Total Variation Video Restoration. IEEE Trans. Image Process., 20(11), pp. 3097–3111.
ISPRS Annals of the Photogrammetry, Remote Sensing and Spatial Information Sciences, Volume I-7, 2012 XXII ISPRS Congress, 25 August – 01 September 2012, Melbourne, Australia