Malaysian Registry
of Intensive Care
Malaysian Registry of Intensive Care
Report for 2013
Prepared by
Dato’
Dr Jenny Tong May Geok
Dr Tai Li Ling
Dr Tan Cheng Cheng
Dr Ahmad Shaltut Othman
Dr As-Niza Abdul Shukor
Dr Lim Chew Har
Technical Committee of the
June 2014
© Malaysian Registry of Intensive Care
Published by:
Malaysian Registry of Intensive Care
Clinical Research Centre
Ministry of Health Malaysia
Disclaimer:
This work may be reproduced in whole or part for study or training purposes, subject to the
inclusion of an acknowledgement of the source.
Suggested citation:
Jenny Tong May Geok, Tai Li Ling, Tan Cheng Cheng, Ahmad Shaltut Othman, As-Niza Abdul
Shukor, Lim Chew Har
Malaysian Registry of Intensive Care 2013 report
Electronic version:
CONTENTS
Page
Contents………. 4
Report Summary………... 5
Acknowledgement……… 6
Foreword……… 7
MRIC Technical Committee 2013………. 8
Participating Hospitals……… 9
Categories of ICU ………. 11
Site Investigators and Source Data Providers 2013…..……… 13
Abbreviations……… 17
List of Tables………. 18
List of Figures……… 19
Introduction……….. 20
Results Section A General Information……… 22
Section B Patient Characteristics……… 33
Section C Interventions……… 57
Section D Complications………. 70
Section E Mortality Outcomes………... 90
Section F Dengue infection 2010 - 2013………. 98
Summary………. 103
REPORT SUMMARY
This is the report on all intensive care admissions to the 51 participating centres from 1
stJanuary to
31
stDecember 2013.
The following are the main findings:
1.
The total number of ICU beds in the 49 MOH participating units was 600 with a median
bed occupancy rate of 90.2%.
2.
The number of cases analysed was 37,436, an increase of 10.5% over the previous year.
3.
The percentage of patients denied admission due to the unavailability of ICU beds had
declined from 40% to 29% in the last five years.
4.
The average age of the patients, excluding those below 18 years, was 50.3 years.
5.
The average duration of ICU and hospital stay was 4.7 and 14.4 days respectively.
6.
In MOH hospitals, 66% of ICU admissions were non-operative patients.
7.
Direct admissions to MOH ICUs from the emergency department had increased more than
three-fold over the past 10 years from 9% in 2004 to 30% in 2013.
8.
The percentage of ICU admissions with single or no organ failure (within 24 hours of ICU
admission) was 63.6%.
9.
Sepsis, head injury and community-acquired pneumonia were the three most common
diagnoses leading to ICU admission in MOH hospitals in 2013. The in-hospital mortality
rates for this group of patients were 53.4%, 22.1% and 38.9% respectively.
10.
The average SAPS II score was 36.5, which carries a predicted in-hospital mortality of
30.4%.
11.
In MOH hospitals, 77% of patients received invasive ventilation with an average duration
of 4.5 days.
12.
The percentage of patients who received non-invasive ventilation increased almost six-fold
from 3.7% in 2004 to 22.3% in 2013.
13.
The incidence of ventilator-associated pneumonia in MOH ICUs had decreased by half,
from 11.6 to 5.4 per 1000 ventilator days, in the last five years.
14.
The incidence of central venous catheter-related bloodstream infection in MOH ICUs was
0.8 per 1000 catheter days.
15.
The crude in-ICU and in-hospital mortality rates for MOH hospitals were 19.9% and 27.7%
respectively.
ACKNOWLEDGEMENT
The Technical Committee of the Malaysian Registry of Intensive Care would like to thank
the following:
All site investigators and source data providers
The heads of Department of Anaesthesia and Intensive Care of participating ICUs
Staff of the participating ICUs
Quality of Health Care Unit, Medical Development Division, Ministry of Health
Clinical Research Centre
Malaysian Society of Intensive Care
FOREWORD
The MRIC report for 2013 is a comprehensive reference document for the Ministry of
Health regarding Intensive Care Services provided in 51 participating hospitals in
Malaysia. This registry has been in existence for the past 12 years and has provided
evidence for the Ministry of Health to establish and maintain support in terms of
equipment, manpower and other resources required in improving the critical care services
in Malaysia.
This report provides an analysis of all admission to ICU from 1
stJanuary to 31
stDecember
2013. There were a total of 600 ICU beds with a bed occupancy rate of 90%. There were a
total of 37,436 cases admitted, and this was a 10.5% increase over the previous year. It was
heartening to note that patients who were denied admission to ICU had declined from
40% to 29% over the past 5 years. The percentage of patients who received non invasive
ventilation had increased almost six fold and this is in tandem with current practices. The
incidence of ventilator associated pneumonia in MOH ICUs had decreased from 11.6 to 5.4
per 1000 ventilator days in the last 5 years. The mean standardized mortality was 0.72 for
MOH ICU.
These findings are evident of great milestones achieved in the provision of intensive care
services in our country. I take this opportunity to thank Dr Ng Siew Hian who started this
registry and also the hardworking and committed team of intensivists who have
painstakingly continued working on this registry. Dr Jenny Tong, Dr Tai Li Ling and Dr
Tan Cheng Cheng have been pillars of support in the maintenance of quality intensive
care services in Malaysia and I thank them for all their your unwavering support, not
forgetting Dr Ahmad Shaltut, Dr Lim Chew Har and Dr As Niza.
I am especially thankful and feel privileged to write a caption in this report and I take this
opportunity to acknowledge all the members who have helped in making this report a
reality. I also want to express my thanks to the Medical Development Division, Ministry of
Health for their continued guidance and support.
Dr. Sivasakthi V
TECHNICAL COMMITTEE
MALAYSIAN REGISTRY OF INTENSIVE CARE 2013
Advisors Datin Dr Sivasakthi Velayuthapillai
Consultant Anaesthesiologist and Head Department of Anaesthesia and Intensive Care Hospital Kuala Lumpur
Principal Investigator Dato’ Dr Jenny Tong May Geok
Consultant Anaesthesiologist and Head Department of Anaesthesia and Intensive Care
Hospital Tuanku Ja’afar Seremban
Co-Investigators Dr Tai Li Ling
Consultant Intensivist
Department of Anaesthesia and Intensive Care Hospital Kuala Lumpur
Dr Tan Cheng Cheng Consultant Intensivist
Department of Anaesthesia and Intensive Care Hospital Sultanah Aminah Johor Bahru
Dr As-Niza Abdul Shukor
Consultant Anaesthesiologist and Head Department of Anaesthesia and Intensive Care Hospital Taiping
Dr Ahmad Shaltut Othman Consultant Intensivist
Department of Anaesthesia and Intensive Care Hospital Sultanah Bahiyah Alor Setar
Dr Lim Chew Har Consultant Intensivist
Department of Anaesthesia and Intensive Care Hospital Pulau Pinang
Project Manager Sr Lim Siew Kim
Department of Anaesthesia and Intensive Care Hospital Kuala Lumpur
Medical Development Division,
Ministry of Health
Dr Paa Mohammad Abdul Nazir Abdul Rahman Senior Principal Assistant Director
Dr Patimah bt Amin
Senior Principal Assistant Director
PARTICIPATING HOSPITALS
No. Name of hospital Abbreviation
Sites since 2002
1. Hospital Sultanah Bahiyah Alor Setar AS
2. Hospital Pulau Pinang PP
3. Hospital Raja Permaisuri Bainun Ipoh IPH
4. Hospital Kuala Lumpur KL
5. Hospital Selayang SLG
6. Hospital Tengku Ampuan Rahimah Klang KLG
7. Hospital Tuanku Ja’afar Seremban SBN
8. Hospital Melaka MLK
9. Hospital Sultanah Aminah Johor Bahru JB
10. Hospital Tengku Ampuan Afzan Kuantan KTN
11. Hospital Sultanah Nur Zahirah Kuala Terengganu KT
12. Hospital Raja Perempuan Zainab II Kota Bharu KB
13. Hospital Umum Sarawak Kuching KCH
14. Hospital Queen Elizabeth Kota Kinabalu KK
Sites since 2005
15. Hospital Sultan Abdul Halim Sungai Petani SP
16. Hospital Putrajaya PJY
17. Hospital Pakar Sultanah Fatimah Muar MUR
18. Hospital Teluk Intan TI
19. Hospital Taiping TPG
20. Hospital Seberang Jaya SJ
21. Hospital Kajang KJG
22. Hospital Tuanku Fauziah Kangar KGR
Sites since 2006
23. Subang Jaya Medical Centre SJMC
24. Hospital Sultan Haji Ahmad Shah Temerloh TML
25. Hospital Tuanku Ampuan Najihah Kuala Pilah KP
26. Hospital Sri Manjung SMJ
27. Hospital Batu Pahat BP
28. Hospital Tawau TW
29. Hospital Miri MRI
30. Hospital Kulim KLM
Sites since 2010
32 Hospital Sibu SB
33 Hospital Duchess of Kent Sandakan DKS
34 Hospital Sultan Ismail Johor Bahru SI
35 Hospital Sungai Buloh SBL
36 Hospital Ampang AMP
37 Hospital Wanita dan Kanak-Kanak Sabah LIK
Sites since 2012
38 University Malaya Medical Centre UMMC
39 Langkawi LKW
40 Bukit Mertajam BM
41 Slim River SLR
42 Port Dickson PD
43 Kuala Krai KKR
44 Segamat SGT
45 Tanah Merah TM
46 Kemaman KEM
47 Kuala Lipis KLP
48 Labuan LAB
49 Keningau KEN
50 Bintulu BIN
CATEGORIES OF ICU
Based on the number of ICU admissions in 2013, for the purpose of MRIC 2013 report
Participating sites
Number of
admissions
Participating sites with > 1000 admissions
1
Hospital Tengku Ampuan Rahimah Klang
2065
2
Hospital Sultanah Aminah Johor Bahru
1931
3
Hospital Sungai Buloh
1922
4
Hospital Kuala Lumpur
1905
5
Hospital Melaka
1673
6
Hospital Selayang
1507
7
Hospital Taiping
1348
8
Hospital Sultanah Bahiyah Alor Setar
1347
9
Hospital Raja Perempuan Zainab II Kota Bharu
1337
10
Hospital Raja Permaisuri Bainun Ipoh
1203
11
Hospital Sultanah Nur Zahirah Kuala
Terengganu
1180
12
Hospital Pulau Pinang
1121
13
Hospital Queen Elizabeth Kota Kinabalu
1022
Participating sites with 500 - 999 admissions
14
Hospital Sultan Ismail Johor Bahru
970
15
Hospital Duchess of Kent Sandakan
964
16
Hospital Umum Sarawak Kuching
950
17
Hospital Serdang
851
18
Hospital Tengku Ampuan Afzan Kuantan
837
19
Hospital Pakar Sultanah Fatimah Muar
675
20
Hospital Putrajaya
606
21
Hospital Sultan Haji Ahmad Shah Temerloh
599
22
Hospital Sultan Abdul Halim Sungai Petani
583
23
Hospital Ampang
566
24
Hospital Kulim
561
25
Hospital Wanita dan Kanak-Kanak Sabah
517
26
Hospital Sibu
506
Participating sites with < 500 admissions
28
Hospital Tuanku Ja’afar Seremban
471
29
Hospital Sultanah Nora Ismail Batu Pahat
459
30
Hospital Tawau
449
31
Hospital Seberang Jaya
413
32
Hospital Teluk Intan
401
33
Hospital Tuanku Ampuan Najihah Kuala Pilah
394
34
Hospital Sri Manjung
376
35
Hospital Tuanku Fauziah Kangar
322
36
Hospital Kajang
321
37
Hospital Bintulu
260
38
Hospital Port Dickson
245
39
Hospital Lahad Datu
244
40
Hospital Kuala Krai
240
41
Hospital Slim River
225
42
Hospital Langkawi
180
43
Hospital Labuan
165
44
Hospital Keningau
161
45
Hospital Segamat
159
46
Hospital Bukit Mertajam
158
47
Hospital Tanah Merah
127
48
Hospital Kuala Lipis
116
49
Hospital Kemaman
105
Private hospital
50
Subang Jaya Medical Centre
1335
University hospital
LIST OF SITE INVESTIGATORS AND SOURCE DATA COLLECTORS
January
–
December 2013
No Hospital Site investigator Source data collectors
1 Sultanah Bahiyah Alor Setar Dr Ahmad Shaltut Othman Sr Teoh Shook Lian SN Hafisoh Ahmad SN Haslina Khalid SN Norashikin Man SN Noorazimah Salleh
2 Pulau Pinang Dr Lim Chew Har SN Siti Hazlina Bidin SN Rosmawati Yusoff
SN Emeelia Zuzana Abdul Wahab
3 Raja Permaisuri Bainun Ipoh Dr Foong Kit Weng SN Saadiah Bidin SN Ng Pek Yoong
4 Kuala Lumpur Dr Tai Li Ling SN Salmi Zawati Serif SN Ismee Jusoh
5 Selayang Dr Laila Kamariah Kamalul Baharin
SN Nor Zaila Saad@ Senafi SN Noor Azwati Daud
6 Tengku Ampuan Rahimah Klang
Dr Sheliza Wahab SN Latifah Omar SN Tai Yoke Ching
SN Rosenah Abdul Rahman
7 Tuanku Ja’afar Seremban Dato’ Dr Jenny Tong May Geok
Sr Lim Yek Fong
SN Farawahida Ahmad (till Sept 2013) SN Normah Abdul Taib (from Sept 2013)
8 Melaka Dr Nahla Irtiza Ismail SN Morni Omar (till Aug 2013) SN Noriza Rawi
Sr Zaliha Emperan SN Norina Abd Kadir
9 Sultanah Aminah Johor Bahru
Dr Tan Cheng Cheng Sr Marian Sais ak Sipit SN Aishah Abu Bakar
AMO Mohd Zakuan Mohd Nor AMO Hairizam Zulkhifli AMO Mohd Adib Jasni AMO Anand Sivasamy
10 Tengku Ampuan Afzan Kuantan
Dr Muhammad Zihni Abdullah
Sr Salina Sulaiman Sr Gan Soo Heng SN Amimah Abd Hamid SN Nur Azura Hamzah
11 Sultanah Nur Zahirah Kuala Terengganu
Dr Mohd Ridhwan Mohd Nor
SN Zauwiah Idris SN Aslinawati Chik
Sr Norhayati Abd Rahman (till Nov 2013)
12 Raja Perempuan Zainab II Kota Bharu
Dr Wan Nasrudin Wan Ismail
Sr Azilah Ishak SN Azizum Ismail SN Suzana Yusof
14 Queen Elizabeth Kota Kinabalu
Dr Khoo Tien Meng Sr Safiah Mokhtar
SN Conny Chong Chiew Fah SN Aslinda Ahmad
SN Saihin Maun
15 Sultan Abdul Halim Sungai Petani
Dr Rosman Noor Ali Sr Rafizah Md Zuki Sr Puziah Yahya SN Hamiza Mohd Noor SN Zainun Awang
16 Putrajaya Dr Fauziah Yusoff SN Latifah Mohd Korib SN Maznah Muhamad
17 Pakar Sultanah Fatimah Muar
Dr Suzaliatun Kasbolah SN Roslina Othman SN Mazlidah Osman SN Nurazlin Jawad SN Fazal Naim Ramli
18 Teluk Intan Dr Noor Azira Haron SN Azliza Zakaria SN Rohayu Dalila Yusof SN Puspavali a/p Punusamy
19 Taiping Dr As-Niza Abdul Shukor SN Salihah Ahmad SN Che Zakiah Othman SN Rozieyana Mohd Razali SN Saleha bt Salleh (till Dec.2013)
20 Seberang Jaya Dr Jeffry Wong Kep Kee (till Jun 2013)
Dr Teoh Wei Tsung
Sr Nooraslina Othman (till Dec 2013) SN Nur Hasniza Abdul Aziz
21 Kajang Dr Wan Hafizah Wan Tajul Ariffin
Sr Normaizana Ismail Sr Nurafidah Mohamad Rasip SN Saiza Mat Yusof
22 Tuanku Fauziah Kangar Dr Azilah Desa Sr Chua Pek Hong SN Zarina Mat Bistaman SN Norazlisyan Ramli
23 Subang Jaya Medical Center Dr Wong Ket Hiung Ms Navjeet Kaur
SN Normazimah Mohamad Nazar
24 Sultan Haji Ahmad Shah Temerloh
Dr Rahimah Haron Sr Rakiah Mohd Noor SN Norliza Ismail SN Rohayu Yusof SN Joliena Jaafar SN Aida Azlina Ali
25 Tuanku Ampuan Najihah Kuala Pilah
Dr Zalifah Nordin Sr Lee New
SN Norhafidah Ismail
26 Sri Manjung Dr Khairudin Zainal Abidin Sr Rohani Ali
SN Hartini Abd Rahman SN Salbiah Abdul Rashid SN Norfaizal Abdul Majid
28 Tawau Dr Muzaffar Mohamad (till August 2013)
Dr Sein Win
SN Lilybeth Feliciano Ferez SN Sarwah Isa
SN Sharifah Maznah Habib Muhammad Sr Haliza Kasau
29 Miri Dr Rozaini Ahmad
Dr Lim Hong Jin
SN Noriah Ilai SN Zuriha Achim
30 Kulim Dr Chua Kok Boon
Dr Loh Hoong Heng
SN Mohana Omar
SN Bahayah Mohamed Bakari SN Che Asmah Haji Md Isa
31 Serdang Dr Nazarinna Muhamad Sr Norain Saad SN Sarina Jamhari
Sr Hamidah Mat Rasip (till May 2013)
32 Sibu Dr Anita Alias Sr Wong Chen Chen
SN Yong Suk Moi
33 Duchess of Kent Sandakan Dr Rusnah Abd Rahman Sr Noorasmah Hassim SN Norahimah Dulraman SN Sofiah Yampi
34 Sultan Ismail Johor Bahru Dr Mohd Zaini Laman Sr Azleena Mohd Yusop SN Huzaimah Jahir SN Norwati Jamiran SN Norelessa Abd Aziz
35 Sungai Buloh Dr Shanti Ratnam Sr Sri Jayanthi Gobalan Sr Noorhaidah Baharuddin SN Norazlina Kasban
36 Ampang Dr Rusnah Ab.Latif SN Normazlin Md Derus SN Amiza Dyana Abu Amin
37 Wanita dan Kanak-Kanak Sabah
Dr Lorrain Lim SN Siti Rajiah bt Muslimin SN Dayang Noreenz Mohd Yusoh SN Yusnita bt Yunus
38 University Malaya Medical Centre
Dr Khadijah Zulkifli
Sr Hamiza Harun
40 Bukit Mertajam Dr Nur Sabrina Mohd Sabry Sr Teng Get Sim (till Aug 2013) Sr Thanaletchimi Packirisamy SN Faizah Abdul
41 Slim River Dr Tin Tin Myint
Dr Iqbalmumauwir bin Abd Rashid
Sr Khairol Nazimah Musa SN Suliati Baghdadi
42 Port Dickson Dr Hema Malini Manogharan
Sr Hapisah Mat
SN Muhazni Mohammad
43 Kuala Krai Dr Mustaza bin Jamaluddin (till Jun 2013)
Dr Norhafidza Ghazali
44 Segamat Dr Wirza Feldi Bin Sawir SN Hasneyza Bakar Sr Noryati Ab Majid
45 Tanah Merah Dr Mohd Azmi Mamat Sr Roslawani bt Ghazali SN Fadilah bt Mohd Nor
46 Kemaman Dr Ahmad Nizam Ismail Sr Sabariah Embong (till July 2013) Sr Rosmazariawati Zahari
47 Kuala Lipis Dr Wan Satifah Wan Ngah Sr W. Norlizer W.Muda SN Nik Arienti Nik Man
48 Labuan Dr Betty Shee Sr Roslin Akiu
SR Loinsah Sibin
49 Keningau DrSeinWin (tillAugust2013) Dr. Fazilawati Zakaria
Sr Beatrice Olas Sr Haineh Amin
50 Bintulu Dr Norizawati bt Dzulkifli Sr Jennifer Anak Sahim Sr Raimah Sebli SN Ann Lampung SN Yuhana Dalang
ABBREVIATIONS
Adm. Admission
AKI Acute kidney injury
ALI Acute lung injury
AMO Assistant medical officer
AOR At own risk
APACHE II Acute Physiologic and Chronic Health Evaluation (Version II)
ARDS Acute respiratory distress syndrome
BOR Bed occupancy rate
CRBSI Catheter related bloodstream infection
CRRT Continuous renal replacement therapy
CVC Central venous catheter
CVC-BSI Central venous catheter-related bloodstream infection
ED Emergency department
ENT Otorhinolaryngology
HD Haemodialysis
HDU High dependency unit
Hosp Hospital
Hrs Hours
ICU Intensive care unit
MOH Ministry of Health
MRIC Malaysian Registry of Intensive Care
MV Mechanical ventilation
NAICU National Audit on Adult Intensive Care Units
NIV Non-invasive ventilation
NHSN National Healthcare Safety Network
No./n Number
O&G Obstetrics & Gynaecology
PaCO2 Partial pressure of arterial carbon dioxide
PaO2 Partial pressure of arterial oxygen
Refer. Referred
SAPS II Simplified Acute Physiologic Scoring System (Version II)
SD Standard deviation
SIRS Systemic inflammatory response syndrome SMR Standardised mortality ratio
SN Staff nurse
SOFA Sequential Organ Failure Assessment
Sr Sister
SPSS Statistical Package for Social Sciences VAP Ventilator-associated pneumonia VCB Ventilator care bundle
Yrs Years
LIST OF TABLES
Page
Table 1 No. of ICU beds and ICU bed occupancy rate, by MOH hospitals 2009 - 2013………. 23
Table 2 ICU admissions, by individual hospital 2009 – 2013……….. 25
Table 3 Reporting rates, by individual hospital 2009 – 2013………... 29
Table 4 Intensive care referrals and refusal of admission, by individual hospital 2009 – 2013……….. 31
Table 5 Gender 2009 – 2013……….. 34
Table 6 Mean age 2009 – 2013……….. 34
Table 7 Ethnic groups 2013………... 35
Table 8 Length of ICU stay, by individual hospital 2009 – 2013………. 36
Table 9 Length of hospital stay, by individual hospital 2009 – 2013……….. 38
Table 10 Referring units, by category of ICU 2013 ………. 40
Table 11 Category of patients, by category of ICU 2013……… 41
Table 12 Category of patients in MOH hospitals 2009 – 2013………... 42
Table 13 Location before ICU admission, by category of ICU 2013………. 43
Table 14 Location before ICU admission in MOH hospitals 2009 – 2013……… 44
Table 15 Main organ failure on ICU admission, by category of ICU 2013………. 45
Table 16 Number of organ failure(s) on ICU admission, by category of ICU 2013………... 46
Table 17 Ten most common diagnoses leading to ICU admission 2013……….. 47
Table 18 Ten most common diagnoses leading to ICU admission using APACHE II diagnostic category 2013……….... 49
Table 19 Severe sepsis, ARDS and AKI within 24 hours of ICU admission 2013……….. 50
Table 20 Severe sepsis, ARDS and AKI within 24 hours of ICU admission, by individual hospital 2011 - 2013……… 51
Table 21 SAPS II score, by individual hospital 2009 – 2013………... 53
Table 22 SOFA score, by individual hospital 2009 – 2013……….. 55
Table 23 Invasive ventilation, non-invasive ventilation and reintubation, by category of ICU 2013…. 58 Table 24 Duration of invasive ventilation, by individual hospital 2009 – 2013……….. 60
Table 25 Renal replacement therapy and modalities of therapy, by category of ICU 2013……….. 61
Table 26 Tracheostomy, by category of ICU 2013………... 63
Table 27 Tracheotomy, by individual hospital 2013………... 64
Table 28 Tracheostomy, by individual hospital 2009 -2013………... 65
Table 29 Withdrawal /withholding of therapy, by individual hospital 2009 – 2013……… 67
Table 30 Ventilator-associated pneumonia, by individual hospital 2009 – 2013………. 70
Table 31 Onset of VAP from initiation of invasive ventilation, by individual hospital 2009 – 2013…… 71
Table 32 Ventilator care bundle compliance, by individual hospital 2010 – 2013………. 74
Table 33 Bacteriological cultures in VAP, by category of ICU 2013………. 77
Table 34 Bacteriological cultures in VAP 2008 – 2013……… 78
Table 35 Extra length of mechanical ventilation, ICU stay and crude in-hospital mortality in patients with VAP 2013 79 Table 36 Unplanned extubation, by individual hospital 2009 –2013……… 80
Table 37 Pressure ulcer, by individual hospital 2009 - 2013 ………. 83
Table 38 Compliance to central venous catheter care bundle and incidence of central venous catheter- r related bloodstream infection 2013………. 86 Table 39 Bacteriological cultures in CVC-BSI 2013……… 88
Table 40 ICU outcome, by category of ICU 2013………91
Table 41 Hospital outcome, by category of ICU 2013 ………91
Table 42 Crude in-ICU and in-hospital mortality rates, by individual hospital 2009 –2013…………... 92
Table 43 Ten most common diagnoses leading to ICU admission in MOH hospitals and observed In-hospital mortality 2009 - 2013……….95
Table 44 Severe sepsis, ARDS and AKI within 24hrs of ICU admission and observed in-hospital mortality 2010 –2013……… 95 Table 45 Standardised mortality ratio, by individual hospital 2009 - 2013……… 96
Table 46 General comparison for dengue infection MOH ICUs 2010 - 2013………100
LIST OF FIGURES
Page
Figure 1 ICU admissions 2003 – 2013……….………. 26
Figure 2 ICU admissions, by participating centres 2013 ………. 27
Figure 3 Age groups 2013 ………... 34
Figure 4 Ethnic groups 2013 ………... 35
Figure 5 Referring units, by category of ICU 2013 ………41
Figure 6 Category of patients, by category of ICU 2013 ………. 42
Figure 7 Category of patients 2004 – 2013………. 42
Figure 8 Location before ICU admission, by category of ICU 2013 ……….. 43
Figure 9 Location before ICU admission in MOH hospitals 2004 – 2013………. 44
Figure 10 Main organ failure on ICU admission, by category of ICU 2013……… 45
Figure 11 Number of organ failure(s) on ICU admission, by category of ICU2013……… 46
Figure 12 Ten most common diagnoses leading to ICU admission in MOH hospitals 2013…….. 48
Figure 13 Invasive ventilation, by category of ICU 2013………... 58
Figure 14 Non-invasive ventilation, by category of ICU 2013………. 58
Figure 15 Non-invasive ventilation, MOH hospitals 2005 – 2013 ………... 59
Figure 16 Reintubation, MOH hospitals 2005 – 2013………... 59
Figure 17 Modalities of renal replacement therapy, by category of ICU 2013 ………. 62
Figure 18 Techniques of tracheostomy, by category of ICU 2013 ………... 63
Figure 19 Ventilator associated pneumonia 2004 - 2013 ……….. 72
Figure 20 Ventilator associated pneumonia, by individual hospital 2013……….. 73
Figure 21 Ventilator care bundle compliance and VAP 2007 – 2013………... 75
Figure 22 Bacteriological cultures in VAP, by category of ICU 2013 ………. 77
Figure 23 Common bacteriological cultures in VAP 2007 – 2013………. 78
Figure 24 Unplanned extubation, by individual hospital 2013……… 82
Figure 25 Pressure ulcers, by individual hospital 2013………. 85
INTRODUCTION
The National Audit on Adult Intensive Care Units (NAICU) was established in 2002 as
a quality improvement initiative to systematically review the intensive care practices in
Malaysia and where possible, to introduce remedial measures to improve outcome. To
date, this audit has published ten yearly reports and introduced several quality
measures such as ventilator care bundle and central venous catheter care bundle.
In 2009, the NAICU was renamed the Malaysian Registry of Intensive Care (MRIC).
This report is the sixth for MRIC, but eleventh in the series.
The objectives of this registry are to:
1.
Establish a database of patients admitted to the adult ICUs
2.
Review the clinical practices of intensive care
3.
Determine clinical outcome
4.
Determine the resources and delivery of intensive care service
5.
Evaluate the impact of quality improvement measures on patient care
6.
Provide comparisons of performance of participating centres against national
and international standards
7.
Conduct healthcare research related to intensive care
In 2002, 14 state hospitals were first recruited into the audit. The number of centres
increased to 22 in 2005. In 2006, 9 more centres were added to the list of participating
sites, including one private hospital in Selangor. In 2010, 6 more centres were added to
the list of 31 participating hospitals. In 2012, the total number of participating centres
expanded to 51 with 49 MOH hospitals, 1 private hospital and 1 university hospital.
This report describes the intensive care practices and outcomes in 49 ICUs in MOH, 1
ICU in a private hospital and 1 ICU in a university hospital.
Data Collection and Verification
Data were collected prospectively by trained nurses (source data providers) and
specialists (site investigators) based on a written protocol. Data was initially collected
on a standard e-case report form for each patient. Since 1
stJanuary 2010, data were
entered directly in a central depository via a web-based programme by individual
centres.
Merged data were ‘cleaned’ and verified before being an
alysed using SPSS version
20.0.0.
This report is based on all admissions into the 51 participating ICUs from 1
stJanuary to
31
stDecember 2013. The total number of admissions in 2013 was 38,780 out of which
1344 (3.5%) were readmissions. For patients with multiple ICU admissions, only the
first admission was included in the analysis.
Due to missing and inconsistent data, the sum total of some variables shown in the
tables may not add up to the actual number of admissions.
Data Limitations
Limitations to the registry data were mainly related to data collection and data entry.
Some of the participating ICUs experienced rapid turnover of their site investigators
and source data providers resulting in under-reporting and data inconsistencies. Data
from several centres with low reporting rates were excluded from some of the analysis
of the variables.
Format of Report
The format of this report follows the patient
’s
journey in four sections: demographics,
interventions, complications and outcomes. Information is reported on a total of 37,436
ICU admissions.
In this report, information was provided for individual centres. Wherever appropriate,
comparisons were made between three categories of hospitals based on the number of
ICU admissions. MOH hospitals were divided into three categories: centres with 1000
admissions and more, centres with 500 to 999 admissions and those with less than 500
admissions.
Where relevant, trends of certain variables over the years were reported.
SECTION A:
Table 1 :
No. of ICU beds and occupancy rate, by MOH hospitals 2009
–
2013
Hospital
Number of functional ICU beds (as of 31-12-2013)
Median ICU bed occupancy rate %
2009 2010 2011 2012 2013
AS 24 88.6 83.2 87.0 96.7 93.3
PP 22 81.3 61.5 89.9 88.7 90.9
IPH 24 103.0 104.0 107.0 106.0 104.0
KL 30 108.6 109.3 107.5 111.7 110.6
SLG 22 72.6 97.7 111.4 99.8 101.8
KLG 29* 198.7 91.9 87.8 108.3 105.9
SBN 8 111.8 114.0 118.4 114.6 108.3
MLK 22* 84.2 88.1 106.0 107.9 97.5
JB 29 115.1 108.7 106.2 105.6 109.4
KTN 12* 102.2 103.0 105.2 106.4 106.5
KT 18 115.2 93.9 102.0 103.6 104.6
KB 21 86.6 88.5 80.8 80.0 96.2
KCH 16 101.5 104.9 116.6 125.9 101.0
KK 21 87.3 100.1 101.7 93.4 95.9
SP 16 79.3 80.9 84.6 84.9 92.5
PJY 11 88.4 89.5 78.2 75.2 71.2
MUR 8 72.6 89.6 82.4 97.5 97.5
TI 4 86.5 91.0 101.3 123.8 105.2
TPG 20 83.6 98.4 103.2 92.7 84.7
SJ 8 101.9 90.7 89.6 99.1 80.2
KJG 6* 75.8 75.6 78.9 77.2 77.1
KGR 5 71.8 70.2 63.3 77.3 78.1
TML 10* 119.0 110.5 104.0 113.0 127.0
KP 8* 51.0 56.2 68.5 61.8 72.4
SMJ 8 71.6 79.0 82.4 92.7 85.5
BP 7 77.0 71.4 69.0 87.0 79.6
TW 7 45.9 82.5 60.6 80.7 70.0
MRI 8 54.5 79.7 72.7 76.1 79.6
KLM 7* 121.2 99.2 98.9 100.5 95.4
SDG 16* 102.0 87.4 88.2 50.4 84.4
SB 14 - 102.6 99.2 60 120.5
DKS 18 - 116.2 87.9 87.9 99.1
SI 17 - 79.2 87.3 86.2 90.2
SBL 32* - 118.2 108.1 94.6 94.0
AMP 12 - 89.0 85.5 45.7 82.9
LIK 6 - 62.0 76.7 76.9 106.0
LKW 4* - - - 67.0 67.4
SLR 7* - - - 76.0 71.0
PD 4 - - - 85.5 65.6
KKR 4 - - - 69.8 85.2
SGT 4 - - - 58.1 89.7
TM 2* - - - 68.7 74.0
KEM 2 - - - 59.6 50.9
KLP 3* - - - 21.8 53.0
LAB 5* - - - 30.7 41.2
KEN 4 - - - 90.4 78.0
BIN 5 - - - 88.3 63.2
LD 4 - - - 104.2 101.2
Total 600 - - -
Median - 87.0 90.2 88.6 86.2 90.2
* These hospitals did not report the number of ICU beds for 2013 to the Head of Anaesthesia service. These figures represent the number of ICU beds for 2012.
The total number of ICU beds in the 49 MOH hospitals as of 31
stDecember 2013 was
600 with a median bed occupancy rate (BOR) of 90.2%. There was a 2% increase (11) in
the number of ICU beds from the previous year.
Table 2 :
ICU admissions, by individual hospital 2009
–
2013
Hospital
2009 2010 2011 2012 2013
n (%) n (%) n (%) n (%) N (%)
AS 1121 (5.3) 1094 (4.1) 1212 (4.1) 1201 (3.5) 1347 (3.6)
PP 505 (2.4) 911 (3.4) 1198 (4.0) 1287 (3.8) 1121 (3.0)
IPH 924 (4.3) 1143 (4.2) 1140 (3.8) 926 (2.7) 1203 (3.2)
KL 1768 (8.3) 1947 (7.2) 1842 (6.2) 1971 (5.8) 1905 (5.1)
SLG 888 (4.2) 1053 (3.9) 1141 (3.8) 1289 (3.8) 1507 (4.0)
KLG 1080 (5.1) 1215 (4.5) 1608 (5.4) 2136 (6.3) 2065 (5.5)
SBN 510 (2.4) 542 (2.0) 554 (1.9) 537 (1.6) 471 (1.3)
MLK 1439 (6.8) 1636 (6.1) 1593 (5.3) 1694 (5.0) 1673 (4.5)
JB 1245 (5.9) 1443 (5.3) 1685 (5.7) 1752 (5.2) 1931 (5.2)
KTN 613 (2.9) 744 (2.8) 612 (2.1) 641 (1.9) 837 92.2)
KT 824 (3.9) 1087 (4.0) 1207 (4.1) 1363 (4.0) 1180 (3.2)
KB 803 (3.8) 826 (3.1) 1125 (3.8) 1286 (3.8) 1337 (3.6)
KCH 461 (2.2) 512 (1.9) 643 (2.2) 854 (2.5) 950 (2.5)
KK 319 (1.5) 808 (3.0) 843 (2.8) 954 (2.8) 1022 (2.7)
SP 261 (1.2) 207 (0.8) 270 (0.9) 159 (0.5) 583 (1.6)
PJY 397 (1.9) 523 (1.9) 537 (1.8) 574 (1.7) 606 (1.6)
MUR 774 (3.6) 759 (2.8) 473 (1.6) 636 (1.9) 675 (1.8)
TI 262 (1.2) 276 (1.0) 308 (1.0) 384 (1.1) 401 (1.1)
TPG 867 (4.1) 834 (3.1) 860 (2.9) 1203 (3.5) 1348 (3.6)
SJ 599 (2.8) 590 (2.2) 579 (1.9) 644 (1.9) 413 (1.1)
KJG 265 (1.2) 323 (1.2) 341 (1.1) 371 (1.1) 321 (0.9)
KGR 302 (1.4) 294 (1.1) 298 (1.0) 350 (1.1) 322 (0.9)
SJMC 2085 (9.8) 1578 (5.8) 2018 (6.8) 1467 (4.3) 1335 (3.6)
TML 607 (2.9) 624 (2.3) 543 (1.8) 436 (1.3) 599 (1.6)
KP 165 (0.8) 234 (0.9) 359 (1.2) 334 (1.0) 394 (1.1)
SMJ 336 (1.6) 314 (1.2) 380 (1.3) 403 (1.2) 376 (1.0)
BP 397 (1.9) 409 (1.5) 454 (1.5) 415 (1.2) 459 (1.2)
TW 215 (1.0) 238 (0.9) 274 (0.9) 433 (1.3) 449 (1.2)
MRI 212 (1.00 302 (1.1) 385 (1.3) 478 (1.4) 481 (1.3)
KLM 343 (1.6) 474 (1.8) 498 (1.7) 601 (1.8) 561 (1.5)
SDG 679 (3.2) 824 (3.1) 883 (3.0) 875 (2.6) 851 (2.3)
SB - 471 (1.7) 569 (1.9) 490 (1.4) 506 (1.4)
DKS - 246 (0.9) 526 (1.8) 526 (1.6) 964 (2.6)
SI - 568 (2.1) 647 (2.2) 806 (2.4) 970 (2.6)
SBL - 1234 (4.6) 1260 (4.2) 1583 (4.7) 1922 (5.1)
AMP - 534 (2.0) 553 (1.9) 572 (1.7) 566 (1.5)
LIK - 160 (0.6) 376 (1.3) 270 (0.8) 517 (1.4)
LKW - - - 157 (0.5) 180 (0.5)
BM - - - 38 (0.1) 158 (0.4)
SLR - - - 154 (0.5) 225 (0.6)
PD - - - 204 (0.6) 245 (0.7)
KKR - - - 149 (0.4) 240 (0.6)
SGT - - - 127 (0.4) 159 (0.4)
TM - - - 17 (0.1) 127 (0.3)
KEM - - - 94 (0.3) 105 (0.3)
KLP - - - 7 (0.0) 116 (0.3)
LAB - - - 107 (0.3) 165 (0.4)
KEN - - - 82 (0.2) 161 (0.4)
BIN - - - 213 (0.6) 260 (0.7)
LD - - - 168 (0.5) 244 (0.7)
Total 21266 (100) 26977 (100) 29794 (100) 33892 (100) 37436 (100)
Figure 2 :
ICU admissions, by participating centres 2013
0 500 1000 1500 2000 2500
AS PP IPH KL SLG KLG SBN MLK JB KTN KT KB KCH KK SP PJY MUR TI TPG SJ KJG KGR SJMC TML KP SMJ BP TW MRI KLM SDG SB DKS SI SBL AMP LIK UM LKW BM SLR PD KKR SGT TM KEM KLP LAB KEN BIN LD
H
o
sp
ita
ls
The number of admissions had increased over the years in the MOH hospitals. There
was an increase of 76% over the past five years from 2009 to 2013. This was attributed to
the increase in the number of participating centres, increase in the number of ICU beds
in the existing centres and an increase in ICU admissions.
For the initial cohort of 14 hospitals recruited in 2002, the number of admissions
increased from 12,500 to 18,549 (an increase of 48%) over the last 5 years. There was an
increase of 39% in the number of ICU beds from 214 to 298 in the centres of the same
cohort.
Readmission within 48 to 72 hours is commonly used as an indicator of intensive care
patient management, as it might reflect premature ICU discharge or substandard ward
care. Although readmission is associated with high mortality, it is unclear whether it
reflects substandard practices within a hospital. Low readmission rate may be due to
inability to admit patients due to unavailability of ICU beds.
The readmission rate within the first 48 hours of ICU discharge for the 49 MOH centres
was 1.3% in 2013. This rate has varied from 1.2% to 2.1% over the past five years. In a
retrospective study done from 2001 to 2007, in 106 ICUs in United States of America,
approximately 2% of ICU patients discharged to the ward were readmitted within 48
hours [1].
Table 3 :
Reporting rates, by individual hospital 2009
–
2013
Hospital 2009
%
2010 %
2011 %
2012 %
2013 %
AS 93 92.2 98.2 93.1 99.6
PP 93 87.4 90.1 96.2 92.2
IPH 96 96.3 99.2 97.5 95.9
KL 95 94.8 98.7 98.5 95.0
SLG 84 94.8 95.0 97.6 95.3
KLG 92 91.1 86.0 97.3 97.7
SBN 97 96.4 99.5 99.3 97.3
MLK 92 94.8 99.5 98.8 95.2
JB 97 97.4 99.8 97.2 95.7
KTN 96 94.8 99.0 97.2 124.4*
KT 90 96.1 99.8 99.1 95.0
KB 94 95.7 94.4 98.7 83.0
KCH 89 87.5 94.3 95.3 89.6
KK 60 89.4 95.4 94.9 95.2
SP 50 38.5 53.1 30.8 106.0*
PJY 87 96.5 99.1 98.0 92.9
MUR 80 63.0 97.4 94.6 98.0
TI 97 92.0 98.4 91.2 90.3
TPG 95 95.5 94.0 99.3 95.5
SJ 96 95.2 98.5 98.3 85.7
KJG 87 81.4 95.5 99.7 75.2
KGR 94 97.0 98.1 98.6 94.2
TML 86 87.4 81.4 62.6 68.3
KP 98 98.3 100.0 66.4 51.0
SMJ 100 95.4 100.0 99.5 97.9
BP 90 95.1 98.5 97.9 106.3*
TW 93 78.3 91.7 98.6 95.5
MRI 65 94.1 88.5 99.2 97.6
KLM 97 95.2 98.9 98.5 94.1
SDG 94 66.7 94.9 90.5 108.4*
SB - 74.8 73.1 70.0 46.7
DKS - 54.8 99.6 95.5 92.7
SI - 92.4 86.3 94.6 97.3
SBL - 92.5 100.0 90.7 82.0
AMP - 95.5 85.2 100.0 97.1
LIK - 27.2 60.9 57.4 80.7
LKW - - - 69.8 87.4
BM - - - 11.3 39.4
PD - - - 84.0 93.2
KKR - - - 87.1 94.9
SGT - - - 41.2 50.5
TM - - - 22.4 104.1*
KEM - - - 75.2 82.0
KLP - - - 36.8 87.9
LAB - - - 96.4 91.2
KEN - - - 16.4 59.2
BIN - - - 75.5 80.5
LD - - - 67.2 92.4
* These hospitals had reporting rates more than 100%.
The reporting rate is calculated by comparing the number of ICU admissions reported
to the MRIC and to the national census, collected by the Head of Anaesthesia service.
The total number reported to the MRIC should be equal or slightly less than that of the
national census, as patients who were still in hospital on 31
stJanuary 2013 were
excluded in the analysis.
SLR - - - 55 10.9 166 7.2
PD - - - 216 7.4 249 1.6
KKR - - - 49 24.5 105 27.6
SGT - - - * * * *
TM - - - * * 95 3.2
KEM - - - 60 1.7 119 12.6
KLP - - - * * 100 3.0
LAB - - - * * * *
KEN - - - 46 4.4 * *
BIN - - - * * * *
LD - - - * * * *
Total 18365 40.0 22861 36.5 25321 34.2 31341 32.0 37962 29.4
*
Missing dataThe reason for ICU refusal for the purpose of this registry was limited to the
unavailability of ICU beds. Over the past five years, the percentage of patients denied
ICU admission has reduced steadily due to the overall increase in the number of ICU
beds in most MOH hospitals.
SECTION B:
Table 5 :
Gender 2009-2013
Gender
2009 n (%)
2010 n (%)
2011 n (%)
2012 n (%)
2013 n (%)
Male 12489 (58.7) 16040 (59.6) 17788 (59.7) 20295 (60.0) 22331 (59.7)
Female 8768 (41.3) 10875 (40.4) 11968 (40.2) 13554 (40.0) 15048 (40.3)
The ratio of male to female patients (3:2) has remained fairly constant over the years.
Table 6 :
Mean age (years) 2009
–
2013
Age 2009 2010 2011 2012 2013
All ages,
Mean + SD yrs 46.5 ± 20.9 45.6 ± 20.6 46.5± 20.7 46.6 ± 20.7 46.46 ± 20.6
Age ≥ 18 years
Mean + SD yrs 50.3 ± 18.1 49.4 ± 18.1 50.2± 18.0 50.3 ± 17.8 50.27 ± 17.7
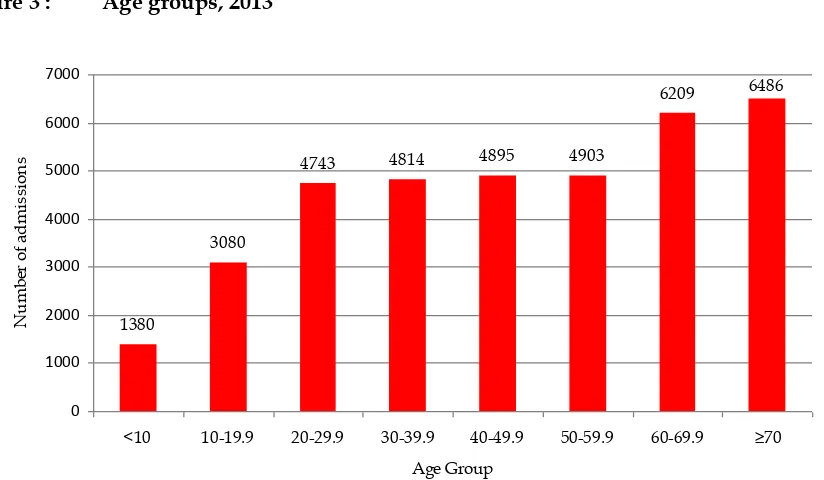
The average age for all age groups was 46.5 + 20.6 years (median 48.8 years). For adult
patients, with age exceeding 18 years, the average age was 50.3 + 17.7 years (median
51.9 years). The average age of patients admitted to ICUs has remained almost the
same over the last 5 years.
Figure 3 :
Age groups, 2013
1380
3080
4743 4814 4895 4903
6209 6486
0 1000 2000 3000 4000 5000 6000 7000
<10 10-19.9 20-29.9 30-39.9 40-49.9 50-59.9 60-69.9 ≥70
Age Group
N
u
m
b
er
o
f
a
d
m
is
si
o
n
s
.
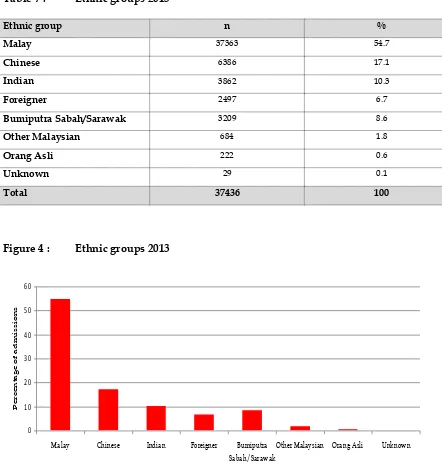
Table 7 :
Ethnic groups 2013
Ethnic group n %
Malay 37363 54.7
Chinese 6386 17.1
Indian 3862 10.3
Foreigner 2497 6.7
Bumiputra Sabah/Sarawak 3209 8.6
Other Malaysian 684 1.8
Orang Asli 222 0.6
Unknown 29 0.1
Total 37436 100
Figure 4 :
Ethnic groups 2013
0 10 20 30 40 50 60
Malay Chinese Indian Foreigner Bumiputra Sabah/Sarawak
Other Malaysian Orang Asli Unknown
P
e
r
c
e
n
ta
g
e
o
f
a
d
m
is
s
io
n
s
..
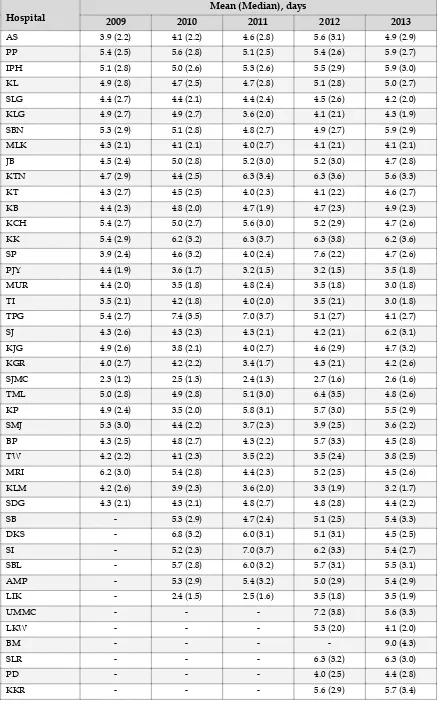
Table 8 :
Length of ICU stay, by individual hospital 2009
–
2013
Hospital
Mean (Median), days
2009 2010 2011 2012 2013
AS 3.9 (2.2) 4.1 (2.2) 4.6 (2.8) 5.6 (3.1) 4.9 (2.9)
PP 5.4 (2.5) 5.6 (2.8) 5.1 (2.5) 5.4 (2.6) 5.9 (2.7) IPH 5.1 (2.8) 5.0 (2.6) 5.3 (2.6) 5.5 (2.9) 5.9 (3.0) KL 4.9 (2.8) 4.7 (2.5) 4.7 (2.8) 5.1 (2.8) 5.0 (2.7)
SLG 4.4 (2.7) 4.4 (2.1) 4.4 (2.4) 4.5 (2.6) 4.2 (2.0) KLG 4.9 (2.7) 4.9 (2.7) 3.6 (2.0) 4.1 (2.1) 4.3 (1.9) SBN 5.3 (2.9) 5.1 (2.8) 4.8 (2.7) 4.9 (2.7) 5.9 (2.9)
MLK 4.3 (2.1) 4.1 (2.1) 4.0 (2.7) 4.1 (2.1) 4.1 (2.1) JB 4.5 (2.4) 5.0 (2.8) 5.2 (3.0) 5.2 (3.0) 4.7 (2.8) KTN 4.7 (2.9) 4.4 (2.5) 6.3 (3.4) 6.3 (3.6) 5.6 (3.3)
KT 4.3 (2.7) 4.5 (2.5) 4.0 (2.3) 4.1 (2.2) 4.6 (2.7) KB 4.4 (2.3) 4.8 (2.0) 4.7 (1.9) 4.7 (2.3) 4.9 (2.3) KCH 5.4 (2.7) 5.0 (2.7) 5.6 (3.0) 5.2 (2.9) 4.7 (2.6)
KK 5.4 (2.9) 6.2 (3.2) 6.3 (3.7) 6.3 (3.8) 6.2 (3.6) SP 3.9 (2.4) 4.6 (3.2) 4.0 (2.4) 7.6 (2.2) 4.7 (2.6) PJY 4.4 (1.9) 3.6 (1.7) 3.2 (1.5) 3.2 (1.5) 3.5 (1.8)
MUR 4.4 (2.0) 3.5 (1.8) 4.8 (2.4) 3.5 (1.8) 3.0 (1.8) TI 3.5 (2.1) 4.2 (1.8) 4.0 (2.0) 3.5 (2.1) 3.0 (1.8) TPG 5.4 (2.7) 7.4 (3.5) 7.0 (3.7) 5.1 (2.7) 4.1 (2.7)
SJ 4.3 (2.6) 4.3 (2.3) 4.3 (2.1) 4.2 (2.1) 6.2 (3.1) KJG 4.9 (2.6) 3.8 (2.1) 4.0 (2.7) 4.6 (2.9) 4.7 (3.2) KGR 4.0 (2.7) 4.2 (2.2) 3.4 (1.7) 4.3 (2.1) 4.2 (2.6)
SJMC 2.3 (1.2) 2.5 (1.3) 2.4 (1.3) 2.7 (1.6) 2.6 (1.6) TML 5.0 (2.8) 4.9 (2.8) 5.1 (3.0) 6.4 (3.5) 4.8 (2.6) KP 4.9 (2.4) 3.5 (2.0) 5.8 (3.1) 5.7 (3.0) 5.5 (2.9)
SMJ 5.3 (3.0) 4.4 (2.2) 3.7 (2.3) 3.9 (2.5) 3.6 (2.2) BP 4.3 (2.5) 4.8 (2.7) 4.3 (2.2) 5.7 (3.3) 4.5 (2.8) TW 4.2 (2.2) 4.1 (2.3) 3.5 (2.2) 3.5 (2.4) 3.8 (2.5)
MRI 6.2 (3.0) 5.4 (2.8) 4.4 (2.3) 5.2 (2.5) 4.5 (2.6) KLM 4.2 (2.6) 3.9 (2.3) 3.6 (2.0) 3.3 (1.9) 3.2 (1.7) SDG 4.3 (2.1) 4.3 (2.1) 4.8 (2.7) 4.8 (2.8) 4.4 (2.2)
SB - 5.3 (2.9) 4.7 (2.4) 5.1 (2.5) 5.4 (3.3)
DKS - 6.8 (3.2) 6.0 (3.1) 5.1 (3.1) 4.5 (2.5)
SI - 5.2 (2.3) 7.0 (3.7) 6.2 (3.3) 5.4 (2.7)
SBL - 5.7 (2.8) 6.0 (3.2) 5.7 (3.1) 5.5 (3.1)
AMP - 5.3 (2.9) 5.4 (3.2) 5.0 (2.9) 5.4 (2.9)
LIK - 2.4 (1.5) 2.5 (1.6) 3.5 (1.8) 3.5 (1.9)
UMMC - - - 7.2 (3.8) 5.6 (3.3)
LKW - - - 5.3 (2.0) 4.1 (2.0)
SGT - - - 4.5 (2.8) 3.3 (2.3)
TM - - - 3.5 (1.9) 3.8 (2.5)
KEM - - - 3.3 (2.6) 4.2 (2.8)
KLP - - - 1.3 (0.8) 2.9 (1.5)
LAB - - - 4.6 (2.2) 4.4 (1.9)
KEN - - - 6.5 (2.9) 5.1 (2.9)
BIN - - - 5.4 (2.8) 3.9 (2.1)
LD - - - 5.7 (2.7) 4.8 (2.7)
Total 4.4 (2.3) 4.7 (2.4) 4.7 (2.4) 4.8 (2.6) 4.7 (2.5)
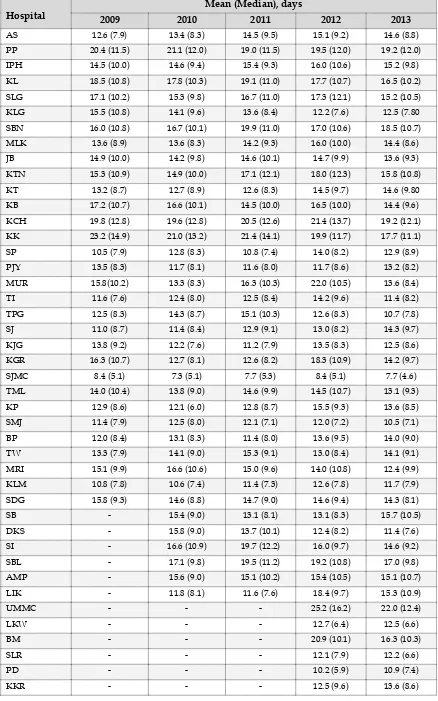
Table 9 :
Length of hospital stay, by individual hospital 2009
–
2013
Hospital
Mean (Median), days
2009 2010 2011 2012 2013
AS 12.6 (7.9) 13.4 (8.3) 14.5 (9.5) 15.1 (9.2) 14.6 (8.8)
PP 20.4 (11.5) 21.1 (12.0) 19.0 (11.5) 19.5 (12.0) 19.2 (12.0) IPH 14.5 (10.0) 14.6 (9.4) 15.4 (9.3) 16.0 (10.6) 15.2 (9.8) KL 18.5 (10.8) 17.8 (10.3) 19.1 (11.0) 17.7 (10.7) 16.5 (10.2) SLG 17.1 (10.2) 15.3 (9.8) 16.7 (11.0) 17.3 (12.1) 15.2 (10.5)
KLG 15.5 (10.8) 14.1 (9.6) 13.6 (8.4) 12.2 (7.6) 12.5 (7.80 SBN 16.0 (10.8) 16.7 (10.1) 19.9 (11.0) 17.0 (10.6) 18.5 (10.7) MLK 13.6 (8.9) 13.6 (8.3) 14.2 (9.3) 16.0 (10.0) 14.4 (8.6) JB 14.9 (10.0) 14.2 (9.8) 14.6 (10.1) 14.7 (9.9) 13.6 (9.3)
KTN 15.3 (10.9) 14.9 (10.0) 17.1 (12.1) 18.0 (12.3) 15.8 (10.8) KT 13.2 (8.7) 12.7 (8.9) 12.6 (8.3) 14.5 (9.7) 14.6 (9.80 KB 17.2 (10.7) 16.6 (10.1) 14.5 (10.0) 16.5 (10.0) 14.4 (9.6) KCH 19.8 (12.8) 19.6 (12.8) 20.5 (12.6) 21.4 (13.7) 19.2 (12.1)
KK 23.2 (14.9) 21.0 (13.2) 21.4 (14.1) 19.9 (11.7) 17.7 (11.1) SP 10.5 (7.9) 12.8 (8.3) 10.8 (7.4) 14.0 (8.2) 12.9 (8.9) PJY 13.5 (8.3) 11.7 (8.1) 11.6 (8.0) 11.7 (8.6) 13.2 (8.2)
MUR 15.8(10.2) 13.3 (8.3) 16.3 (10.3) 22.0 (10.5) 13.6 (8.4) TI 11.6 (7.6) 12.4 (8.0) 12.5 (8.4) 14.2 (9.6) 11.4 (8.2) TPG 12.5 (8.3) 14.3 (8.7) 15.1 (10.3) 12.6 (8.3) 10.7 (7.8) SJ 11.0 (8.7) 11.4 (8.4) 12.9 (9.1) 13.0 (8.2) 14.3 (9.7) KJG 13.8 (9.2) 12.2 (7.6) 11.2 (7.9) 13.5 (8.3) 12.5 (8.6)
KGR 16.3 (10.7) 12.7 (8.1) 12.6 (8.2) 18.3 (10.9) 14.2 (9.7) SJMC 8.4 (5.1) 7.3 (5.1) 7.7 (5.3) 8.4 (5.1) 7.7 (4.6) TML 14.0 (10.4) 13.8 (9.0) 14.6 (9.9) 14.5 (10.7) 13.1 (9.3)
KP 12.9 (8.6) 12.1 (6.0) 12.8 (8.7) 15.5 (9.3) 13.6 (8.5) SMJ 11.4 (7.9) 12.5 (8.0) 12.1 (7.1) 12.0 (7.2) 10.5 (7.1) BP 12.0 (8.4) 13.1 (8.3) 11.4 (8.0) 13.6 (9.5) 14.0 (9.0) TW 13.3 (7.9) 14.1 (9.0) 15.3 (9.1) 13.0 (8.4) 14.1 (9.1)
MRI 15.1 (9.9) 16.6 (10.6) 15.0 (9.6) 14.0 (10.8) 12.4 (9.9) KLM 10.8 (7.8) 10.6 (7.4) 11.4 (7.3) 12.6 (7.8) 11.7 (7.9) SDG 15.8 (9.3) 14.6 (8.8) 14.7 (9.0) 14.6 (9.4) 14.3 (8.1)
SB - 15.4 (9.0) 13.1 (8.1) 13.1 (8.3) 15.7 (10.5)
DKS - 15.8 (9.0) 13.7 (10.1) 12.4 (8.2) 11.4 (7.6)
SI - 16.6 (10.9) 19.7 (12.2) 16.0 (9.7) 14.6 (9.2)
SBL - 17.1 (9.8) 19.5 (11.2) 19.2 (10.8) 17.0 (9.8) AMP - 15.6 (9.0) 15.1 (10.2) 15.4 (10.5) 15.1 (10.7)
LIK - 11.8 (8.1) 11.6 (7.6) 18.4 (9.7) 15.3 (10.9)
UMMC - - - 25.2 (16.2) 22.0 (12.4)
LKW - - - 12.7 (6.4) 12.5 (6.6)
SGT - - - 14.8 (8.3) 10.4 (7.1)
TM - - - 12.0 (8.2) 9.1 (6.3)
KEM - - - 9.6 (7.8) 12.3 (8.0)
KLP - - - 6.3 (6.9) 11.4 (6.9)
LAB - - - 14.4 (6.4) 10.0 (4.3)
KEN - - - 19.2 (10.4) 15.0 (9.6)
BIN - - - 21.5 (12.6) 14.2 (10.3)
LD - - - 12.8 (7.7) 13.2 (8.3)
Total 14.4 (9.0) 14.6 (9.0) 14.9 (9.3) 15.5 (9.5) 14.4 (9.0)
Table 10 :
Referring units, by category of ICU 2013
Medicine 9445
48.3%
Neurosurgery 1972
10.1%
Plastic Surgery 120
0.6%
Ophthalmology 23
0.1%
Dental Surgery 93
0.5%
Cardiology 77
0.4%
Haematology 29
0.1%
Nephrology 239
1.2%
Neurology 117
Figure 5 :
Referring units, by category of ICU 2013
The percentage of patients admitted from the medical-based disciplines increased
from 29.5% in 2003 to 49.4% in 2013.
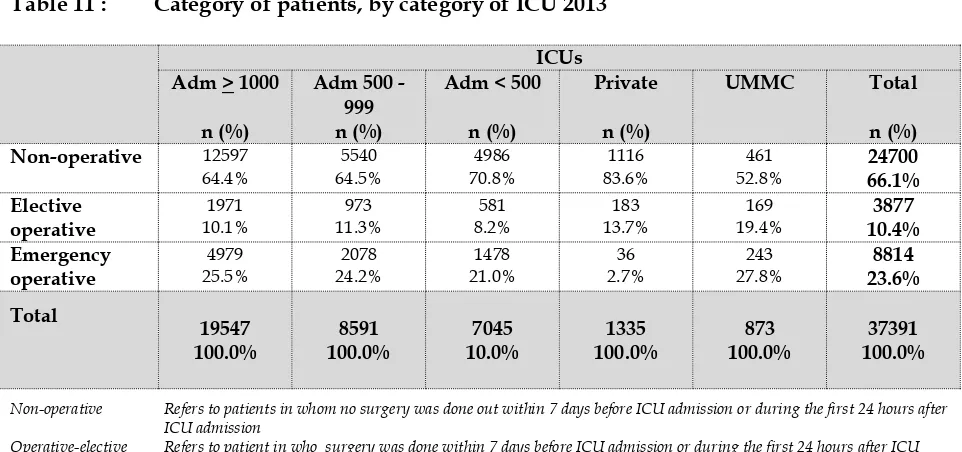
Table 11 :
Category of patients, by category of ICU
2013
ICUs
Non-operative 12597
64.4%
Non-operative Refers to patients in whom no surgery was done out within 7 days before ICU admission or during the first 24 hours after
ICU admission
Operative-elective Refers to patient in who surgery was done within 7 days before ICU admission or during the first 24 hours after ICU
admission on a scheduled basis
Operative-emergency
Figure 6 :
Category of patients, by category of ICU 2013
The categories of patients did not differ much among ICUs in MOH hospitals.
Non-operative admissions accounted for 66%, 53% and 84% of all admissions to MOH
ICUs, UMMC and private hospital respectively. The proportion of patients admitted
into ICU after elective operations was relatively higher in UMMC (19%) compared
with that of MOH hospitals (10%). Emergency operative patients admitted into the
private hospital ICU were relatively low compared with MOH hospitals and UMMC
.
Table 12 :
Category of patients in MOH hospitals 2009 - 2013
Category of patients 2009
(%)
2004 2005 2006 2007 2008 2009 2010 2011 2012 2013
Year
Table 13 :
Location before ICU admission, by category of ICU 2013
Other critical area 740
3.8%
Other location 146
0.7%
Other hospital 909
4.6%
Location before ICU admission: Refers to the area/location patient was being managed just before being admitted into ICU
Figure 8 :
Location before ICU admission, by category of ICU 2013
Table 14 :
Location before ICU admission in MOH hospitals 2009
–
2013
Location 2009
(%)
2010 (%)
2011 (%)
2012 (%)
2013 (%)
Ward 37.5 38.2 37.4 36.7 35.7
Operation theatre 31.5 29.0 29.3 26.6 26.4
Emergency department
20.5 23.9 24.0 27.9 29.7
Other critical areas 4.4 3.7 4.1 3.7 2.9
Other locations 0.7 0.9 0.5 0.7 0.6
Other hospitals 5.5 4.3 4.7 4.5 4.6
Figure 9 :
Location before ICU admission in MOH hospitals 2004
–
2013
0 5 10 15 20 25 30 35 40 45 50
2004 2005 2006 2007 2008 2009 2010 2011 2012 2013
Year
P
e
rc
e
n
ta
g
e
o
f
a
d
m
is
s
io
n
s
.
Ward
Operation theatre
Emergency department Other critical areas
Other locations
Other hospitals
Table 15 :
Main organ failure on ICU admission, by category of ICU 2013
Main organ failure
ICUs
The definition of organ failure is based on the Sequential Organ Failure Assessment (SOFA) [4]
Main organ failure: Refers to the main or most important organ failure within 24 hours of ICU admission and management.
.
Fig 10 :
Main organ failure on ICU admission, by category of ICU 2013
0
more than four-fifth (85.2%) were without any organ failure.
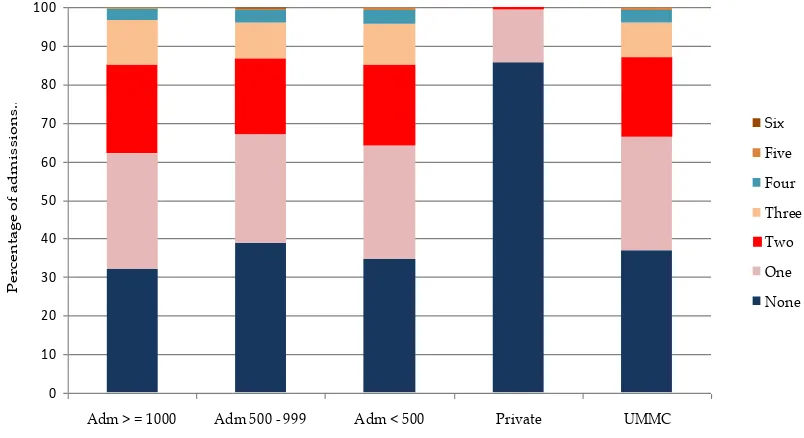
Table 16 :
Number of organ failure(s) on ICU admission,
by category of ICU
2013
Figure 11:
Number of organ failure(s) on ICU admission by hospitals 2013
0
Table 17 :
Ten most common diagnoses leading to ICU admission 2013
Diagnosis Number Percentage
Hospitals with admission > 1000
Sepsis 2000 10.2
Head Injury 1825 9.3
Dengue 967 4.9
Community acquired pneumonia 881 4.5
Non-cardiogenic pulmonary oedema 712 3.6
Cerebrovascular disease (infarct, thrombosis, haemorrhage) 639 3.3
Bronchial asthma 589 3.0
Chronic lower respiratory disease 586 3.0
Diabetic ketoacidosis / diabetic hyperosmolar hyperglycaemic state (HHS) 528 2.7
Infection/gangrene of limb (including osteomyelitis, necrotizing fasciitis) 476 2.4
Hospitals with admission 500 – 999
Head injury 550 6.4
Sepsis 541 6.3
Community acquired pneumonia 531 6.2
Dengue 302 3.5
Infection / gangrene of limb (including osteomyelitis, necrotizing fasciitis) 290 3.4
Cerebrovascular disease (infarct, thrombosis, haemorrhage) 265 3.1
Bronchial asthma 263 3.1
Chronic lower respiratory disease 256 3.0
Pregnancy-induced hypertension / Eclampsia 212 2.5
Meningitis / Encephalitis / Myelitis / Intracranial abscess / Spinal cord abscess
201 2.3
Hospitals with admission < 500
Sepsis 547 7.8
Community acquired pneumonia 468 6.6
Head injury 429 6.1
Chronic lower respiratory disease 337 4.8
Non-cardiogenic pulmonary oedema 253 3.6
Bronchial asthma Other adverse perioperative events 235 3.3
Dengue 232 3.3
Ischaemic heart disease / acute coronary syndrome 229 3.2
Infection / gangrene of limb (including osteomyelitis, necrotizing fasciitis) 215 3.0
Gastrointestinal perforation (including anastomotic leak) 167 2.4
Private Hospital
Dengue 138 10.3
Cerebrovascular disease (infarct, thrombosis, haemorrhage) 80 6.0
Gastrointestinal bleeding 79 5.9
Seizures ( primary, no structural brain disease) 70 5.2
Ischaemic heart disease / acute coronary syndrome 62 4.6
Other abdominal / pelvic conditions 53 4.0
Bronchial asthma 50 3.7
Other cardiovascular conditions 37 2.8
Other CNS conditions 36 2.7
UMMC
Sepsis 84 9.5
Diabetic ketoacidosis / diabetic hyperosmolar hyperglycaemic state (HHS) 32 3.6
Gastrointestinal malignancy 29 3.3
Gastrointestinal perforation (including anastomotic leak) 24 2.7
Dengue 23 2.6
Head injury 23 2.6
Bronchial asthma 22 2.5
Community acquired pneumonia 21 2.4
Congestive heart failure 21 2.4
ENT / oral conditions 20 2.3
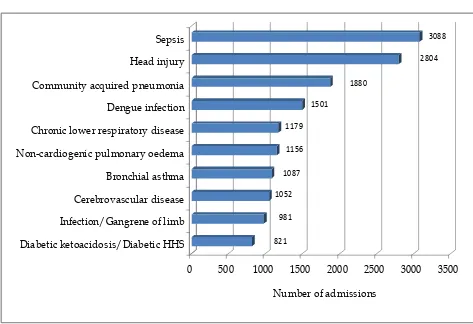
Figure 12 :
Ten most common diagnoses leading to ICU admission in MOH
Hospitals, 2013
821 981 1052 1087
1156 1179
1501
1880
2804 3088
0
500
1000
1500
2000
2500
3000
3500
Number of admissions
Diabetic ketoacidosis/Diabetic HHS
Infection/Gangrene of limb
Cerebrovascular disease
Bronchial asthma
Non-cardiogenic pulmonary oedema
Chronic lower respiratory disease
Dengue infection
Community acquired pneumonia
Head injury
Sepsis
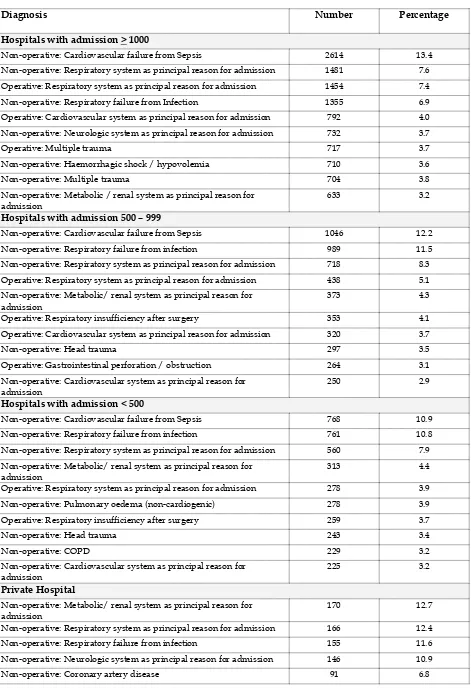
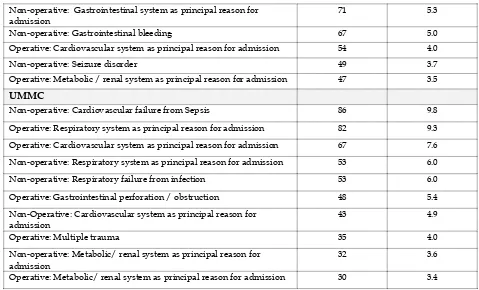
Table 18 :
Ten most common diagnoses leading to ICU admission using APACHE II
diagnostic category 2013
Diagnosis Number Percentage
Hospitals with admission > 1000
Non-operative: Cardiovascular failure from Sepsis 2614 13.4 Non-operative: Respiratory system as principal reason for admission 1481 7.6
Operative: Respiratory system as principal reason for admission 1454 7.4 Non-operative: Respiratory failure from Infection 1355 6.9 Operative: Cardiovascular system as principal reason for admission 792 4.0
Non-operative: Neurologic system as principal reason for admission 732 3.7
Operative: Multiple trauma 717 3.7
Non-operative: Haemorrhagic shock / hypovolemia 710 3.6
Non-operative: Multiple trauma 704 3.8
Non-operative: Metabolic / renal system as principal reason for admission
633 3.2
Hospitals with admission 500 – 999
Non-operative: Cardiovascular failure from Sepsis 1046 12.2
Non-operative: Respiratory failure from infection 989 11.5 Non-operative: Respiratory system as principal reason for admission 718 8.3 Operative: Respiratory system as principal reason for admission 438 5.1
Non-operative: Metabolic/ renal system as principal reason for admission
373 4.3
Operative: Respiratory insufficiency after surgery 353 4.1 Operative: Cardiovascular system as principal reason for admission 320 3.7
Non-operative: Head trauma 297 3.5
Operative: Gastrointestinal perforation / obstruction 264 3.1
Non-operative: Cardiovascular system as principal reason for admission
250 2.9
Hospitals with admission < 500
Non-operative: Cardiovascular failure from Sepsis 768 10.9 Non-operative: Respiratory failure from infection 761 10.8
Non-operative: Respiratory system as principal reason for admission 560 7.9 Non-operative: Metabolic/ renal system as principal reason for
admission
313 4.4
Operative: Respiratory system as principal reason for admission 278 3.9
Non-operative: Pulmonary oedema (non-cardiogenic) 278 3.9 Operative: Respiratory insufficiency after surgery 259 3.7
Non-operative: Head trauma 243 3.4
Non-operative: COPD 229 3.2
Non-operative: Cardiovascular system as principal reason for admission
225 3.2
Private Hospital
Non-operative: Metabolic/ renal system as principal reason for admission
170 12.7
Non-operative: Respiratory system as principal reason for admission 166 12.4 Non-operative: Respiratory failure from infection 155 11.6
Non-operative: Neurologic system as principal reason for admission 146 10.9
Non-operative: Gastrointestinal system as principal reason for admission
71 5.3
Non-operative: Gastrointestinal bleeding 67 5.0
Operative: Cardiovascular system as principal reason for admission 54 4.0
Non-operative: Seizure disorder 49 3.7
Operative: Metabolic / renal system as principal reason for admission 47 3.5
UMMC
Non-operative: Cardiovascular failure from Sepsis 86 9.8
Operative: Respiratory system as principal reason for admission 82 9.3
Operative: Cardiovascular system as principal reason for admission 67 7.6
Non-operative: Respiratory system as principal reason for admission 53 6.0
Non-operative: Respiratory failure from infection 53 6.0
Operative: Gastrointestinal perforation / obstruction 48 5.4
Non-Operative: Cardiovascular system as principal reason for admission
43 4.9
Operative: Multiple trauma 35 4.0
Non-operative: Metabolic/ renal system as principal reason for admission
32 3.6
Operative: Metabolic/ renal system as principal reason for admission 30 3.4
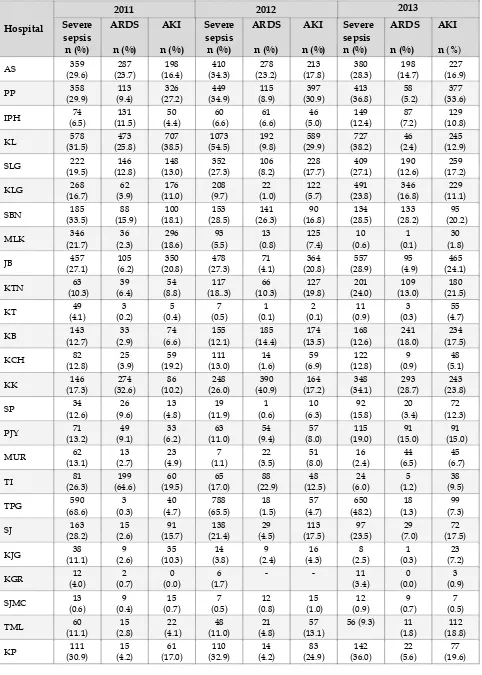
Table 19 :
Severe sepsis, ARDS and AKI within 24hrs of ICU admission 2013
ICUs
Adm ≥ 1000
n (%)
Adm 500 - 999 n (%)
Adm < 500
n (%)
Private
n (%)
UMMC
n (%)
Total
n (%)
Severe sepsis* 4473 (22.9) 1342 (15.6) 1119 (15.9) 12 (0.9) 225 (25.9) 7171 (19.2)
ARDS# 1668 (8.5) 759 (8.8) 504 (7.2) 9 (0.7) 99 (11.4) 3039 (8.1)
AKI^ 2913 (14.9) 1101 (12.8) 898 (12.8) 7 (0.5) 210 (24.1) 5129 (13.7)
* Sepsis refers to documented infection with 2 out of 4 SIRS criteria: 1) Temperature >38.3 or < than 36C
2) Total white cell count > 12000 or < 4000 3) Heart rate > 90/min
4) Respiration rate > 20 breath / minute or PaCO2 < 32mmHg Severe sepsis is sepsis with one of the following organ dysfunction:
(1) Hypotension: Systolic blood pressure < 90 mmHg or mean arterial pressure < 70 mm Hg (2) PaO2/FIO2 ≤ 300 mmHg
(3) Acute decrease in platelet count to < 100 000 u/L (4) Acute increase in total bilirubin to > 70 umol/L
(5) Acute increase in serum creatinine to >170umol/L or urine output < 0.5 mL/kg/hour for > 2 hours (6) Serum lactate >4 mmol/l
# ARDS refers to a severe form of acute lung injuryI with a PaO2/FIO2ratio ≤ 200 mm Hg with diffuse radiologic
infiltrates which is not predominantly due to heart failure
SMJ 4