Riphat, et al. Kajian Ekonomi dan Keuangan Vol. 20 No. 3 (Desember 2016)
Kajian Ekonomi dan Keuangan
http://fiskal.kemenkeu.go.id/ejournal
CAUSALITY ANALYSIS BETWEEN FINANCIAL
PERFORMANCE AND HUMAN DEVELOPMENT INDEX: A
CASE STUDY OF PROVINCES IN EASTERN INDONESIA
*
Analisis Kausalitas Antara Kinerja Keuangan dan Indeks
Pembangunan Manusia: Studi Kasus Provinsi di Kawasan
Timur Indonesia
Singgih Riphat
, Hadi Setiawan
α, dan Sofia Arie Damayanty
Abstract
This research aims to examine the causal relationship between the provincial financial performance and the Human Development Index (HDI). The results of this research are important since it can be used as a guidance to make a sound policy of local government’s revenue and budget allocation which can improve the welfare or quality of the society. The methodology of this paper is a quantitative approach by using the Granger causality test. Several provinces in Eastern Indonesia are used as the object of research since those areas are underdeveloped compared to western Indonesia. Several financial ratios are used as the proxies of local financial performance. The results show that most of the financial performances do not have a causal relationship with HDI, except for several proxies in some provinces.
Abstrak
Penelitian ini bertujuan untuk mengetahui hubungan kausalitas antara kinerja keuangan provinsi dan Indeks Pembangunan Manusia (IPM). Hasil penelitian ini penting karena dapat menjadi masukan bagi pemerintah provinsi dalam membuat kebijakan yang tepat terkait alokasi pendapatan dan belanja daerah, sehingga dapat meningkatkan kesejahteraan dan kualitas masyarakat. Metodologi yang digunakan dalam studi ini adalah metode kuantitatif dengan tes Granger causality. Beberapa provinsi di kawasan timur Indonesia digunakan sebagai objek penelitian karena pembangunan di daerah tersebut masih jauh tertinggal apabila dibandingkan dengan Indonesia bagian barat. Beberapa rasio keuangan digunakan sebagai proxy dari kinerja keuangan daerah. Hasil penelitian menunjukkan bahwa kinerja keuangan sebagian besar tidak memiliki hubungan sebab akibat dengan IPM kecuali untuk beberapa proxy di beberapa provinsi.
* This article is an enhancement and update of a paper presented at the IRSA 2013 entitled “Causality Analysis Between
Financial Performance and Human Development Index: Case Study on Province in Eastern Indonesia” presented by the Authors
α Email: [email protected]
Pusat Kebijakan Pendapatan Negara,
Badan Kebijakan Fiskal, Kementerian Keuangan.
Gedung RM. Notohamiprodjo Lt.5 Kementerian Keuangan
Key Words: Financial Performance, Human Development Index, Granger Causality Test,
Indonesia’s eastern Province
1. INTRODUCTION
Post-implementation of fiscal decentralization in 1999, the government makes continuous improvement in order to delegate budget and authority to local governments which can improve the quality of services to the society. Fiscal decentralization is an instrument which is used by the government, to manage development in order to stimulate the regional and national economy. Therefore, a good financial relationships mechanism between central and local governments is expected to facilitate the implementation of regional development and to reach the welfare of society.
One of government expenditure which needs to be observed is regional transfer.The numbers of this transfer are quite significant, as a consequence of delegation of the central government authority to the local governments, after the implementation of fiscal decentralization (money follow the function). Moreover, the amount of regional transfer has been rising, not only in nominal term but also in percentage of the total budget, as shown in Figure-1. For example, the regional transfers was budgeted at Rp723,2 trillion in APBN 2016 or reaching 36.8 percent of total government spending.
FIGURE-1: Regional Transfers on State Budget, 2011 -2016 (triliun Rp)
Source: Ministry of Finance
The authority which is given to the local governments to manage the regional transfer is expected to boost economic development and improve the quality of public services. The performance of local governments in managing finances is often measured through financial ratios and the quality of financial reports indicated by an unqualified opinion on the audit report.
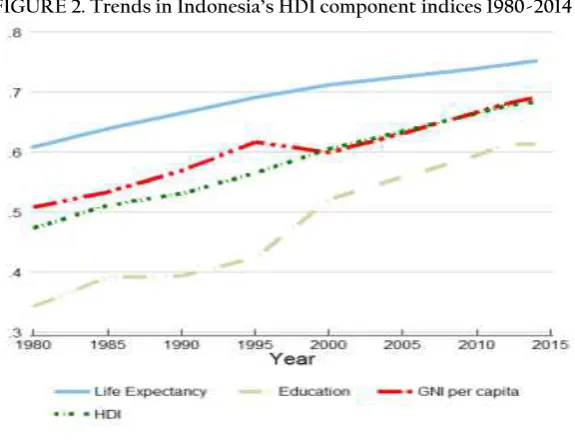
One of the indicators used to measure the welfare of society is the Human Development Index (HDI), which is a composite statistic of life expectancy, education, and income per capita indicators. Indonesian HDI continued to experience an increasing trend for all the components
as shown in Figure 2. Between 1980 and 2014, Indonesia’s HDI value increased from 47,4 to 68,4,
an increase of 44,3 percent or an average annual increase of approximately 1,08 percent. The 2014 HDI of 68,4 is above the average of 63,0 for countries in the medium human development group and below the average of 71,0 for countries in East Asia and Pacific (UNDP, 2015).
Since 2015, the government began to set HDI achievement as one of the development targets in the state budget (APBN), which amounted to 69.4 and 70.1 for the year 2015 and 2016, respectively. The other indicators that are also set as development targets are unemployment rate, poverty rate, and Gini ratio. These indicate that the government is improving the accountability of fiscal policy through qualified state budget allocation. By setting up
28%
LKPP 2011 LKPP 2012 LKPP 2013 APBNP 2014 APBNP 2015 APBN 2016
Kajian Ekonomi dan Keuangan Vol. 20 No.3 (Desember 2016) - 233
development outcome indicators astargets, the government improves the transparency of state financial management so that public can evaluate their performance.
FIGURE 2. Trends in Indonesia’s HDI component indices 1980-2014
Source: UNDP (2015)
Many studies have discussed the determinants of HDI as well as the relationship between HDI and economic performance. However, a study on the causal relationship between the financial performance of local government and HDI still rarely found. By knowing the relationship between financial performance and HDI, the government can make a proper policy in allocating local government revenue and spending, that can improve the welfare or quality of the society. Moreover, financial performance is one of the measurements that are widely used by the stakeholders of local government. For example, the government officials use the financial performance as one of their campaign tools, while the community uses financial performance to find out the accountability of their taxes. Furthermore, the business community uses it to determine the ability of local governments to provide services at a reasonable cost. Finally, the central government assumes this as important issue since it affects the sovereign debt ratings and the quality of life and health conditions, security and prosperity of the citizens (Honadle, Costa, & Cigler, 2004). Also, financial performance affects the local fiscal risks (Setiawan, 2013).
FIGURE-3. Human Development Index of selected Eastern Indonesia provinces compare to national average, 2009-2013
Source: Statistic Indonesia 58
60 62 64 66 68 70 72 74 76
2009 2010 2011 2012 2013
Nusa Tenggara Barat Nusa Tenggara Timur Maluku Maluku Utara
The authors select several provinces in Eastern Indonesia as a case study because a study of HDI in Eastern Indonesia is rarely discussed. In addition, development indicators - such as economic growth, progress of infrastructure, thelevel of education, the level of health, and the advancement of technology and information - at Eastern part of Indonesia is left behind, compared to Western Indonesia. Figure-3 shows that for the last 5 years (and years before that), HDI in these provinces below the national average.
In particular, this study aims to determine the causal relationship between financial performance and HDI in West Nusa Tenggara, East Nusa Tenggara, Maluku, North Maluku, Papua, and West Papua. Therefore this study is important, especially for the policy makers at the provincial and central government, in order to establish appropriate policies to improve the welfare of the community in Eastern Indonesia.
2. LITERATURE REVIEW
Several studies have discussed factors that influence HDI such as Pratowo (2012), Priyanto (2011), Mirza (2012), Badrudin & Khasanah (2011) and Rifai (2010). Pratowo (2012) shows that regional spending, Gini ratio, proportion of non-food spending, and dependency ratio significantly influence HDI in the Central Java Province. While according to Priyanto (2011), Banten HDI is influenced by economic development, government expenditure in education and health, GDRP per capita, head of the family who is educated at leastjunior high school level, and the number of resident sickness. In addition, Mirza (2012) concludes that poverty, economic development, and capital spending influence HDI in the Central Java. Moreover, Rifai (2010) also finds that the degree of decentralization significantly affects the HDI, based on his study of 38 districts in the East Java. However, a study conducted by Badrudin & Khasanah (2011) reveals that government spending on education, health and infrastructure do not have a significant effect on the HDI of Yogyakarta Province, empirically. It is also concluded by Rifai (2010) that revenue growth, expenditure growth, and harmony expenditure ratio do not significantly affect HDI.
In term of relationship between human development and economic performance, several studies argue that, empirically, there are significant relationships between human development and economic performance (Brata, 2002; Ranis, Stewart, & Ramirez, 2000). . Similarly, Makrifah (2010) and Honohan (2004) also find empirical evidence that financial performance significantly influences economic development.
Furthermore, a study on 20 cities/districts in one Province in East Indonesia, conducted by Gousario & Dharmastuti (2015), also find that only ratio of regional financial independence has a positive contribution and significant effect on HDI. While the ratio of the regional financial effectiveness, the ratio of regional financial efficiency, and the ratio of regional financial harmony expenditure has insignificant effect on HDI. On the other side, Pamungkas (2013) claims that HDI also affects the financial performance of districts in the Central Java, byusing data from 35 districts in the period of 2008-2010.
While Prasetyo (2015) also reveals that, empirically, there is a significant positive relationship between the financial performance and HDI in Banyuwangi, based on data in the period of 2004-2013. This study uses independence ratio, efficiency ratio, and effectivity ratio as the proxy of the financial performance.
Kajian Ekonomi dan Keuangan Vol. 20 No.3 (Desember 2016) - 235
3. METHODOLOGY
3.1. Data Collection Method
This study uses secondary data from 2004 to 2013 (10 years). Then, the data is calculated by Granger causality test by using Eviews software. The financial performance in this study using province financial ratios as the proxy (Halim, 2007). The financial ratios used are:
Independence Ratio =Local revenue realization (PAD)+DBHTotal revenue realization (1)
Independence ratio in Equation 1 describes the ability of province to produce revenue sourced from the potency of its region which is consists of local taxes, levies, and the dividend from local enterprises as well as revenue sharing from the central government which is Dana Bagi Hasil (DBH). It is added as the component of independence ratio because actually, it is one of the revenues derived from the local area.
The higher independence ratio indicates that the province is more self-sufficient and not dependent on external aid (central government transfer), vice versa. Moreover, higher independence ratio also indicates the increasing of community participation in the development of the province by paying taxes and levies.
Effectivity Ratio =Local revenue realization (PAD)Local revenue target (2)
Effectivity ratio illustrates the ability of the local government to realize revenue targets. If the realization is greater than 100% means that the local government succeeds to exceed the targets which is set together with the Parliament.
Capital spending to total spending ratio =realization of capital spendingrealization of total spending (3)
Capital spending to total spending ratio measures how much the government allocates its share of total expenditure for capital expenditure. Although there has been no literature about the ideal ratio, greater capital expenditure indicates that the government prioritizes the allocation of spending on infrastructure, which is expected to accelerate development and increase the social welfare.
Employees spending to total spending ratio =realization of employees spendingrealization of total spending (4)
Employee spending to total spending ratio measures how much local governments spend money to pay their civil servants. The standard size for this ratio does not exist, but if it is greater than 50%, it can be concluded that the focus of the province is still on employees spending compared to infrastructure or capital spending.
Employees spending to local revenue ratio =realization of employees spendingLocal revenue realization (PAD) (5)
The growth of PAD =(realization of PAD year t−realization of PAD year t−1)realization of PAD year t−1 (6)
The growth of PAD describes how much a local government can increase its PAD compare to the previous year. Positive and higher ratio compared to other regions indicates a better performance of the government in collecting revenue from local economic activities. label of the variable which is utilised on Eviews calculation are as in Table 1.
TABLE- 1. Label of variables in eviews
No Variable Proxy Label
1. Human Development Index HDI HDI
2. Independence ratio
4. Capital spending to total spending ratio CStoTS
5. Employees spending to total spending ratio EStoTS
6. Employees spending to local revenue ratio EStoPAD
7. The growth of PAD GROWTH
3.2. Analysis Method
To answer the purposes of this study, the authors use Granger Causality test. A regression analysis which has been widely used, is a one-way relationship between dependent variable (Y) with independent variable (X). Nevertheless, the Granger Causality test will reveals whether Y
affects X (YX) or X affects Y (XY), and how to explain it economically. This test could also
result in a reciprocal relationship or a one-way relationship or no relationship at all (Gujarati & Porter, 2009).
4. ANALYSIS
The results on Table 2 and Table 3 show most of the financial performances do not have a causal relationship with HDI. The significant relationship at lag 1 only occurs in 15 relationships from 72 relationships or only 20,8%, which are three relationships in East Nusa Tenggara, three relationships in Maluku, four relationships in North Maluku, two relationships in Papua and three relationships in West Papua.
The calculation at lag 2 shows that significant relationship only occurs in 11 relationships from 66 relationships or only 16,7%. One significant relationship occurred in West Nusa Tenggara, three relationships in East Nusa Tenggara, four relationships in North Maluku, two relationships in Papua, and one relationship in West Papua.
These results (Table 2 and Table 3), except for North Maluku, contrast to studies which are conducted by Makrifah (2010) and Mirza (2012) who argues that the capital expenditure (which is one of the proxies of financial performance) significantly affect the HDI in the East and Central Java. However, the results of this study are consistent with the results by Badrudin & Khasanah (2011) who claim that there is no significant effect on education, health, and infrastructure for human development. It also contrasts with the study by Gousario & Dharmastuti (2015) who argue that independence ratio positively and significantly contribute to HDI.
Kajian Ekonomi dan Keuangan Vol. 20 No.3 (Desember 2016) - 237
the study by Prasetyo (2015) which finds that financial performance has relationship with HDI in Banyuwangi and Pamungkas (2013) who finds that HDI affects financial performance in the Central Java.
TABLE-2. Results of Granger Causality test using lag 1
West NT East NT Maluku North Maluku Papua West Papua F-stat Prob F-stat Prob F-stat Prob F-stat Prob F-stat Prob F-stat Prob IR to HDI 1.231 0.309 0.038 0.852 0.018 0.898 0.288 0.611 0.068 0.803 1.159 0.323 HDI to IR 0.000 0.991 0.188 0.680 4.528 0.077* 7.901 0.031** 0.012 0.915 0.167 0.697 ER to HDI 0.845 0.393 0.077 0.790 0.370 0.565 4.937 0.068* 0.951 0.401 2.432 0.217 HDI to ER 2.715 0.151 0.676 0.442 4.678 0.074* 1.885 0.219 7.069 0.076* 0.698 0.465 CStoTS to HDI 0.736 0.424 0.267 0.624 1.302 0.297 3.951 0.094* 0.480 0.514 0.005 0.943 HDI to CStoTS 2.047 0.203 1.043 0.347 0.102 0.761 0.001 0.978 0.404 0.548 6.729 0.041** EStoTS to HDI 0.545 0.488 1.041 0.347 0.003 0.962 0.101 0.762 4.757 0.072* 5.632 0.055* HDI to EStoTS 0.841 0.395 0.005 0.946 0.125 0.736 0.654 0.450 0.841 0.394 2.500 0.165 EStoPAD to HDI 0.000 0.991 7.404 0.035** 0.001 0.976 0.022 0.887 0.528 0.495 1.112 0.340 HDI to EStoPAD 1.077 0.339 7.415 0.035** 9.304 0.023** 1.099 0.335 1.278 0.302 0.011 0.919 GROWTH to HDI 0.295 0.606 0.984 0.360 0.047 0.836 5.383 0.059* 0.548 0.487 13.071 0.036** HDI to GROWTH 1.261 0.304 7.007 0.038** 0.135 0.726 0.155 0.707 0.221 0.655 0.423 0.562
Notes:
1. Total observation are 10 from the year 2004 – 2013 2. Using lag 1
3. *,**,*** significant at α<0.10, α<0.05 and α< 0.01, respectively
4. Effectivity ratio of Papua only using 8 observation since the valid data is not available 5. Effectivity ratio of West Papua only using 7 observations since the valid data is not available. 6. EStoPAD of West Papua only using 9observations since 1 observation is out layer data. 7. The growth of West Papua only using 7 observations since valid data is not available.
These findings are very interesting, considering most of the previous studies revealed that there is a relationship between variables that were observed, particularly in Western Indonesia, except a study by Badrudin & Khasanah (2011) in Yogyakarta. Although it has been done up to lag-2 but it turns out that most of the variables do not have a significant relationship. This indicates that there is uniqueness in Eastern Indonesia, especially at the provincial level.
These findings consistent with the composition of HDI. Based on the composition of HDI which are (i) a long and healthy life, which is calculated by life expectancy at birth; (ii) education index which mean years of schooling and expected years of schooling; and (iii) a decent standard of living which is calculated by GNI per capita (Purchasing Power Parity US$), and also some of previous studies, it can be concluded that the determinants of HDI are health spending, education spending, levels of income, income distribution in society and economic growth. Financial performance mostly will not directly affect the HDI and vice versa in Eastern Provinces of Indonesia.
have significant influence in promoting economic development especially in Eastern Province of Indonesia.
TABLE-3. Results of Granger Causality test using lag 2
West NT East NT Maluku North Maluku Papua West Papua F-stat Prob F-stat Prob F-stat Prob F-stat Prob F-stat Prob F-stat Prob IR to HDI 0.631 0.590 0.022 0.978 0.462 0.668 1.663 0.327 0.057 0.945 2.111 0.268 HDI to IR 2.713 0.212 8.794 0.056* 1.128 0.431 2.386 0.240 0.267 0.782 0.198 0.830 ER to HDI 0.448 0.676 0.841 0.513 0.130 0.883 3.191 0.181 -- -- -- -- HDI to ER 0.206 0.824 0.016 0.984 4.447 0.127 0.224 0.812 -- -- -- -- CStoTS to HDI 0.144 0.871 0.218 0.816 1.616 0.334 15.368 0.027** 0.189 0.837 3.437 0.168 HDI to CStoTS 11.460 0.039** 0.528 0.636 1.471 0.359 0.207 0.824 0.675 0.573 2.430 0.236 EStoTS to HDI 0.066 0.938 0.855 0.508 0.306 0.757 0.042 0.959 1.862 0.298 5.851 0.092* HDI to EStoTS 0.141 0.874 13.785 0.031** 0.380 0.712 14.454 0.029** 10.965 0.042** 0.314 0.751 EStoPAD to HDI 0.095 0.912 2.499 0.230 0.168 0.853 5.677 0.096* 2.874 0.201 1.295 0.436 HDI to EStoPAD 1.333 0.385 2.048 0.275 2.795 0.206 0.842 0.512 9.023 0.054* 0.148 0.871 GROWTH to HDI 1.946 0.287 12.756 0.034** 0.176 0.846 13.516 0.032** 2.216 0.257 -- -- HDI to GROWTH 0.617 0.596 3.469 0.166 1.548 0.345 0.565 0.619 1.684 0.323 -- --
Notes:
1. Total observation are 10 from the year 2004 – 2013 2. Using lag 2
3. *,**,*** significant at α< 0.10, α< 0.05 and α< 0.01, respectively
4. Effectivity ratio of Papua only using 8 observation since the author can not get the valid data 5. Effectivity ratio of West Papua only using 7 observation since the author can not get the valid data. 6. EStoPAD of West Papua only using 9 observations since 1 observation is out layer data.
7. The growth of West Papua only using 7 observation since the author can not get the valid data.
5. CONCLUSIONS AND RECOMMENDATIONS
This study analyzes the causal relationship between the financial performance of local government and HDI as an indicator of the welfare of society in the Eastern Indonesia. The financial performance using financial ratios as the proxies, are independence ratio, effectivity ratio, capital spending to total spending ratio, employees spending to total spending ratio, employees spending to PAD ratio, and the growth of PAD. The sample of regions chosen are West Nusa Tenggara, East Nusa Tenggara, Maluku, North Maluku, Papua, and West Papua in the period of 2004-2013.
Kajian Ekonomi dan Keuangan Vol. 20 No.3 (Desember 2016) - 239
that can be achieved through increasing the level of public education, the level of public health, job creation, and infrastructure development especially in supporting education, health, and investment.
In addition, it needs a thorough evaluation of the effectiveness of the financial performance, including its distribution and accuracy of the target which must be adapted to the character of the area in eastern Indonesia. A more comprehensive research is needed to prove it.
6. REFERENCES
Andaiyani. (2012). Pengaruh Indeks Pembangunan Manusia, Pertumbuhan Ekonomi, dan Belanja Operasional Terhadap Jumlah Alokasi Belanja Modal Pada Pemerintah Kabupaten/Kota di Provinsi Kalimantan Barat. Universitas Tanjung Pura.
Badrudin, R., & Khasanah, M. (2011). Pengaruh Pendapatan dan Belanja Daerah Terhadap Pembangunan Manusia di Provinsi Daerah Istimewa Yogyakarta. Jurnal Manajemen,
Akuntansi, Dan Ekonomi Pembangunan, 9(1), 23–30.
Brata, A. G. (2002). Pembangunan Manusia dan Kinerja Ekonomi Regional di Indonesia. Jurnal
Ekonomi Pembangunan, 7(2), 113–122.
Gousario, F., & Dharmastuti, C. F. (2015). Regional Financial Performance And Human Development Index Based On Study In 20 Counties / Cities of Level I Region. Journal The
WINNERS, 16(2), 152–165.
Gujarati, D. N., & Porter, D. C. (2009). Basic Econometrics (Fifth Edit). New York: McGraw-Hill Irwin.
Halim, A. (2007). Akuntansi Keuangan Daerah. Jakarta: Salemba Empat.
Honadle, B. W., Costa, J. M., & Cigler, B. A. (2004). Fiscal Health For Local Government. California: Elsevier Academic Press.
Honohan, P. (2004). Financial Development, Growth and Poverty: How Close Are The Links? World Bank Policy Research Working Paper (Vol. 3203). Retrieved from http://econ.worldbank.org.
Makrifah, S. A. (2010). Analisis Pengelolaan Keuangan Daerah Dan Dampaknya Terhadap Pembangunan Ekonomi Provinsi Jawa Timur. IPB.
Mirza, D. S. (2012). Pengaruh Kemiskinan, Pertumbuhan Ekonomi, dan Belanja Modal Terhadap Indeks Pembangunan Manusia di Jawa Tengah Tahun 2006-2009. Economics Development Analysis Journal, 1(1).
Pamungkas, B. (2013). Analisis Pengaruh Indeks Pembangunan Manusia, Karakteristik Pemerintah daerah dan Hadil Audit BPK Terhadap Kinerja Keuangan Pemerintah Daerah. Universitas Sebelas Maret.
Prasetyo, W. E. (2015). Hubungan Kinerja Pengelolaan Keuangan Daerah Terhadap Tingkat Kesejahteraan Masyarakat Kabupaten Banyuwangi. Universitas Jember.
Pratowo, N. I. (2012). Analisis Faktor-Faktor Yang Berpengaruh Terhadap Indeks Pembangunan
Manusia. Jurnal Studi Pembangunan Indonesia, 1(1), 15–31.
Priyanto, A. (2011). Analisis Faktor-Faktor Yang Mempengaruhi Pembangunan Sumber Daya Manusia di Provinsi Banten. IPB.
Ranis, G., Stewart, F., & Ramirez, A. (2000). Economic Growth and Human Development.
World Development, 28(2), 197–219. http://doi.org/10.1016/S0305-750X(99)00131-X
Setiawan, H. (2013). Kinerja Keuangan Daerah Pada Era Otonomi. In F. R. Saragih (Ed.), Risiko Fiskal Daerah. Jakarta: Era Adicitra Intermedia.