Role of Dividend of Power to Buy Shares in Companies in Indonesia Stock Exchange
Iskandar Muda
Faculty Economics and Business, University of Sumatera Utara (USU), Jl. Prof. TM Hanafiah No.12 USU Campus, Medan, North Sumatera, Indonesia, E-mail: [email protected]
Abstract This study aims to determine the role of the Purchasing Power Shares on manufacturing companies in Indonesia Stock Exchange Period 2014-2015. The variables used in this study as an Independent Variable Dividend and Purchasing Power Shares as Dependent Variables. Power Buy Stocks in this study was measured by the volume of stock sales every year. This research was conducted in Manufacturing company listed on the Indonesia Stock Exchange. The population of this study were 144 companies with purposive sampling as many as 19 of the Company's Manufacturing Company listed on the Indonesia Stock Exchange with the study of the 2014-2015 period in order to obtain 38 units of analysis. Data of this research are secondary data from the financial statements of 19 companies published in the Indonesia Stock Exchange. This research data processing method using the Test Statistics Deskribtif, Classical Assumption Test, Test Linear Regression using SPSS. The results of this study demonstrate that the role of the Dividend has significant influence on the Purchasing Power Shares in Manufacturing Company in Indonesia Stock Exchange (BEI).
Key words Dividend, stock purchasing power, purchasing power shares
JEL Codes: D53
1. Introduction
Along with the growth in the Indonesian economy, business conditions in Indonesia began in interest particularly in the field of investment. It makes a lot of investors want to invest in the form of shares in the company to obtain a return/gains on investments. However, fluctuations in stock prices and the risk of making investors think twice to buy shares. In a simple variability depending on how the stock price and dividend earnings that occur in a company. (Bradley et al., 1984; Fuller and Farrell; 1987; Ferreira, 2004; D’Mello, 2008; Bigelli, 2012). According to the Indonesian Institute of Accountants (2009) in the Statement of Financial Accounting Standards (SFAS) No. 23, paragraph 4, "Dividends are distributions of profits to holders of equity investments in accordance with their proportion of certain types of capital".
Dividend policy is very important because it affects the investment opportunities of the company, the stock price, financial structure, the flow of funding and liquidity position. (Nurmala: 2009). The purpose of this study was to determine the role of dividends in affecting the purchasing power of partial shares. This study is in line with research Nurmala (2009) showed that the Dividend Policy effect on stock price Automotive Enterprises in the Indonesia Stock Exchange. To achieve this goal the company set a dividend policy that the policy made by the company to establish revenue proportion distributed as dividends paid, shall mean the fewer profits to be arrested and as a result is to inhibit the growth rate of earnings and share price (Nurmala, 2009; Sharma, 2002). Benefit of this study, for science is expected to complement the existing empirical findings in the field of accounting for the progress and development. For the academic field, research is expected to contribute as library materials, especially in the areas of financial management, and can theoretical to empirical study. For company management, research is expected to provide information that can be used to mepertimbakan dividends in affecting the purchasing power of the shares. To increase knowledge and insight into the role of the writer in particular affects the purchasing power of dividends in stock. For further research, the results obtained in this research, reference materials and reference materials development in conducting empirical research.
2.Literature review
2.1. Capital market
In Indonesia there are four understanding of the capital market, namely:
a. According to the law No. 15 in 1952, is a stock is trading exchanges in Indonesia which was established to trade money and securities, including all securities auctions.
b. According to Presidential Decree No. 60 1988, that the capital market is a stock that is a means to bring together the requesting bidders and long-term funds, as stipulated in Law No. 15 of 1952 on the exchange.
d. According to Law No. 8 of 1995 on the capital market stating that capital markets are the activities concerned with the public offering and trading of securities, public companies relating to securities issuance, as well as institutions and professions related to the effect.
While the definition of a stock exchange is a party that organizes and provides a system and or the means to bring deals for buying and selling securities other parties with the aim memeperdagangkan effects between them. Organizers stock exchanges is a company that has a license from Bapepam. Permission from Bapepam is an absolute must for trading held by the stock exchange regarding the public funds invested in securities.
2.2. Stock
Shares are proof of participation capital ownership/and in a company or a paper that is clearly stated nominal value, followed by the name of the company and the rights and obligations described to each holder (Fahmi; 2013). Meanwhile, according to Siegel and Shim (1999), shares are inventories that are ready for sale.
2.3. Power buy stocks
Stock purchasing power is the ability of investors in buying shares.
2.4. Dividend
Dividend income is distributed to shareholders pro rata basis according to the class or group of securities (Sugiarto, 2009).
2.5. Conceptual framework
Figure 1. Conceptual Framework
3. Methodology of research
This type of research carried out in this research is classified as causal research, the research used to compare between two or more groups of a particular variable. This study was performed on companies listed in Indonesia Stock Exchange in the period 2015-2016. The population of this study by the company. Criteria for selection of sample is purposive sampling, with the following criteria:
1. Represents companies listed in Indonesia Stock Exchange throughout the year of observation.
2. Publish financial statements and financial variables that are equipped with the variables contained in the research that will be observed during the observation.
Based on these criteria obtained a sample of 19 out of a total of 144 manufacturing companies. Research over the past two years with a total of 38 observations. The method of analysis in this research using descriptive statistics.
Data analysis methods used include Descriptive Statistics. Descriptive statistics is the transformation of research data in tabular form, so easily understood and interpreted (Erlina, 2011). Descriptive statistics are generally used to provide information about the main study variables. Size used berupafrekuensi, the central tendency (mean, median, mode) dispersion (standard deviation, variance) and gauges form (measures of shape) (Erlina, 2011).
Normality test is useful for the early stages in pemelihan methods of data analysis. If the normal data, using statistical parametric, and if not normal, use nonparametric statistics or treatment so that normal data (Erlina, 2011). Objective data normality test is to test whether the dependent variable and independent variables have a normal distribution or not. Normal data will form a straight diagonal line and plotting data will be compared with diagonal lines. If the data distribution is normal, then the line that represents the actual data will follow a diagonal line. The process of data normality test is done by using the Kolmogorov-Smirnov test. Distribution data can be visualized with the following criteria:
a. Significant figures> significance level (α) of 0.05, the distribution of data is said to be normal. b. Significant figures <significance level (α) of 0.05, the distribution data is said to be normal.
Testing is by looking at the value of Variance Inflation Factor (VIF) and the value of Tolerance. Told not happen multikolinearitas if VIF <10 and Tolerance Values> 0.1 (Ghozali, 2013).
Autocorrelation test was used to test whether a linear regression model was no correlation between bullies mistakes in period t with bullies error in period t-1 (previous). This test is a test used Durbin-Watson (D-W), that did not happen either positive or negative autocorrelation when du <d <4-du (Ghozali, 2013).
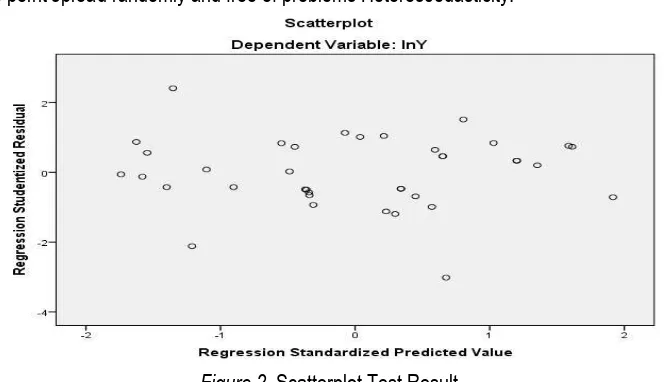
Heteroscedasticity test is a test of whether a regression model occurred inequality residual variance from one observation to another observation. Heteroskedastisitas test to be performed in this study using a scatterplot graph. If the points spread above and below the number 0 on the Y axis then there is no heteroscedasticity (Ghozali, 2013).
Regression model to be tested are as follows:
Y = α + βX + e (1)
Where:
Y = Purchasing Power Shares; α = Constant; β = Regression coefficient; X = Dividend; e = Error Term, which is the level Error estimators in Research.
4. Data analysis
4.1. Descriptive research samples
This study used a population of about 144 company listed on the Indonesia Stock Exchange (BEI), and after the sample selection criteria specified then chosen as samples are as many as 19 companies manufacturing in meticulously for 2 years ie 2014-2015. The research sample was obtained by purposive sampling.
4.2. Analysis descriptive statistics
The following is a general statistical data from all data used:
Table 1. Descriptive statistics
N Minimum Maximum Mean Std. Deviation X 38 102079 143095678 14861326.08 28531064.582 Y 38 18020 188531611 27156542.45 50415127.778 Valid N (listwise) 38
Source: Data processed (2017)
Descriptive statistics were used to analyze the data in ways that describe or depict the data that has been collected as it is without intending to generally accepted conclusions or generalizations, the obtained descriptive research data on the above. Table 1 explained that the dividend as an independent variable (X) on companies listed on the Stock Exchange in 2014-2015, a minimum value of 102 079 and a maximum value of 143 095 678 with an average 14,861,326.08. With an average of 14,861,326.08 then, the standard deviation is 28,531,064.582 and the amount of research as many as 38. Power Buy Stocks as the dependent variable (Y) in companies listed on the Stock Exchange in 2014-2015, a minimum value of 18 020 and a maximum value of 188 531 611 with an average 27,156,542.45. With an average of 27,156,542.45 then, the standard deviation is 50,415,127.778 and the amount of research as many as 38.
4.3. Classic assumption testing
4.3.1. Normality test
Researchers used the normality test only to determine the distribution of the data used is normal or not. To test the research normality using one sample Kolmogorov Smirnov test. When researchers tested directly significant value of 0.003 Thus it can be concluded that the residuals are not normally distributed, or in other words the residual variable distribution is not normal, so do the corrective action is to do exactly the transformation of the variables of research into function Logaritma Natural (LN) . The test result data is regenerate:
Table 2. One-Sample Kolmogorov Smirnov Test
Unstandardized Residual
N 38
Normal Parametersa,b Mean 0E-7
Std. Deviation 1.61001584
Most Extreme Differences
Absolute .089
Positive .080
Negative -.089
Kolmogorov-Smirnov Z .548
Asymp. Sig. (2-tailed) .925
a. Test distribution is Normal. b. Calculated from data. Source: Data processed (2017)
Figure 1. The Histogram and Scatterplot Graph the data with the results Normal distribution
4.3.2. Multicollinearity test
Table 3. Multicolinearity Test Result
Coefficientsa
Model Collinearity Statistics
Tolerance VIF
1 lnX 1.000 1.000
a. Dependent Variable: lnY Source: Data processed (2017)
Tolerance value for the variable dividend is equal to 1.000> 0.1. The above table shows that the variable dividend as independent variables tested free of multicollinearity. VIF value of variavel dividend of 1,000<10, that VIF result no more than 10 then tested free of multicollinearity.
4.3.3. Autocorrelation test
In this study, autocorrelation test conducted by the Durbin Watson test, because this test is commonly used. This test is used only for first-degree autocorrelation (first order autocorrelation) and requires the intercept (constant) in the regression model, decision making whether there is autocorrelation is as follows (table 4).
Table 4. Autocorrelation Test Results
Model Summaryb
Model R R Square Adjusted R Square Std. Error of the Estimate
Durbin-Watson
1 .725a .525 .512 1.63222 2.044
a. Predictors: (Constant), lnX b. Dependent Variable: lnY Source: Data processed (2017)
4.3.4. Heteroscedasticity test
The results show the point spread randomly and free of problems Heteroscedasticity:
Figure 2. Scatterplot Test Result
4.4. Hypothesis testing results
4.4.1. Test coefficient of determination
Value Coefficient of Determination (R) aims to measure how far the ability of the model to explain variations in the dependent variable. The coefficient of determination is the partial effect Dividends on Purchasing Power Shares. So to see how far the ability of the variables in explaining the variable dividend Purchasing Power Shares can be seen through the value of R Square obtained from the processing of data in Table 5.
Table 5. Test Coefficient of Determination
Model R R Square Adjusted R Square Std. Error of the Estimate Durbin-Watson
1 .725a .525 .512 1.63222 2.044
a. Predictors: (Constant), lnX b. Dependent Variable: lnY Source: Data processed (2017)
R Square result in the table above amounted to 0.512 means approaching one means of independent variables provide almost all the information needed to predict the variation of the dependent variable. It shows that 51.2% of variable Purchasing Power Shares can be explained by the variable dividend. The remaining 48.8% is influenced by other variables that are not explained by this research model. To test the level of confidence in the results of hypothesis, then performed
the test variables simultaneously (F) and partially (t) with a confidence level of 5% (α = 0.05).
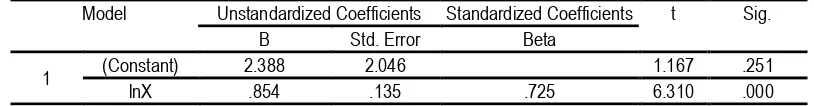
4.4.2. t Test results statistics
Table 6. t Test Results
Model Unstandardized Coefficients Standardized Coefficients t Sig.
B Std. Error Beta
1 (Constant) 2.388 2.046 1.167 .251
lnX .854 .135 .725 6.310 .000
a. Dependent Variable: lnY Source: Data processed (2017)
Based on the above table, the partial influence of independent variables on the dependent variable can be described as follows : Dividend Variable (6.310>2.028) partially affect the Purchasing Power Shares in Manufacturing Company in Indonesia Stock Exchange from 2014 to 2015, where the value t count> ttable thus H0 rejected H1 accepted. From Table 6, linier regression equation can be structured as follows:
Y = 2,388 + 0,854X + e (2)
The model above is the result of multiple regression equation. A constant value of 2.388 means that if a variable dividend equal to zero, then the Purchasing Power Shares remained at 2,388. Dividend Variable positive influence on Purchasing Power shares with coefficient 0,854 Rupiah means that each increment 1 it will raise the dividend Purchasing Power Shares 0,854 point.
5. Results
From the testing that has been done it is concluded that the partial positive effect on the Dividend Purchasing Power Shares Manufacturing Company in Indonesia Stock Exchange. The positive effects can be seen by comparing the value tcount> ttable. Values obtained (6.310> 2.028) so it can be concluded that the role of dividends in affecting the Purchasing Power Shares at Manufacturing Company in Indonesia Stock Exchange accepted. At the 95% confidence level it is supported from Adjusted R Square value of 0.525, which means that the independent variables can explain the dependent variable sebasar 52.5%. Mean while the remaining 47.5% is explained by other variables not examined by the study. It is able to show that a dividend companies listed in the Stock Exchange Indonesia may play a role in influencing the Purchasing Power shares which shares in the purchasing power of rigorous sales volume of shares in a manufacturing company in the year 2014-2015. This research is in line with research Mersela (2016) with the title of the study the effect of profitability and solvency of the policy cash dividends told me that there is a positive and significant impact the profitability of the policy cash dividend, there is negative and significant impact the solvency of the policy cash dividend, a significant influence profitability and solvency of the cash dividend policy. Dividend is the net profit obtained by the company, therefore, the dividend will be distributed when the company earned a profit (Baridwan, 2010). Decent profits distributed to shareholders is profit after the company meet its fixed obligations ie interest and taxes (Dimitrov, 2008 and Khodaparasti, 2014). The result also agrees with the opinion (Lutfi, 2016) that the main attraction for company owners (shareholders) and prospective investors in a company is profitability. In this context profitability means that the results obtained through the efforts of the management of the funds invested owners and investors. The greater the tingkatlaba or profitability of the acquired company will result in greater dividends to be declared and vice versa.
6. Conclusion and recommendations
6.1.Conclusion
The results of this research provide conclusions about the effect Role in Determining Buy Dividend Stocks. Dividend Variable affect to the Purchasing Power Shares in Manufacturing Company in Indonesia Stock Exchange.
6.2.Recommendations
Based on the conclusions and limitations of the study noted earlier, some suggestions from this research are as follows: a. For subsequent researchers in the future in order to expand or increase the study sample as from outside the company manufacturing or adding dependent and independent variables and/or increase the period of observation.
Acknowledgement
Thanks to the Ministry of Research and Technology of the Republic of Indonesia that has funded this research, therefore this research have broad impact on the economy and welfare of the people of Indonesia.
References
Baridwan, Z. (2010). IntermediateAccounting.BPFE, 8th edition. Yogyakarta.
Bigelli, M., Sánchez-Vidal, J. (2012). Cash holdings in private firms. Journal of Banking and Finance, 36(1), 26-35.
Bradley, M., Jarrel, A.G., Kim, E.H. (1984). On the existence of an optimal capital structure: Theory and evidence, Journal of Finance, 39(3), 857-878.
Dimitrov, V., Jain, P. (2008). The value-relevance of changes in financial leverage beyond growth in assets and GAAP earnings. Journal of Accounting, Auditing and Finance, 23(2). 191-222.
D’Mello, R., Krishnaswami, S., Larkin, P. (2008), Determinants of corporate cash holdings: Evidence from spin-offs. Journal of Banking and Finance, 32(7). 1209-1220.
Ferreira, M.A., Vilela, A.S. (2004). Why do firms hold cash? Evidence from EMU countries. European Financial Management, 10(2). 295-319.
Fahmi, I. (2013). Financial Management, Alfabeta Publishers, Bandung.
Fama, E. (1981). Stock returns, real activity, inflation, and money. The America Economic Review 71, 545-565. Fuller, R..J and Farrell J. L. Jr. (1987). Modern Investment and Security Analysis, McGraw Hill.
Ghozali, I. (2013). Applications Multivariate Analysis with SPSS Program, Diponegoro Publishing’s, Semarang. Indonesian Institute of Accountants (2009). The Financial Accounting Standards, Salemba Empat Publishers, Jakarta.
Khodaparasti, R. (2014). The role of macroeconomic variables in the stock market in Iran. Polish Journal of Management Studies, 10(2), 54-64.
Kumar, R. (2013). The effect of mocroeconomic factor on Indian stock market performance: A factor analysis approach. IOSR Journal of Economics and Finance (IOSR-JER), 1(4).14-21.
Lutfi, M., Nazwar, C., and Muda, I. (2016). Effects of investment opportunity set, company size and real activity manipulation of issuers in Indonesia Stock Exchange on stock price in Indonesia. International Journal of Economic Research 13(5), 2149-2161.
Marsela (2016). Effect of Profitability and Solvency Against Cash Dividend Policy, University of Lampung.
Nurmala (2009). Effect of Dividend Policy On Stock Price Automotive Enterprises in the Jakarta Stock Exchange. Independent 9(1), 34-47.
Sharma, S.C., Wongbangpo, P. (2002). Long-term trends and cycles in ASEAN stock markets, Review of Financial Economics 11(4), 299-315.
Sugiarto (2009). Capital Structure, Corporate Ownership Structure, Agency Problems and information asymmetry, Graha Science. Yogyakarta.
Talla, J.T. (2013). Impact of Macroeconomic Variable on the Stock Market Prices of the Stockholm Stock Exchange (OMXS30).
Master’s Thesis of Jonkoping University, 1-48.