ACOUSTICCLASSIFICATION OF FRESHWATER FISH SPECIES USING
ARTIFICIAL NEURAL NETWORK: EVALUATION OF THE MODEL
PERFORMANCE
Zulkarnaen Fahmi1) and Wijopriono2)
1Researcher at Research Institute for Fisheries Enchancement and Conservation, Purwakarta 2Researcher at Research Centre for Fisheries Management and Conservation, Jakarta
Received May 07-2012; Received in revised form March 19-2013; Accepted May 14-2013
Email: [email protected]
ABSTRACT:
Hydroacoustic techniques are a valuable tool for the stock assessments of many fish species. Nonetheless, such techniques are limited by problems of species identification. Several methods and techniques have been used in addressing the problem of acoustic identification species and one of them is Artificial Neural Networks (ANNs). In this paper, Back propagation (BP) and Multi Layer Perceptron (MLP) of the Artificial Neural Network were used to classify carp (Cyprinus carpio), tilapia (Oreochromis niloticus), and catfish (Pangasius hypothalmus). Classification was done using a set of descriptors extracted from the acoustic data records, i.e. Volume Back scattering (Sv), Target Strength (TS), Area Back scattering Strength, Skewness, Kurtosis, Depth, Height and Relative altitude. The results showed that the Multi Layer Perceptron approach performed better than the Back propagation. The classification rates was 85.7% with the multi layer perceptron (MLP) compared to 84.8% with back propagation (BP) ANN.
KEYWORDS: Identification, classification, acoustic descriptors, artificial neural network.
INTRODUCTION
Direct species identification is a great challenge in fisheries acoustics. However, species identification has been limited by the difficulty in objectively classifying back scattered energy of echo traces into fish species. It was recognized that working on it is
time-consuming and depends on the experience of the operator, incorporating some level of uncertainty or ambiguity. Incorrect species classification and identification can limit the usefulness of acoustic abundance estimates.
Many studies have attempted to develop echo-trace classification. First attempts at fish classification introduced basically subjective and time-consuming methods. These methods involved expert scrutiny of echograms combined with concurrent trawling data. Visual scrutiny of acoustic data depends on human experience and is therefore subject to biases and difficult to be quantified (Charef et al., 2010).
New studies have continually been done and efforts have been devoted to find out methods and techniques for species identification. Recently, Artificial Neural Networks (ANNs) have become the focus of much attention, largely because of these methods are more efficient, timely less or not dependent on subjective interpretation, and controlled by evaluating their accuracy (Jech & Michaels, 2006), besides their wide range of applicability and the case which they can
treat complicated problems. An ANN is a ‘black box’ approach which has great capacity in predictive modelling, i.e. all the characters describing the unknown situation must be presented to the trained ANN, and the identification (prediction) is then given. Artificial neural networks (ANNs) are non-linear mapping structures based on the function of the human brain.
Muhiddin (2007) applied back propagation of the ANNs to classify sardine in the South China Sea, with a set of acoustic descriptors as input parameters. The classification provided level of accura cyat the rates of 70%-100%. Charef et al. (2010) used Multi Layer Perceptron (MLP) of ANNs to identify fish shoals in the South China Sea, showing a performance of classification rates at 87.6 %. The discrimination study was done by Robotham et al. (2010) to evaluate performance of Probabilistic Neural Network (PNN) and Support Vector Machine (SVM) against Multi Layer Perceptron (MLP). The study produced the classification rates of 89.5% against 79.4%.
two models, based on a set of acoustic descriptors to classify three species of freshwater fish, i.e. Tilapia (Oreochromis niloticus), Catfish (Pangasius hypothalmus) and Carp (Cyprinus carpio), which are all important targets for the freshwater fisheries industry.
MATERIALS AND METHODS
Data Collection
Acoustic data were collected in January 2011, at Waduk Ir. H. Djuanda, Jatiluhur, in the conical net cage with 0.5 m mesh size. Scientific Echosounder Simrad EY-60 operated at 120 kHz was used for data acquisition with acoustic target of three species of freshwater fishes, i.e tilapia (Oreochromisniloticus), carp (Cyprinus carpio), and catfish (Pangasius hypothalmus).
The fishes were placed in a conical cage specially built in order to be not disturbed by the reflecting contribution of the lateral surface. The transducer is mounted in the center of the surface of the cage oriented downwards (Fig. 1). In this way, the transmitted signal is not attenuated by the net, the cage is sufficiently spacious to permit the movement of the fish and to record the echoes without interference. The cage was submerged down to the depth of about 5 m. Measurements of acoustic descriptors value were done to five fishes per species and taken 2-3 days per species.
Figure1. Construction of net cage
Acoustic Data Processing
Acoustic data were post processed using Echoview Software version 4.8. Data shallower than 1m were removed from analyses to eliminate the transmit pulse and reduce backscatter by surface bubbles. A
to all echograms. The threshold was determined by analyzing a subset of data collected from the measurement and allowed accurate detection of target fishes. Echograms were visually inspected, and doubtful and ‘false’ detections (acoustic interference) were removed. For each detected acoustic target, a set of acoustic descriptors (Table 1), was calculated and extracted.
Table1. Acoustic descriptors and units used in the analysis
Acoustic Descriptor Unit
Energetic
Sv dB TS dB
Area Backscattering Strength dB
Skewness Kurtosis
Morphological
Height m
Positional
Depth m
Relative altitude m
Data Analysis
ANNs are mathematical models inspired by the human brain. They are able to recognize behavioral patterns and learn from their interactions with the environment. Back Propagation (BP) and multiple layer perceptrons (MLPs) neural network were constructed and computed using Matlab 6.0. Theyconsist of three feed-forward layers: input, hidden and output. The input layer was composed of eight variables. The number of nodes in the hidden layer was determined by testing the performance of the models using arrange of node numbers. The dependent variable fish groups represented the output layer. The data set was split into atraining set and validation set consisting of 70% and 30% of the identified shoals, respectively, with the same proportionof each fish group. Theneural network was trained by means of Scaled Conjugate Gradient Back propagation and Levenberg-Marquard learning algorithms in order to develop the ability to correctly classify fish shoals.
RESULTS
Acoustic Descriptors
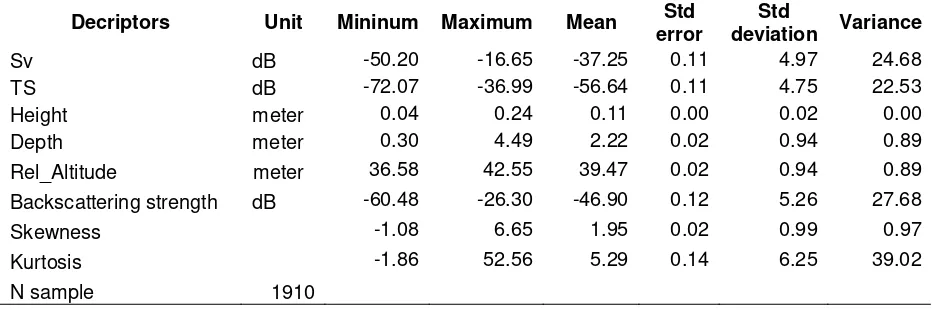
Target strength (TS) of carp and tilapiashowed relatively same value at minimum fish sizes, but slightly higher for catfish as it has different body shape comparing to those the two species. In addition to fish size and body shape, The TS factors depends on
some other aspects, such as swimbladder, the physiological state of the fish and its orientation (Ona, 1999). These aspects were reflected by great variation values of TS, Sv, and area backs cattering strength of the fishes as shown in the tables.
Table 2. The value of parameters of carp (Cyprinus carpio) extracted from acoustic data
Decriptor Unit Mininum Maximum Mean Std
error
Std
deviation Variance
Sv dB -55.75 -33.53 -36.50 0.14 5.95 35.38
TS dB -77.18 -35.76 -52.15 0.15 6.72 45.10
Height meter 0.04 0.24 0.10 0.00 0.03 0.00
Depth meter 0.26 4.35 1.42 0.02 0.86 0.74
Rel_Altitude meter 35.69 83.60 40.34 0.04 1.96 3.83
Backscattering strength dB -86.03 -23.19 -52.96 0.26 11.22 125.91
Skewness -3.04 9.21 1.23 0.03 1.30 1.69
Kurtosis -1.88 88.21 3.35 0.16 7.16 51.28
N sample 1910
Table 3. The value of parameters of tilapia (Oreochromisniloticus) extracted from acoustic data
Decriptors Unit Mininum Maximum Mean Std
error
Std
deviation Variance
Sv dB -52.14 -23.11 -40.03 0.11 4.99 24.87
TS dB -77.55 -46.58 -60.79 0.11 5.01 25.15
Height meter 0.05 0.25 0.10 0.00 0.02 0.00
Depth meter 0.47 4.51 2.76 0.02 1.04 1.09
Rel_Altitude meter 35.49 43.14 38.59 0.03 1.48 2.18
Backscattering strength dB -64.40 -30.56 -49.98 0.12 5.08 25.77
Skewness -1.18 6.56 0.72 0.02 0.75 0.56
Kurtosis -1.75 55.96 0.65 0.06 2.80 7.85
N sample 1910
Table 4. The value of parameters of catfish (Pangasiushypothalmus)extracted from acoustic data
Decriptors Unit Mininum Maximum Mean Std
error
Std
deviation Variance
Sv dB -50.20 -16.65 -37.25 0.11 4.97 24.68
TS dB -72.07 -36.99 -56.64 0.11 4.75 22.53
Height meter 0.04 0.24 0.11 0.00 0.02 0.00
Depth meter 0.30 4.49 2.22 0.02 0.94 0.89
Rel_Altitude meter 36.58 42.55 39.47 0.02 0.94 0.89
Backscattering strength dB -60.48 -26.30 -46.90 0.12 5.26 27.68
Skewness -1.08 6.65 1.95 0.02 0.99 0.97
Kurtosis -1.86 52.56 5.29 0.14 6.25 39.02
Classification using Backpropagation (BP)ANN
Pattern back-propagation ANN was used to recognize pattern as a vector form in the data matrix. Each pattern was given to the network and the output was compared with the response. The error function is calculated after all the patterns are presented. The optimization procedure (learning rule) was Scaled Conjugate Gradient Back propagation, which is a variation of steepest descent algorithm.
Pattern recognition of back-propagation ANN is two layers feed-forward with input and target in a binary form, activation function in the hidden layer and output using transig and biner. Trial and error was applied to determine the number of neuron that would produce highest accuracy in the classification.
Trial and error processes by using 1-100 neurons resulted the accuracy of more than 80%, while those using 1 and 80 neurons gave the accuracy of 67.44% and 31.63%, respectively. Lowest MSE was produced at 50 neurons (MSE = 0.0783) with 15.58% error. By using input of 5730 pattern samples, the highest accuracy was found when the number of neuron in the hidden layer was 30 (Table 5).
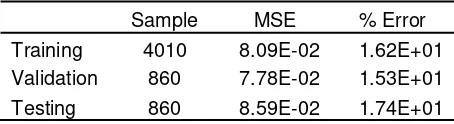
As seen from Table 6, the use of 30 neurons in the hidden layer produced MSE of 0.0809 with 16.16% error at training phase, 0.0778% at validation phase and 0.0858 at testing phase with the errors of 16.16%, 15.30%, and 17.44%, respectively.
Table 5. The MSE value and percentage of the error
No Training algorithm Activation function Neuron MSE % E
1 Scale Conjugate Gradient trainscg 1 0.1582 35.23
2 10 0.0917 19.65
3 20 0.0968 18.49
4 30 0.0778 15.34
5 40 0.0932 18.72
6 50 0.0783 15.58
7 60 0.1056 22.9
8 70 0.0952 19.76
9 80 0.2553 68.37
10 90 0.0927 18.48
11 100 0.0952 19.65
Tabel 6. Results of the validation and testing
Sample MSE % Error
Training 4010 8.09E-02 1.62E+01
Validation 860 7.78E-02 1.53E+01
Testing 860 8.59E-02 1.74E+01
The accuracy of classification for three species of freshwater fish was presented in confusion matrix (Table 7), back-propagation (BP) ANN model gave the accuracy of 84.10% at the training phase 84.80% at the validation phase, and 82.60% during the testing. These results suggested that Back-propagation (BP) ANN model can be used for classification of three species of fresh water fish, directly from their acoustic
Classification using Multi Layer Perceptron (MLP) ANN
Several different configurations of MLP were designed and trained, and we finally settled on a three-layer network with 8 input neurons, 3 hidden neurons and 1 output neuron. Learning rates was defined at 0.5. In this work, Levenberg-Marquard algorithm was applied for calibration or learning method. The best MLP was selected as the one with the lowest error in the validation phase. The results are presented in Table 10.
Carp Tilapia Catfish Total
% Prediction % Prediction % Prediction % Prediction
Training 28.10 27.60 28.40 84.10
Validation 27.10 26.00 31.60 84.80
Testing 29.00 25.90 27.70 82.60
All 28.10 27.10 28.80 84.00
Table 7. Confusion matrix for BP classification
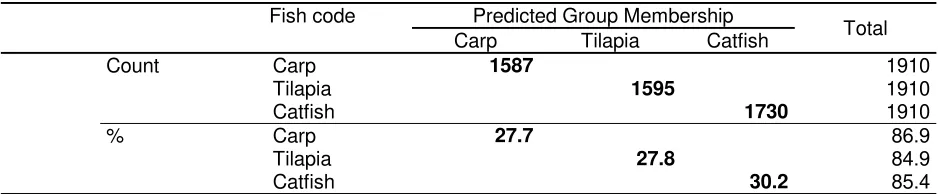
Tabel 8. Confusion matrix for MLP classification
Classification Resultsa
Fish code Predicted Group Membership
Total
Carp Tilapia Catfish
Count Carp 1587 1910
Tilapia 1595 1910
Catfish 1730 1910
% Carp 27.7 86.9
Tilapia 27.8 84.9
Catfish 30.2 85.4
a. 85.7% of original grouped cases correctly classified.
DISCUSSION
The TS of an individual fish depends on the sound frequency, as well as on some fish characteristics such as size, anatomy, physiology and swimming behavior. It is suggested that environmental factors cause different morphological adaptations within species (Fassler et al., 2008) and consequentially backscattering properties.
As is well known, the backscattering energy from the swimming fish is a dynamic quantity, highly dependent on fish behavior, particularly the swim tilt angle (Huse & Ona, 1996).The different behavior is also responsible for the measured systematic differences inestimated mean TS values. The validity of this finding was proved for all three target species. This phenomenon was well known from cage experiments (Simmonds & MacLennan, 2005).
As the modelling techniques have widely available, researchers have a lot of methods ranging from numerical, mathematical and statistical methodsto techniques based on artificial intelligence, particularly ANNs. The choice of the type of network depends on the nature of the problem to be solved. At present, the popular ANNs are multi-layer feed-forward neural networks trained by back propagation algorithm, i.e. back propagation network (BPN). The BPN is most often used, but other networks has also gained popularity.
Ramani & Patrick (1992), Haralabous & Georgakarakos (1996), Simmonds et al. (1996), and Lawson et al. (2001) have applied ANNs for fish-species identification under different conditions, i.e. fish captive in tanks and in the wild and using different input signals to train the ANNs for fish-species classification. Haralabous and Georgakarakos (1996) used the same approach asthat employed here: acoustic descriptors as the input for the ANNs.
Results of the analysis showed that the difference between back propagation (BP)-ANN and MLP was more important for tilapia and catfish, while for carp both model sprovided relatively similar classification level. However, Tables 9 and 10 show that MLP perform better than back propagation (BP) in fish classification. It is likely that MLP is more robust than MLPs and is thus more suitable for dealing with the noise inherent in the training examples of fish shoals.
CONCLUSION
For fish classification using ANNs, the training data have to be constantly updated. This will lead to better classification results for the three species studied, and the addition of other species to the training set. The results of future surveys are necessary before any definitive classification method can be achieved.
REFERENCES
Charef, A., S. Ohshimo, I. Aoki, N.A. Absi. 2010. Classification Of Fish Schools Based On Evaluation Of Acoustic Descriptor Characteristics. Fish Sci. 76:1-11.
Diner, N., Weill, A., Coail, J.Y., & Coudevil, J.M. 1989. “Ines-Movies”: A New Acoustic Data Acquisition and Processing System. ICES Journal of Marine Science, 45:255-267.
Fassler, S.M.M.; Gorska, N.; Ona, E. & Fernandes, P.G. 2008. Differences in swim bladder volume between Baltic and Norwegian spring-spawning herring: consequences for mean target strength. Fisheries Research, 92: 314–321.
Fauziyah. 2005. Identifikasi, Klasifikasi dan Analisis Struktur Spesies Kawanan Ikan Pelagis berdasarkan Metode Deskriptor Akustik. Disertasi (tidak dipublikasikan). Program Pasca sarjana IPB. Bogor. 178 p.
Georgakarakos, S., & Paterakis, O.A. 1993. “School”: A Software for Fish School Identification. ICES Journal of Marine Science, 8:94-108.
Haralabous, J., Georgakarakos, S., 1996. Artificial neural networks as a tool forspecies identification of fish schools, Fisheries-and-Plankton-Acoustics. In: Simmonds, E.J., Maclennan, D.N. (Eds.), Proceedings of an ICES International Symposium, vol. 53. Aberdeen, Scotland, 12–16 June 1995. Academic Press, London, UK, p. 173–180.
Huse, I., & Ona, E. 1996. Tilt angle distribution and swimming speed of over wintering Norwegian spring spawning herring. ICES Journal of Marine Science, 53: 863-873.
Jech, J.M., Michaels, W.L. 2006. A multi frequency method to classify and evaluate fisheries acoustics data. Can J Fish Aquat Sci 63: 2225–2235.
Lawrence, 1992. Introduction to Neural Networks and Expert System. California Scientific Software. 264 p.
Muhiddin, A.M., 2007. Permodelan Jaringan Saraf Tiruan (Artificial Neural Networks) Untuk Identifikasi Kawanan Lemuru Dengan Menggunakan Deskriptor Akustik. Disertasi (tidak dipublikasikan). Program Pascasarjana IPB. Bogor. 165 p.
Ona, E., 1999. Methodology for target strength measurements. ICES Coop. Res. Rep.235: 59 p.
Ramani, N.,& Patrick, P.H., 1992. Fish detection and identification using neural networks—some laboratory results. IEEE J. Ocean. Eng. 17, 364– 368.
Robotham, A., Bosch, P., Estrada, J.C.G., Castilla, J., Calvo, I.P., 2010. Acoustic Identification of small pelagic fish species in Chile using support vector machines and neural networks. Fisheries Research. 102:115-122.
Simmonds, E.J., Armstrong, F., Copland, P.J., 1996. Species identification using wide band backscatter with neural network and discriminant analysis. ICES J. Marine Sci. 53, 189–195.