GEOTHERMAL FIELD
Listiana Satiawati1*), Djoko Sulistyanto2), Kris Pudyastuti3)
1* 2 3)Program Studi Teknik Perminyakan Fakultas Kebumian dan Energi Universitas
Trisakti, Jakarta 11440
*)e-mail: listianasatiawati@yahoo.com
Abstract
Forecasting of geothermal production decline is one of the main tasks in reservoir engineering, in order to manage the reservoir and maintain the sustainability of the resource utilization. Studies on the analysis of production decline in geothermal fields have been widely implemented, one of which is the DCPA conducted by H.A. Davila J. (Davila,2017), and applied in Kamojang geothermal field - West Java Indonesia. DCPA 'Davila' in Kamojang (steam dominated) geothermal field, appears to be more accurate than previous studies. This study is to support the DCPA by creating a computer program (algorithm and numeric calculation written in Fortran90/95 programming languages (Imam,2009) (Tanja,2005)), thus it can expected to speed up the data matching process or the analysis process.
Keywords: Steady state, Decline cumulative production analysis, Steam dominated, Liquid dominated, Geothermal field, Algorithm, Fortran
Introduction
In order to improve the economicsof a field (hydrocarbons or geothermal), it is necessary to implement the reservoir management; part ofthat is an optimum reinjection design. The beginningof an optimum reinjection design is a declinecumulativeproductionanalysis (DCPA) .The applicationof DCPA can be used to predict a cumulativeproductiondecline in a well.
Departed from DCPA’sDavilawhoreportedthattherewas a good match between DCPA and production rate measurements at the KMJ-11 well. The well is completed in the waterdominatedreservoir and mostlyproduce 100% steam (S. Sudarman, et.al., 1995). Thisstudyaimed at making the DCPA algorithmusingprograminglanguage. It is expectedthatthisstudywill be continued at a later stageofmaking DCPA software.
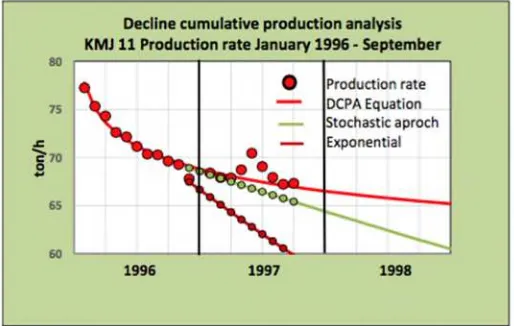
Fig. 1 shows the flow rate forecastingwith the DCPA’sDavilamethod (red line) plotveryclosewith the production rate data (red cycle), the stochastic and exponentialarerepresented by green and brownlinerespectivelydiverging from the data KMJ-11.
DeclineCumulativeProductionAnalysis (DCPA)
Analysis to predict the declineofproduction by using Decline Cumulative Production Analysis (DCPA) method has beendone by several researcher ; oneofthem is Davila (2017).
Figure 1: Production rate forecast KMJ 11(Davila,2017).
Mathematical Model
A formula to forecast the geothermal production has been developed base on the linear relationship of decline cumulative production versus cumulative production and decline cumulative production versus production time charts (Afken,2005) (Boas,2006) (Kreyszig,2011). The analysis is taken under steady state condition (Davila,2017).
Derivation of cumulative production (Q) is,
(1)
q is the production rate.
The decline cumulative production (QD) is,
(2)
The linear relationship of QDand Q is,
(3)
so (4)
The linear relationship of QDand t (time) is,
(5)
so (6)
(8)
(9)
Eq. (9) is the production rate-time equation,
where (10)
is initial rate,
and (11)
is time decline exponent. The flow rate is
(12)
and the natural logarithm is,
(13)
is the slope in flow rate versus time.
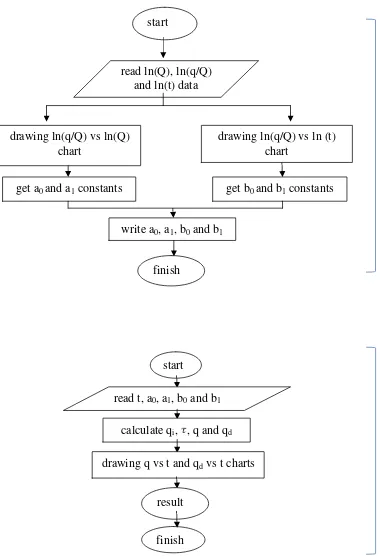
The algorithms, sequences or steps to calculate qi, , and q and to plot production rate versus time as follow,
read q and t data
calculate Q, ln(Q),
q/Q, ln(q/Q) and ln(t)
write ln(Q), ln(q/Q)
and ln(t) data
finish
start
Figure 2: The flowchartof the algorithmof DCPA
Procedure (steps of the study):
The data used for DCPA is Kamojang field (steam dominated type of reservoir), i.e. production rate of KMJ-11 well (Sri,2011) is:
start
read ln(Q), ln(q/Q)
and ln(t) data
drawing ln(q/Q) vs ln(Q)
chart
drawing ln(q/Q) vs ln (t)
chart
get a
0and a
1constants
get b
0and b
1constants
write a
0, a
1, b
0and b
1finish
start
read t, a
0, a
1, b
0and b
1data
calculate q
i, , q and q
ddrawing q vs t and q
dvs t charts
result
finish
Excel
Month ton/hour
From the natural logarithm of QD and Q chart (Figure 3) we can determine the a0 and a1
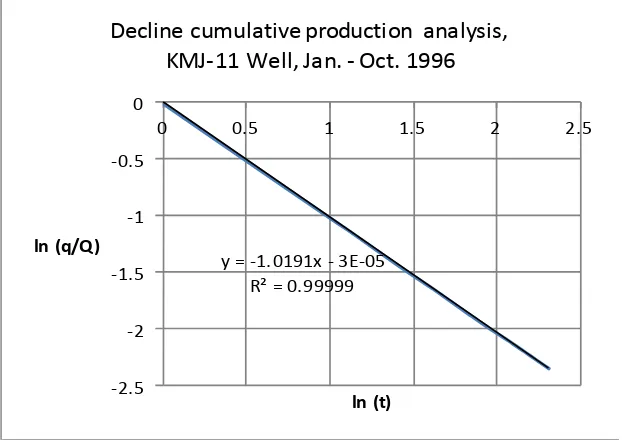
constants, and from the natural logarithm of QDand t chart (Figure 4) we can determine
the b0and b1constants.
Decline cumulative production analysis ,
KMJ 11 Well, Jan.-Oct. 1996
Figure 3: Natural logarithm of decline cumulative production (QD) and cumulative
y = -1.0191x - 3E-05 R² = 0.99999
-2.5 -2 -1.5 -1 -0.5 0
0 0.5 1 1.5 2 2.5
ln (q/Q)
ln (t)
Decline cumulative production analysis,
KMJ-11 Well, Jan. - Oct. 1996
Figure 4: Natural logarithm of decline cumulative production (QD) and production time
(t).
Substitution a0, a1, b0, and b1to Eqn. (10) and (11), to calculate initial rate (Qi) and decline
exponent , and then we get the production rate – time equation:
ton/hour.
The Result
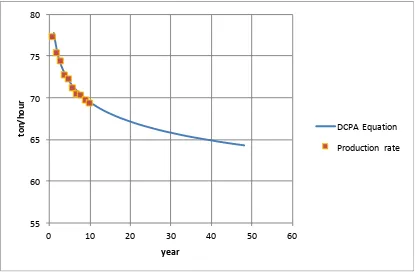
The DCPA algorithm has been written and executed. Plotting the calculated production rate versus time has been done. Figure 5 shows the decline production curve obtained with the DCPA (blue line) plot very close the production rate data KMJ-11 well (yellow square).
55
Figure 5: Matching curve between the DCPA (calculated) and the decline production (measurement data) of KMJ-11 Well, and production rate forecast KMJ 11 Well, Kamojang
Geothermal Field, West Jawa, Indonesia
Conclusion
The DCPA algorithm has been made in this research, with the possibility to use as a toll for production forecasting for the dominated steam as well as the liquid dominated of geothermal wells.
It is expected that the following research can be continued by using the recent data measurement of KMJ 11, and other wells in Kamojang Geothermal Field; before continuing in applying the DPCA in Liquid Dominated wells.
Reference
H.A. Davilla Jose, 2017, Applying Decline Cumulative Production Analysis (DCPA) to Geothermal Resources,Proceedings, 42nd Workshop on Geothermal Reservoir Engineering,
Stanford University, Stanford, California. SGP-TR-212.
Erwin Kreyszig, 2011,Advanced Engineering Mathematics, John Willey & Sons, inc., USA.
George B. Arfken, 2005, Mathematical Methods for Physicists, sixth ed., Elsevier Academic Press.
Imam Fachruddin, 2010,Pengantar Fortran 90, DepartemenFisika, Universitas Indonesia.
SayogiSudarman, M. Boedihardi, Kris Pudyastuti, Bardan, 1995, Kamojang Geothermal Field 10 Year Operation Experience. World Geothermal Congress, Florence, 1995.