1
The Effect of Farmer-Pastoralist Violence on State-level
Internal Revenue Generation in Nigeria
A Modified Synthetic Control Analysis Approach
Topher L. McDougal a, Talia Hagerty b, Lisa Inks c, Caitriona Dowd d, Stone Conroy c
a
Kroc School of Peace Studies, University of San Diego, San Diego, USA b
Institute for Economics and Peace, Sydney, Australia c
Mercy Corps Nigeria, Abuja, Nigeria d
University of Sussex, UK
08 April 2015
— Draft for comment. Not for citation or circulation. —
Abstract
Nigeria’s ethnically and religiously diverse Middle Belt has experienced recurrent eruptions of
violence over the past several decades. Disputes between pastoralists and farmers arise from disagreements over access to farmland, grazing areas, stock routes, and water points for both animals and households. Although relatively low in intensity, this form of violence is widespread, persistent, and arguably increasing in its incidence. This study seeks to answer the question: How has farmer-pastoralist conflict affected state internally-generated revenues (IGR)? The literature on the effect of violence on sub-national fiscal capacity is slim to none. We use a synthetic control approach to model how IGR for four conflict-affected states – Benue, Kaduna, Nasarawa, and Plateau – would have developed in the absence of violence. To account for the endogeneity criticism commonly leveled at such synthetic control analyses, we then use a fixed-effects IV model to estimate IGR losses predicted by the synthetic control analysis as a function of farmer-pastoralist fatalities. Our conservative estimates for percentage reduction to annual state IGR growth for the four states are 0%, 1.2%, 2.6%, and 12.1% respectively, implying that IGR is likely much more sensitive to conflict than GDP. In total, the four study states of Benue, Kaduna, Nasarawa, and Plateau are estimated to have lost between US$719 million and US$2.3 million in 2010, or 22-47% of their potential IGR collection during the period of intense violence.
2
Introduction
This study seeks to answer the question: How has farmer-pastoralist conflict affected state government revenues (IGR) in Nigeria’s Middle Belt? This is just one component of the broader costs of farmer-pastoralist conflict in Africa’s largest economy1. Such farmer-pastoralist conflicts are commonplace across the West African Sahel, and may generally exacerbate religious conflict, as farmers there tend to be Christian and pastoralists Muslim. This study in particular is geared toward generating greater awareness among local politicians and external actors of the importance of this phenomenon – often overshadowed by Islamist extremism in the Northeast and violence related to oil extraction in the Niger Delta region. Whilst a small body of literature has considered the effect of violent conflict on fiscal capacity (e.g., Chowdhury & Murshed, 2013), to the authors’ knowledge, no study has looked at non-civil war violence as a predictor, chosen a sub-national unit of analysis, or used synthetic control analysis to model
hypothetical, alternative IGR “histories” under the assumption of peace. In all these ways, this
study is unique.
Background
Nigeria’s ethnically and religiously diverse Middle Belt has experienced recurrent eruptions of
violence over the past several decades. Disputes between pastoralists and farmers arise from disagreements over the use of land around farmland and/or grazing areas and stock routes and access to water points for both animals and households. A range of factors underlie these disputes, including increased competition for land (driven by desertification, climate change, and population growth), lack of clarity around the demarcation of pasture and stock routes, and the breakdown of traditional relationships and formal agreements between pastoralists and farmers. These conflicts undermine market development and economic growth by destroying productive assets, reducing production, preventing trade, deterring investment by private sector actors, and eroding trust and social cohesion. Because livelihood strategies in Nigeria are closely tied to identity and because access to services and opportunities can vary across identity groups, many pastoralist/farmer conflicts take on ethnic and religious hues and are exacerbated along identity lines. These conflicts undermine market development and economic growth by destroying productive assets, reducing production, preventing trade, deterring investment by private sector actors, and eroding social cohesion.
1
This study is part of a UK Department for International Development (DFID)-funded Mercy Corps program
entitled “Conciliation in Nigeria through Community-Based Conflict Management and Cooperative Use of
Resources” (CONCUR). We thank DFID and Mercy Corps for their support. The authors gratefully acknowledge
3
Methods
Nigerian states receive revenue in two main ways: taxes collected within the state and disbursements from the federal government (much of which is derived from oil revenues). There are other economic and peace and conflict dynamics that affect oil revenues and disbursements, which are outside the scope of this study. As such, we focus on internally generated revenue (IGR) in order to measure the effects of farmer-pastoralist conflict at the state level.
We examine IGR for two reasons. First, we find it to be a suitable proxy for gross domestic product on the Nigerian state level, or, gross state product. Measurements of economic growth in terms of product are not available on the state level, however we can assume that trends in IGR mirror, to some extent, trends in gross state product. As such, measuring the effect of conflict on IGR provides a picture of the impact of conflict on the state-level economy and an indication of the effect of conflict on the trend line of gross state product. Second, we expect that this information will be most relevant to policymakers. To the extent that policymakers in the four targeted Middle Belt states have the opportunity to positively transform the farmer-pastoralist conflict, measurements of the economic impacts of this conflict on the state level economy provide an economic incentive for doing so.
The purpose of synthetic modeling analysis is to construct a hypothetical counterfactual scenario that may or may not obtain under any believable set of real-world circumstances. In effect, this research question asks: “How would the local economies of the four target states have performed differently if the recent dramatic rises in farmer-pastoralist violence had never occurred?” The hypothetical counterfactual history can then be compared to the actual economic performance in the actual (conflict-affected) area.2 This is a hypothetical retrospective question, and is thus different from a hypothetical prospective question along the lines of: “How would the local
economy perform differently in the future if acts of farmer-pastoralist violence stopped occurring
now?”
Taking this as a starting point, the proposed approach employs a synthetic modeling strategy to construct a hypothetical counterfactual in which rises in farmer-pastoralist violence never occurred. It does this by using longitudinal (i.e., time-series) measurements of IGR in similar states that have not experienced (much) farmer-pastoralist violence to estimate a model of a community that has, but only up until the point at which violence erupted. The states used as predictors may be selected on the basis of some matching algorithm (e.g., factor analysis or
Coarsened Exact Matching (CEM)): this technique roughly pairs up “treatment” and “control”
states. Once the model is parameterized in this way, it is used to predict later hypothetical values of IGR in the violence-affected state. These values represent the model’s best estimate of IGR in the community, had violence never occurred. In practical terms, this approach requires a
2 One prominent example of this methodology in assessing the costs of conflict is Abadie and Gardeazabal (2003).
4
relatively long time-series of income measures in both control and treatment states. During the preparation for this report, MC obtained CBN-published annual reports on the Nigerian economy from NBS dating back to 1980.
The most common criticism of the synthetic modeling approach is that the (control) territorial units employed in the statistical construction of the hypothetical counterfactual may differ fundamentally in unobserved ways from the study (treatment) area (Skaperdas, Soares, Willman, & Miller, 2009, p. 6). In other words, economic performance and violent conflict are highly endogenous (i.e., interrelated) phenomena. It is possible that Nigerian states that experienced dramatic rises in farmer-pastoralist violence also had economies that performed more poorly in some fashion, thereby shaping the very structural conditions that led to violence in the first place. However, the best-case scenario controls for endogeneity are incompatible with either the synthetic control analysis or our available data. An econometric estimator that would effectively control for endogeneity (e.g., a fixed-effects (FE) instrumental variable estimator) would not address itself to the proposed target states exclusively, as it would require more observations, and would certainly not be capable of addressing the economic losses from each state on an individual basis. Furthermore, an estimator such as the Arellano-Bond GMM is designed for many observations and short time panels, rather than the reverse (our case). Finally, a FE IV regression is unable to recreate a counter-factual history of the state’s finances, as the synthetic approach does.
Therefore, in order to minimize the endogeneity concern, we have decided to use a FE IV model in post-estimation to assess the losses to IGR that we predict using the synthetic analysis. We then use a Population Attributable Fraction post-estimation analysis to quantify the percentage of the predicted IGR losses that we can causally attribute to farmer-pastoralist violence. We thus attempt to combine the best of both worlds.
Violence Dataset Creation
Our analysis requires two datasets of violent events in Nigeria, both constructed using the UCDP Georeferenced Event Dataset (GED) and the ACLED dataset for Nigeria for all available years. UCDP covers the period 1990-2010, while ACLED covers the period 1997-present. We first created a national dataset of all violent events with at least one fatality, during all conflicts, by appending the ACLED and UCDP datasets; we then collapsed this dataset by month to obtain monthly totals of violent-event related fatalities for each state from 1990 to 2013. This national dataset of monthly fatalities by state allows us to determine relative levels of violence, in order to identify comparatively peaceful predictor states for the synthetic control region.
5
experiencing such violence. We have attempted to create an authoritative dataset on farmer-pastoralist violence from ACLED and UCDP sources by applying the inclusion and exclusion criteria for farmer-pastoralist violent conflict events listed in Appendix A. This included dropping out events (observations) that involved actors deemed not directly associated with such farmer-pastoralist clashes (e.g., acts claimed by Boko Haram, more properly known as Jama'atu Ahlul Sunnah Lih Da'awa wal Jihad (JAS)).
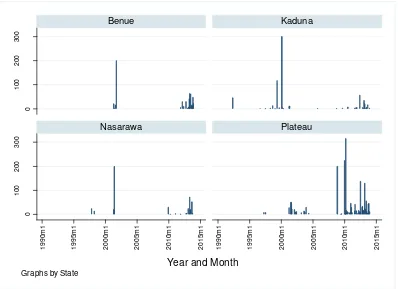
Figure 1. Farmer-pastoralist fatalities reported in each of the four study states by month, 1990-2013.
It is worth noting that our data management process has not eliminated violent events that may have been more influenced by religious tension at the national and state levels than strictly farmer-pastoralist conflict, many of which took place in urban areas.3 And yet whilst these instances of urban violence do not resemble the rural skirmishes over land that this study primarily targets, nor are they unrelated. Though the media termed the 2001 Jos riots “religious” clashes, underlying causes relate to economic and political factors linked to livelihoods and
3
For instance, following the return of democratic rule in 1999, a number of state governors in the north of Nigeria pushed through the adoption of Islamic Sharia law, including Kaduna in 2001. Riots representing non-Muslim minorities in those states became commonplace, and violence spread, too, to neighboring states where tensions ran high. Jos, for example, experienced riots in 2001 over the appointment of a Muslim politician to coordinate the federal poverty alleviation program within the state. Indeed, such urban riots over local political elections occurred
in Yelwa (Plateau) in 2004, and again in Jos in 2008 and 2010 (see Figure 1, “Plateau”).
6
control of resources. Moreover, the causality between rural and urban violence may run in the other direction, as well. The January 2010 Jos riots seem to have precipitated a dawn raid by pastoralists on villagers in a nearby farming town, where the death toll may have exceeded 500 (citation).
Moreover, UCDP and ACLED have different time coverage periods (1990-2010 and 1997-2013 respectively). We have therefore modeled each dataset as a function of the other during the period of overlap (1997-2010), and used those models to predict the number of fatalities each source would have reported if it currently kept those records. We then averaged the two inferred datasets for each year by state to create a complete and, for our intents and purposes, authoritative dataset for the entire study period (1990-2013).
Choosing Predictors
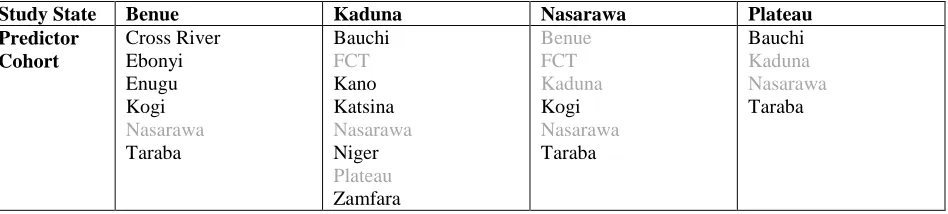
The choice of predictor in the synthetic analysis has as triple criteria that the state (1) be geographically contiguous with one of the study states (i.e., share a border); (2) exhibit low rates of reported fatalities from any violent conflict event, per our national dataset, past the designated cut-off time; and (3) prove a statistically significant predictor of the outcomes (i.e., relevant to the model). The first criterion creates a cohort of potential predictors for each of the four study states, as shown in Table 1. However, if the number of statistically significant predictor states ultimately fell below two, we would begin the selection process again starting with all predictors listed in Table 1 pooled together (that is, all predictor states in Table 1 become eligible to predict any one study state regardless of whether they are geographically contiguous with the specific study state they are used to predict).
Table 1. Cohorts of contiguous predictor states grouped by study state. Study states and the FCT are greyed out.
Study State Benue Kaduna Nasarawa Plateau
Predictor
7
Cross River, Ebonyi, Enugu*, Katsina, Kogi, Niger, and Zamfara* (where asterisks denote slightly elevated violence levels, making them less preferable as predictors). We also excluded the Federal Capital Territory (FCT), as it contains the Capital city of Abuja and might therefore be considered an idiosyncratic case for numerous associated reasons.
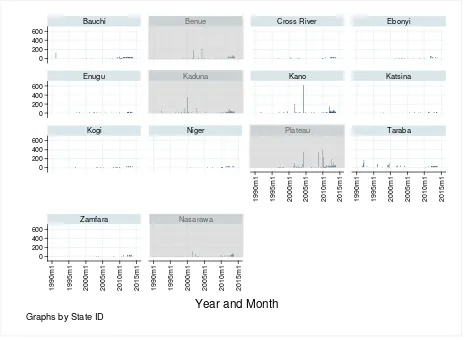
Figure 2. All fatalities reported by state and month in the predictor states. Study states (outcomes) are greyed out.
We then determined what temporal cut points we could use. In all cases, we chose the first month in which fatalities exceeded 25. This rule also tended to produce cut points coinciding with extended periods of heightened violence. We only run one synthetic control for each state. This is because the use of less violent states to predict alternative scenarios for more violent states is only defensible up to the point when the more violent states exhibit elevated violence
levels. Once a state has a history of violence, it could be argued that the state’s economy,
political climate, and/or social structure have been altered in a way that makes them more prone to future violence – the so-called “conflict trap” (Collier et al., 2003). With that in mind, Table 2 lists the chosen cut points for each study state.
8
Study State Date of First Extreme Violence Fatalities Inferred
Benue October 2001 182
Kaduna May 1992 52
Nasarawa June 2001 113
Plateau April 2001 39* (riots)
* Denotes the beginning of a protracted period of violence. Source: ACLED and UCDP, calculations by the authors.
Data Creation for IGR
We obtained data on Internally Generated Revenue (IGR) (and VAT, or Value Added Tax) from the annual reports of the Central Bank of Nigeria. Years of data availability since 1980 include the periods 1980-1984, 1987-2004, and 2007-2012. Once entered into spreadsheet form, we undertook three operations to make the dataset a more robust panel of comparable entries.
First, we created a number of historical reconstructions of present-day states, as Nigerian states have gradually been split up into smaller units. In most cases, those smaller units become states in their own right, whilst in some cases, the smaller units were combined with splinters of other states to make new states. Table 3 includes all Nigerian states whose boundaries have changed since 1980, along with descriptions of how they are related to the creation or break-up of other states. Some information is redundant, as entries for states sharing a common history will refer to one another.
9
No. State Creation Status
1 Abia Contained in Ibo state until 1992
Comprised half of Ebonyi state until 1996
2 Adamawa Contained in former Gongola state until 1991
3 Akwa Ibom Contained in former Cross River State until 1987
4 Anambra Comprised present-day Enugu until 1991
5 Bauchi Comprised Gombe until 1996
6 Bayelsa Contained in Rivers State until 1996
7 Bendel Former state comprising Delta and Edo states until 1991
8 Benue Comprised half of present-day Kogi state until 1990
9 Borno Comprised Yobe until 1991
10 Cross River Comprised Akwa Ibom until 1987
11 Delta Contained in former Bendel state until 1991
12 Ebonyi Created from roughly equal-sized parts of Enugu and Abia states in 1996
13 Edo Contained in former Bendel until 1991
14 Ekiti Contained in Ondo until 1996
15 Enugu Contained in Anambra until 1991
16 Gombe Contained in Bauchi until 1996
17 Gongola Former state comprising Adamawa and Taraba states until 1991
18 Imo Comprised Abia state until 1991
19 Jigawa Contained in Kano until 1991
20 Kaduna Comprised Katsina until 1987
21 Kano Comprised Jigawa until 1991
22 Katsina Contained in Kaduna until 1987
23 Kebbi Contained in Sokoto until 1991
24 Kogi Created from roughly equal-sized parts of Kwara and Benue states in 1991
25 Kwara Comprised half of Kogi state until 1991
26 Nasarawa Contained in Plateau until 1996
27 Ondo Comprised Ekiti state until 1996
28 Oyo Comprised Osun until 1991
29 Plateau Comprised Nasarawa until1996
30 Rivers Comprised Bayelsa state until 1996
31 Sokoto Comprised Zamfara and Kebbi states until 1991
32 Taraba Contained in Gongola until 1991
33 Yobe Contained in Borno until 1991
34 Zamfara Contained in Sokoto until 1996
In the case of states that have been split in two (call them i and j), the historical reconstruction of the original state h adds IGR from the later smaller units back into the totals reported for the state. In this way, � ℎ = � + � , where � > �∗, � represents the time in years, and �∗ represents the time at which state ℎ was split apart. For instance, Gongola, which was split in 1991 into Adamawa and Taraba, received a historical reconstruction that simply contains the
sum of Adamawa’s and Taraba’s future respective IGRs for each year.
10
state ℎ. Thus, historical IGR for future break-off state would be calculated as � =
� ℎ (
�� ∗+1 �� ℎ ∗+1).
The second operation we perform is a simple inflation adjustment, using the World Bank’s GDP
deflator for Nigeria. This has the effect of putting all IGR data in 2010 constant Naira. Third, we perform an interpolation function. The interpolation allows us to fill in missing data cells, primarily from the periods 1985-1986 and 2005-2006, but also other randomly missing cells. For instance, in the aftermath of the 1996 state reorganization under the military Abacha regime, a number of newly formed states failed to report IGR – presumably because they still lacked the institutional capacity to collect it.
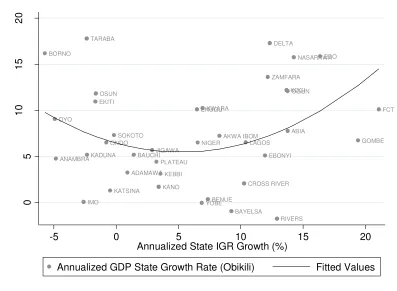
We compared the state IGR data derived in this way to the inferred state GDP growth percentages calculated by Obiliki (2014, p. 16) for the period 1999-2012. A cross-sectional regression yields a statistically significant relationship between the two, though the relationship is non-linear (see Figure 3).
Figure 3. Annualized state GDP growth as a function of annualized state IGR growth, 1999-2012
BORNO
11
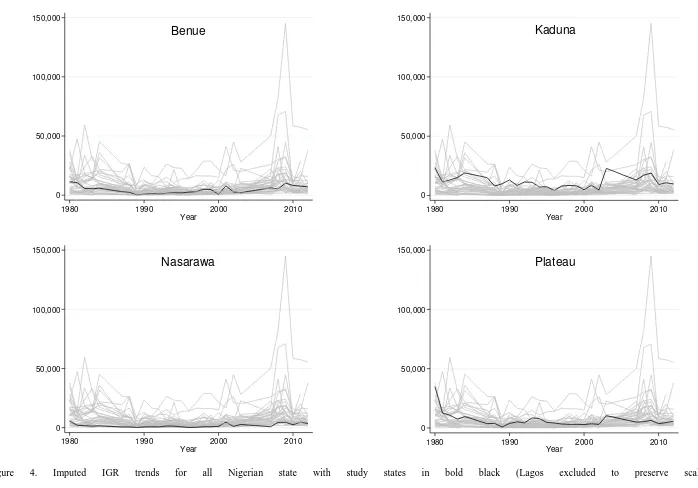
Figure 4. Imputed IGR trends for all Nigerian state with study states in bold black (Lagos excluded to preserve scale)
0 50,000 100,000 150,000
1980 1990 2000 2010
Year
0 50,000 100,000 150,000
1980 1990 2000 2010
Year
0 50,000 100,000 150,000
1980 1990 2000 2010
Year
0 50,000 100,000 150,000
1980 1990 2000 2010
Year
Nasarawa Plateau
12
IGR and GDP do not necessarily grow in lockstep with one another, as IGR depends not only on GDP, but also on rates and modes of taxation, fiscal capacity, and the relative size of the black and grey markets, among other considerations. Figure 4, displaying imputed IGR trajectories for all Nigerian states except Lagos, illustrates this point. IGR declines to relatively low levels throughout the 1980s and 1990s, only rising again in the 2000s. This trough roughly corresponds to the reign of the Washington Consensus and a prevailing insistence on government retrenchment.
Empirical Specification
Once we have predicted IGR losses based on the synthetic control scenarios, we can regress them on farmer-pastoralist violent conflict event fatalities. However, at least two major criticisms can be leveled against these methods. The first is that the nature of the synthetic control generation means that there will be very little violence prior to the cut point, as well as very little derogation of the control from the actual IGR. This implies that losses will, by design, be at or near zero prior to the cut point. Taken together, these observations imply that our findings might be built into our methods from the start. The second criticism, as outlined above, is that of endogeneity, since IGR losses presumably influence violence, in addition to being influenced by them. Relatedly, the cut points, while defined by surges in violence, may occur synchronously with variations in unobserved variables. In that case, the predicted losses in IGR may not be entirely accounted for by violence alone.
Therefore, we propose two modifications to a simple, uncontrolled OLS regression. The first modification is the introduction of two simple control variables for (a) whether or not the cut point for that state has been reached or not, and (b) how many years since the cut point was reached (since the predictions will tend to degrade and become more volatile the farther they are from the cut point).
The second modification we propose is the use of an IV regression, pending the outcome of a Durbin-Wu-Hausman test for endogeneity. For an instrumental variable, we have chosen to use the phenomenon of adoption of Sharia law by certain states in northern Nigeria. Beginning with the restoration of democratic rule in 1999, state governments of various northern Nigerian states began introducing bills to adopt Sharia law, whether in restricted form (i.e., dealing only with interpersonal matters) or expansive form (i.e., dealing with all criminal matters). Such proposals were highly contentious, and may have catalyzed some episodes of violence in northern Nigeria in the run-up to their adoption. Our idea was that the anxiety around Sharia adoption in
neighboring states would cause violence, and yet such anxiety was not likely to affect IGR in
one’s home state, except through the mechanism of violence. (In contrast, the imposition of
13
neighboring state adopts Sharia in that year. Finally, we create our instrumental variable as the inverse of post-1998 years until . In other words, we consider the possibility for anxiety to be minimal until the restoration of democracy in 1999, but that anxiety then builds in the run-up to
other states’ Sharia proposals. The instrumental variable for state in year � is then defined as:
�� = { 1
1+|�� − |, � � ≥ � ≥ 999 , � � < � | � < �
, � < 999
where � denotes the time at which state adopts Sharia law.
Finally, we estimate a population attributable fraction to determine the share of IGR losses attributable to farmer-pastoralist conflict. PAF is usually used to determine the proportion of disease incidence that is attributable to exposure to the risk factor (Greenland & Drescher, 1993; Last, 2001, p. 137). Here we want to attribute the proportion of the wealth destruction that is attributable to exposure to violence. The PAF for adjusted predictions is often defined:
�� =Pr | ∗( � −1)
� ,
where Pr | represents the prevalence of exposure given the disease (in our case, fatalities), and � represents the adjusted relative risk of disease (here, the adjusted prediction of IGR losses as a function of violence) (see, e.g., Doidge, Segal, & Gospodarevskaya, 2012).
Results
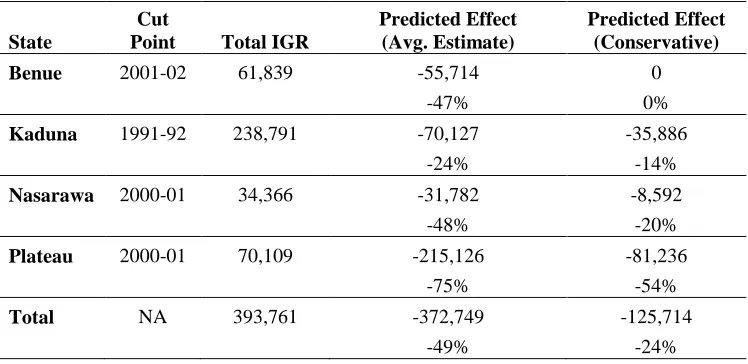
The synthetic control analysis produced predicted trends and confidence intervals for each study state. Actual IGR and these synthetic control predictions are illustrated in Figure 5. It is clear that the actual IGR for all states generally falls below the synthetic control, as would be expected – though it does not always fall outside of the 95% confidence interval. The summed difference between the actual IGR and synthetic control represents a hypothetical financial loss to the state government. Summing those losses and dividing them by the total summed IGR in the synthetic control yields a percentage of total government revenues lost during the period from the cut point for each state to 2012. These absolute and percentage-wise losses (presented in Table 4) vary by state and whether or not the most conservative assumptions are underpinning the estimates. Plateau state is predicted to have lost a greater share of its hypothetical IGR than the other states
14
Table 4. Absolute and percentage-wise IGR losses from the cut point to 2012.
State
Cut
Point Total IGR
Predicted Effect (Avg. Estimate)
Predicted Effect (Conservative)
Benue 2001-02 61,839 -55,714 0
-47% 0%
Kaduna 1991-92 238,791 -70,127 -35,886
-24% -14%
Nasarawa 2000-01 34,366 -31,782 -8,592
-48% -20%
Plateau 2000-01 70,109 -215,126 -81,236
-75% -54%
Total NA 393,761 -372,749 -125,714
15
Figure 5. Actual and predicted IGR for Benue, Kaduna, Nasarawa, and Plateau states with cut-points in red, 1980-2012
-2
Imputed IGR: Benue Synthetic control IGR: Benue
Synthetic control IGR, 95% CI: Benue
Imputed IGR: Kaduna Synthetic control IGR: Kaduna
Synthetic control IGR, 95% CI: Kaduna
Imputed IGR: Nasarawa Synthetic control IGR: Nasarawa
Synthetic control IGR, 95% CI: Nasarawa
Imputed IGR: Plateau Synthetic control IGR: Plateau
Synthetic control IGR, 95% CI: Plateau
Nasarawa Plateau
16
Figure 6 illustrates time trends for fatalities and IGR losses in the four study states. It is important to note that, whilst the synthetic controls and thus predicted IGR losses are predicated on cut points defined by violent events, violence data in no way parameterizes or otherwise influences the synthetic control creation. That is, violence data does not enter the predictive models as a control variable. Rather, its only influence is felt negatively and indirectly in the fact that the predictor states are not (or, rather, less) violent. This being the case, it is interesting to note that the predicted IGR losses seem to occur during or just following a particularly violent year, particularly in in Benue and Plateau.
We therefore attempt to test this relationship more rigorously. Table 5 shows time-series OLS estimates with fixed-effects at the state level of IGR losses (both average and conservative estimates) on farmer-pastoralist violence and lagged farmer-pastoralist violence variables for each state4. Both concurrent and lagged violence variables manifest a strong, positive statistical relationship to the outcome of IGR losses. (Note that this is the same as saying there is a strong, negative relationship to the outcome of difference between the actual imputed IGR for each state and its corresponding synthetic control.)
Table 5. Fixed-effects OLS regression results of estimated IGR losses (average and conservative estimates) on fatalities and lagged fatalities by state.
(1) (2) (3) (4)
ACLED / UCDP fatalities 8.366* 6.032**
(4.694) (2.624)
Lagged Estimated Fatalities 21.05*** 11.82***
(4.214) (2.414)
4“Lagged violence” means that we are testing the statistical relationship not between violence and IGR losses in the
17
Figure 6. Estimated fatalities and synthetically predicted IGR losses in each study state by year, 1990-2012
-5 Estimated lost IGR, average Estimated lost IGR, conservative
-1 Estimated lost IGR, average Estimated lost IGR, conservative
0 Estimated lost IGR, average Estimated lost IGR, conservative
0 Estimated lost IGR, average Estimated lost IGR, conservative
Nasarawa Plateau
18
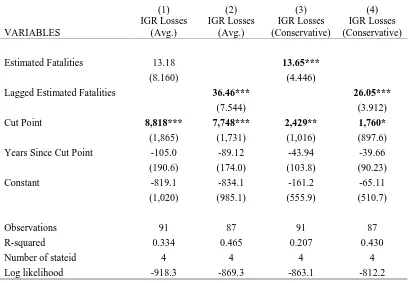
Table 6 displays the results of time-series OLS regressions with the inclusion of cut point controls. Of note, the effect sizes of fatalities, whether lagged or not, have dropped to varying extents.
Table 6. Fixed-effects OLS regression results of estimated IGR losses (average and conservative estimates) on fatalities and lagged fatalities by state, controlling for cut point.
(1) (2) (3) (4)
Estimated Fatalities 13.18 13.65***
(8.160) (4.446)
Lagged Estimated Fatalities 36.46*** 26.05***
(7.544) (3.912) Sharia law in civil (1) or all (2) legal matters, divided by the years since adoption plus one. We also employed a similarly-constructed variable for the adoption of Sharia law in neighboring
19
test indicated were unnecessary. The relationship between lagged violence and IGR losses is of a larger magnitude than that between un-lagged violence and IGR losses, though all models show a positive and significant relationship. The average loss estimates suggest that for every fatality classified as being attributable to farmer-pastoralist conflict, the local state government stands to lose NGN 162,000 in 2010 Naira (roughly $1,065 in 2010 USD) the following year. Conservatively, each farmer-pastoralist conflict fatality costs the local state NGN 48,730 in 2010 Naira (roughly $320 in 2010 USD).
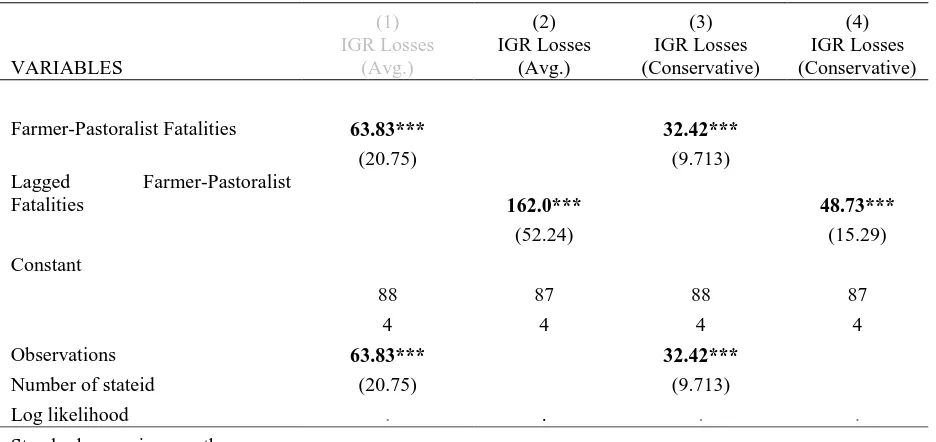
Table 7. Fixed-effects IV regression results of estimated IGR losses (average and conservative estimates) on fatalities and lagged fatalities by state. Columns indicated as non-endogenous are greyed out.
(1) (2) (3) (4)
Number of stateid (20.75) (9.713)
Log likelihood . . . .
Standard errors in parentheses
*** p<0.01, ** p<0.05, * p<0.1
Population Attributable Fractions
20
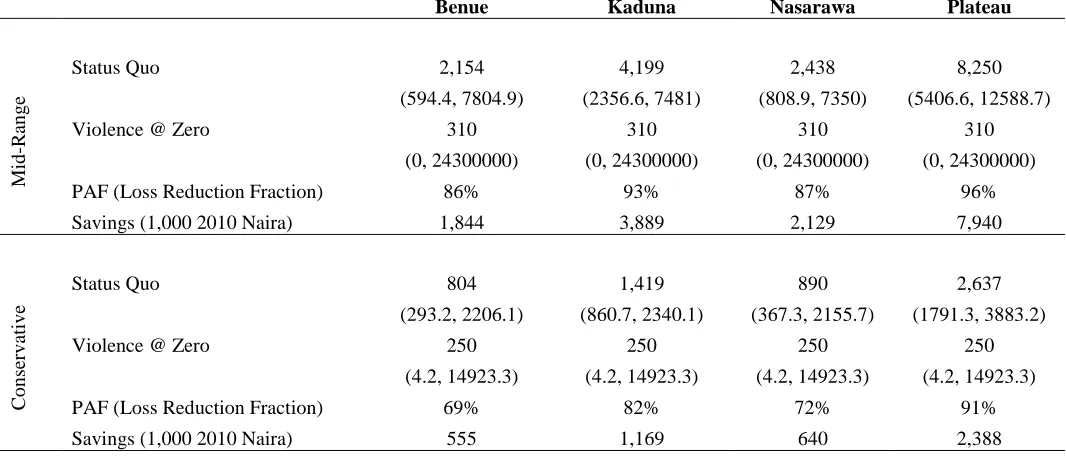
Table 8. Population Attributable Fraction (PAF) calculations for IGR losses in the four study states. All figures in 2010 Nigerian Naira unless except percentages; 95% confidence intervals in parentheses.
Benue Kaduna Nasarawa Plateau
Mid
-R
an
g
e
Status Quo 2,154 4,199 2,438 8,250
(594.4, 7804.9) (2356.6, 7481) (808.9, 7350) (5406.6, 12588.7)
Violence @ Zero 310 310 310 310
(0, 24300000) (0, 24300000) (0, 24300000) (0, 24300000)
PAF (Loss Reduction Fraction) 86% 93% 87% 96%
Savings (1,000 2010 Naira) 1,844 3,889 2,129 7,940
C
o
n
ser
v
ativ
e
Status Quo 804 1,419 890 2,637
(293.2, 2206.1) (860.7, 2340.1) (367.3, 2155.7) (1791.3, 3883.2)
Violence @ Zero 250 250 250 250
(4.2, 14923.3) (4.2, 14923.3) (4.2, 14923.3) (4.2, 14923.3)
PAF (Loss Reduction Fraction) 69% 82% 72% 91%
21
Table 9 is a recreation of Table 4, modified by the PAFs calculated above. The last row gives the total endogeneity-adjusted IGR losses as a percentage of the figures presented in Table 4. Calculations of IGR losses taking endogeneity into account are roughly 65-75% the size of those predicted without such adjustments.
revenues in the case of Benue over the 2001-2012 period to 51-75% in the case of Plateau over that same period. In total, the four study states of Benue, Kaduna, Nasarawa, and Plateau are estimated to have lost between NGN 109 million and NGN 347 million in IGR due to the conflict – roughly $719 to $2.3 million in 2010 USD, or 22-47% of their potential IGR collection. Finally, we have argued that these synthetic control scenarios are reliable by demonstrating that they respond as we would hypothesize to the farmer-pastoralist violence – losses mount in response to killings.
We have also demonstrated that it is possible to reconstruct a hypothetical alternative history of internally generated revenue (IGR) collection at the state level in Nigeria over the period 1980-2012 – one in which conflict-affected states are assumed not to have suffered from violence. We have also demonstrated a method for dealing with the typical problems of violence-economy endogeneity attributed to such synthetic control models in cost of conflict analyses.
22
estimated to grow between 2.2 and 6 percent slower than during peace (Skaperdas et al., 2009, p. 8). Some countries experience far worse effects, as in the case of Afghanistan where per capita GDP fell at 7.5 percent annually from 1990 to 1995 (Ibid.). The figures we have calculated for total losses per state accrued over time – 11 years for Benue, 20 for Kaduna, 12 for both Nasarawa and Plateau. If we back calculate the cost of conflict as a percentage IGR reduction, we obtain (assuming a reasonable 5 percent IGR growth rate, given Nigeria’s GDP growth rate) 0 - 10.6 percent for Benue, 1.2 – 2.3 percent for Kaduna, 2.6 – 10.0 percent for Nasarawa, and 12.1 – 26.6 percent for Plateau.
23
References
Abadie, A., Diamond, A., & Hainmueller, J. (2010). Synthetic Control Methods for Comparative Case Studies: Estimating the Effect of California's Tobacco Control Program. Journal of the American Statistical
Association, 105(490), 493-505. doi: http://dx.doi.org/10.1198/jasa.2009.ap08746
Abadie, A., & Gardeazabal, J. (2003). The Economic Costs of Conflict: A Case Study. American Economic Review, 93(1), 221-240.
Chowdhury, A. R., & Murshed, S. M. (2013). A Note on War and Fiscal Capacity in Developing Countries. Peace Economics Peace Science and Public Policy, 19(3), 431-435.
Collier, P., Elliott, V. L., Hegre, H., Hoeffler, A., Reynal-Querol, M., & Sambanis, N. (2003). Breaking the Conflict Trap: Civil War and Development. Washington, DC: World Bank.
Doidge, J. C., Segal, L., & Gospodarevskaya, E. (2012). Attributable Risk Analysis Reveals Potential Healthcare Savings from Increased Consumption of Dairy Products. The Journal of Nutrition: Methodology and
Mathematical Modeling, 142, 1772–1780.
Greenland, S., & Drescher, K. (1993). Maximum Likelihood Estimation of the Attributable Fraction from Logistic Models. Biometrics, 49, 865-872.
Last, J. M. (Ed.). (2001). A Dictionary of Epidemiology (4th ed.). New York: Oxford University Press.
McDougal, T. L. H., Talia; Inks, Lisa; Ugo-Ike, Claire-Lorentz; Dowd, Caitriona; Conroy, Stone; Ogabiela, Daniel.
(2015). The Effect of Farmer-Pastoralist Violence on Income: New Survey Evidence from Nigeria’s
Middle Belt States. Economics of Peace & Security Journal, 10(1), 66-77. doi: 10.15355/epsj.10.1.66
Obiliki, N. (2014). An Examination of Subnational Growth in Nigeria: 1999 – 2012 ERSA Working Paper Series.
Claremont, South Africa: Economic Research Southern Africa (ERSA).