Full Terms & Conditions of access and use can be found at
http://www.tandfonline.com/action/journalInformation?journalCode=rmle21
Download by: [Texas A&M University Libraries] Date: 18 November 2015, At: 12:38
Managing Sport and Leisure
ISSN: 2375-0472 (Print) 2375-0480 (Online) Journal homepage: http://www.tandfonline.com/loi/rmle21
Measuring the economic impact of a state park
system
Ji Youn Jeong & John L. Crompton
To cite this article: Ji Youn Jeong & John L. Crompton (2015) Measuring the economic impact of a state park system, Managing Sport and Leisure, 20:4, 238-257, DOI: 10.1080/23750472.2015.1032996
To link to this article: http://dx.doi.org/10.1080/23750472.2015.1032996
Published online: 29 Apr 2015.
Submit your article to this journal
Article views: 43
View related articles
Measuring the economic impact of a state park
system
Ji Youn Jeong and John L. Crompton
Department of Recreation, Park and Tourism Sciences, Texas A&M University, College Station, TX, USA
A low cost approach to estimating the economic impact on local communities of a comprehensive state park system is described. The expenditures of 51,603 visitors at 29 parks were collected, extrapolated to an additional 60 parks, and used as inputs to derive estimates of economic impact on the parks’ local areas using four measures: labor income, value added, output and jobs. The poten-tial of those kinds of analyses for positively influencing elected officials’ budget decisions for parks is illustrated.
Keywords:economic impact, parks, political advocacy
INTRODUCTION
It has been observed that in the political arena, it is almost always advantageous to frame an issue in economic terms when seeking support from a legislative body
(Harnik & Crompton,2014). This is especially
important in the context of parks which sometimes are referred to as “invisible assets” (Commission for Architecture and
the Built Environment [CABE],2009). Parks
typically have difficulty in securing legisla-tive support in the budget process, because they are (i) rarely prominent as issues in pol-itical campaigns; (ii) heavily subsidized, even in cases where a charge is made; and (iii) costs are easily visible while their econ-omic value is not.
There are multiple ways in which parks strengthen a community’s economic base
(Crompton, 2007; Harnik & Crompton,
2014), but the most prominent and visible among them, especially for regional and national parks, is probably their economic impact on local communities.
The study reported here illustrates a low cost approach to obtaining a reason-able estimate of the economic impact on local communities of the 89 parks that comprise the Texas state park system. The study cost was $25,000 (£15,000). By way of comparison, many would consider this to be a reasonable cost expectation for consultants to perform an economic
impact study at a single park. The study’s
objective was to estimate the economic impact of visitors to each of the state parks on the counties in which those parks are located.
The study was commissioned by an alli-ance of conservation and park organizations and advocates who were concerned that the Texas Park and Wildlife Department (TPWD) had been underfunded for many years. It was an integral part of an effort to lobby the Texas legislature to substantially increase the agency’s parks budget.
These advocacy groups believed the dominant position, or place in the mind, that state parks occupied among officials #2015 Taylor & Francis
Vol. 20, No. 4, 238 – 257, http://dx.doi.org/10.1080/23750472.2015.1032996
and most state legislators, was that state parks were a relatively discretionary, nones-sential service which was nice to have, but in difficult economic times there were more important essential services that needed to be protected first. The intent of the study was to reposition state parks so they would be perceived as positive contributors to the State’s economy rather than as a welfare service requiring subsidy.
The study focused on developing data that would provide a foundation for the repo-sitioning effort. The challenge was to pos-ition state parks as economic engines in their host communities. The intent was to align them with other major businesses in a local community such as a manufacturing plant. If a plant retrenches its labor force or closes, it is liable to have a major negative impact on its host community. Many Texas state parks are located in rural areas which are especially vulnerable to job losses and it seems likely that the negative impact on an area’s economy of budget cuts for parks would be similar to those imposed at a
manufacturing plant. The expenditures in the area by visitors (who by definition are tourists) who come to those parks and the funds the parks receive from the state capital in Austin represent injections of new money that is important in many rural economies.
Visitors’ initial expenditures stimulate subsequent economic activity. There is a ripple effect through the community as the businesses which receive their expenditures in turn use some of them to purchase supplies and pay employees; and this process is repeated many times over.
Hence, this “multiplier effect” creates
additional business turnover, personal
income, employment, and government
revenue.
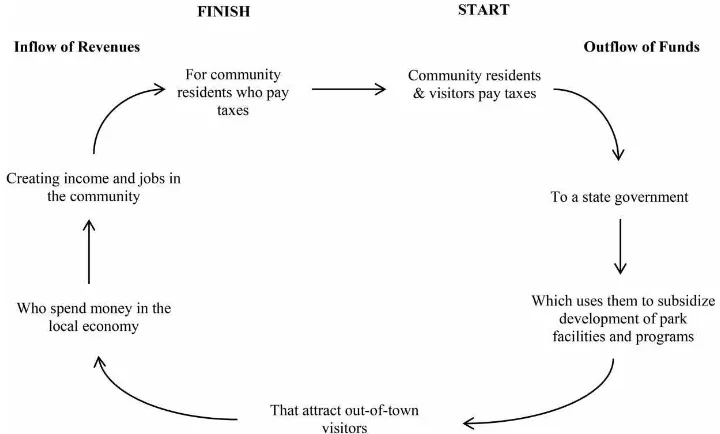
The conceptual underpinning of visitors’
economic impact is shown in Figure 1
(Crompton, 2006). It shows that residents
and visitors in a community give funds to the state government in the form of taxes. The state uses a proportion of these funds to subsidize park facilities and programs
Fig. 1. The Conceptual Rationale for Undertaking Economic Impact Studies
Measuring the economic impact of a state park system 239
that attract out-of-town visitors who spend money in the local community. This new money from outside the community creates income and jobs for residents. Community residents, aided by visitors’ bed and sales taxes, are responsible for providing the initial funds, and residents receive a return on their investment in the form of new jobs and more household income.
METHOD
The study estimated the economic impact of Texas state parks on the counties in which they are located. Data were collected by sur-veying at 29 parks. These results were then used as the basis for developing expenditure estimates at each of the other 60 facilities in the Texas state parks system. The economic impact of visitor spending is estimated by the following formula:
Number of visitor days ×average
spend-ing per visitor day×multiplier
Experience in previous studies showed that visitors to state parks had no awareness of county boundaries. Hence, visitors were defined as those survey respondents who reported they resided outside a 20 mile
radius of the park they were visiting.1
Since some visitors may have had other reasons for being in an area in addition to vis-iting the state park, they were asked to respond to the following question:
If they responded with anything other than 10 on this scale, then their spending was discounted accordingly to reflect the
proportion of it that was attributable to the park. For example, if a respondent reported the park had “0” influence on the decision to visit the area, then the expenditure would be 0. If the reported score was 6, then 60% of the spending in the area was attributed to the park.
Reasonably accurate estimates of visitor expenditures are dependent on accurate counts of visitors, since the estimates are derived by extrapolating from a sample to a total visitation count. A decade ago, TPWD invested considerable effort and resources in developing procedures tailored specifi-cally to each park that yielded accurate visi-tation numbers (Kaczynski, Crompton, &
Emerson, 2003). Since that time, they have
been periodically reviewed and refined. As a result of those efforts, TPWD has become a model on this issue for other park systems in the USA and can reasonably claim that its numbers are among the most accurate among regional, state, and national park systems in the country.
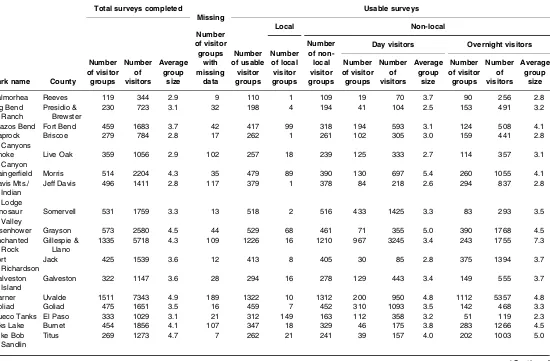
TPWD’s procedures count “visitor days”. Thus, if a party of 3 people is in a park for a part or all of 4 days, then it is recorded as 12 visitor days. The system reports separate counts for day visitors and for those who stayed at camp sites in the parks overnight. Data were collected at 29 state parks between 11 March and 27 July 2014. The number of completed and useable surveys
from each park is shown inTable 1. A total
of 13,647 individuals were interviewed on site. Since each of these respondents was Circle the number below that best represents the extent to which visiting the park was the primary purpose of your trip to this area. A 0 indicates the park had no influence and you would have come to the area anyway, while a 10 indicates that the park is your only reason for visiting the area on this trip.
0 1 2 3 4 5 6 7 8 9 10
None : I would have come to the area anyway
Half of my reason for coming to the area
My only reason for coming to the area
Table 1. Profile of Summaries Completed at Each Park
Total surveys completed
Missing
Usable surveys Local Non-local
Day visitors Overnight visitors
Park name County
Number
Brazos Bend Fort Bend 459 1683 3.7 42 417 99 318 194 593 3.1 124 508 4.1
Caprock
Daingerfield Morris 514 2204 4.3 35 479 89 390 130 697 5.4 260 1055 4.1
Davis Mts./
Somervell 531 1759 3.3 13 518 2 516 433 1425 3.3 83 293 3.5
Eisenhower Grayson 573 2580 4.5 44 529 68 461 71 355 5.0 390 1768 4.5
Enchanted Rock
Gillespie & Llano
1335 5718 4.3 109 1226 16 1210 967 3245 3.4 243 1755 7.3
Fort Richardson
Jack 425 1539 3.6 12 413 8 405 30 85 2.8 375 1394 3.7
Galveston Island
Galveston 322 1147 3.6 28 294 16 278 129 443 3.4 149 555 3.7
Garner Uvalde 1511 7343 4.9 189 1322 10 1312 200 950 4.8 1112 5357 4.8
Goliad Goliad 475 1651 3.5 16 459 7 452 310 1093 3.5 142 468 3.3
Hueco Tanks El Paso 333 1029 3.1 21 312 149 163 112 358 3.2 51 119 2.3
Inks Lake Burnet 454 1856 4.1 107 347 18 329 46 175 3.8 283 1266 4.5
Lake Bob Sandlin
Titus 269 1273 4.7 7 262 21 241 39 157 4.0 202 1003 5.0
(Continued)
Measuring
Table 1. Continued
Total surveys completed
Missing
Usable surveys Local Non-local
Day visitors Overnight visitors
Park name County
Number
San Patricio 493 2191 4.4 59 434 36 398 82 361 4.4 316 1401 4.4
Lake
LBJ Gillespie 418 1425 3.4 75 343 2 341 341 1132 3.3 N/A N/A N/A
Martin Dies Jasper 284 1096 3.9 19 265 7 258 8 54 6.8 250 945 3.8
Tyler Smith 607 2182 3.6 37 570 115 455 123 441 3.6 332 1098 3.3
WOB Washington 61 368 6.0 12 49 2 47 47 291 6.2 N/A N/A N/A
Total 13,647 51,603 3.8 1363 12,284 1154 11,130 4469 15,086 3.4 6661 26,936 4.0
Jeong
and
Crompto
n
asked to report the expenditures of all members in his/her “immediate group”, the survey data represent the expenditures of 51,603 visitors.
These 29 parks were selected because they had either a park host who resided in the park, or members of Friends of the Park group who volunteered to administer the survey instrument. Surveys were adminis-tered to convenience samples of visitors not probability samples (i.e. not random, stratified, or cluster samples), so their resentativeness is not known. However, pre-vious studies of Texas state park visitors have suggested that they are relatively homogeneous in terms of their interests and behaviors (Crompton & Tian-Cole, 2001). If they are homogeneous, then the
imperative to use probability samples
diminishes. To test for homogeneity, the samples of both day and overnight visitors at each of the nine parks in which most
responses were collected (Daingerfield,
Dinosaur Valley, Enchanted Rock, Garner, Goliad, Lake Corpus Christi, Lake Ray Roberts, Pedernales Falls, and Tyler) were split into halves and thirds based on the
date of collection. Statistical tests
(ANOVAs) were undertaken on the per person per day averages and they found sig-nificant differences in either the bisection or trisection splits in only 3 of the 18 samples (17%). Thus, it is reasonable to assume that in 83% of the cases visitors were relatively homogeneous in their expenditures and the
convenience samples are reasonably
representative.
From past experience, the study team found that the accuracy of estimates is improved if extreme “outlying” values in the samples are removed. When estimates derived from relatively small samples are extrapolated to relatively large populations, sampling “accidents” can lead to substantial misrepresentation. By the luck of the draw, a grossly unrepresentative case that is not consistent with typical spending behavior
of state park visitors can be included in a sample. To avoid this misrepresentation, the highest 1% and the lowest 1% of group per person per day values were removed from each sample.
AVERAGE SPENDING PER VISITOR DAY AT THE 29 SURVEYED PARKS
A fundamental principle of economic impact is that it is concerned only with new money entering into a community from outside its boundaries. Thus, at each park, expenditures
by those visitors residing within the host
county were excluded from the analysis. All those surveyed were asked their zip code and local residents were identified by this means.
Per person per day estimates at each park were made by dividing the expenditures reported by each group by the group’s number of visitor days. For example, if a group was composed of three people who spent a total of $135 outside the park and they were in the park for three days, then the group’s per person per day expenditure was $135/9, that is, $15 per person per day. Although data collection was limited to the March through July period, there was no reason to suspect that visitors’ expenditure patterns would be different from those in other months of the year. Hence, the average values for each sample were calcu-lated and extrapocalcu-lated to the annual visita-tion numbers for the park.
Past experiences of the study team have shown that day and overnight visitors are likely to have different expenditure patterns. Invariably, the per person per day expendi-tures outside the park of overnight visitors are lower than those of day visitors. This is because overnight visitor groups remain in the parks for a longer period of time, which translates into more visitor days and econ-omies of scale since expenditures are spread across more days. For this reason,
Measuring the economic impact of a state park system 243
expenditure values for each of the two groups were calculated separately. TPWD reports annual numbers of day visits and overnight visits separately for each park, so the samples’ values were extrapolated to their respective annual visit categories.
The first two expenditure items in the survey questionnaire requested visitors’ spending on park admission and overnight
accommodations in the park. These
amounts were excluded from the per person per day estimates, because these dollars were passed through to TPWD headquarters in Austin and did not enter the local economy. In lieu of these resources remaining in the parks, TPWD sent funds to each park for personnel, operating, and capital renovation expenses. This was new money into the local economy. Hence, it was included in the economic impact analysis.
EXTENDING THE ESTIMATES TO THE 60 STATE PARKS AT WHICH DATA WERE
NOT COLLECTED
Data collected at the 29 parks were used to develop expenditure estimates of visitor spending at each of the other 60 facilities in the Texas state park system. A two-stage process was used to do this.
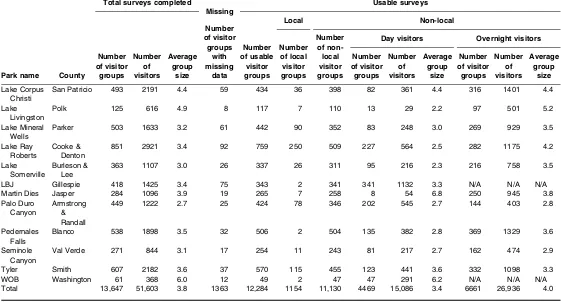
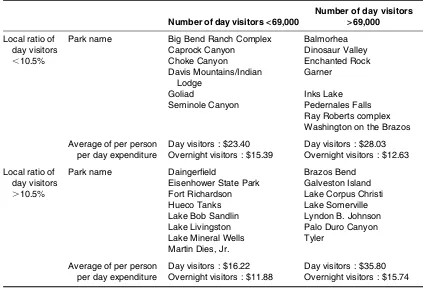
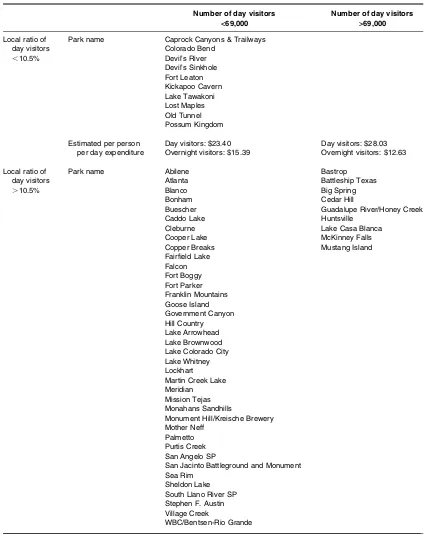
The first stage was to develop the matrix
shown inTable 2. Two criteria were used to
define the matrix. The median number of day visits among the 29 parks was 69,000, while the median proportion of local visitors to them was 10.5%. These median values defined the matrix and each of the 29 parks was assigned to one of the four cells. It was assumed that all overnight visitors were likely to be from beyond the 20 mile radius. The average per person per day among both
Table 2. Classification of 29 Parks by Ratio of Local/Non-local Visits and Number of Day Visit
Number of day visitors<69,000
Number of day visitors
>69,000
Local ratio of day visitors
,10.5%
Park name Big Bend Ranch Complex Balmorhea Caprock Canyon Dinosaur Valley Choke Canyon Enchanted Rock Davis Mountains/Indian
Lodge
Garner Goliad Inks Lake Seminole Canyon Pedernales Falls
Ray Roberts complex Washington on the Brazos Average of per person
per day expenditure
Day visitors : $23.40 Day visitors : $28.03 Overnight visitors : $15.39 Overnight visitors : $12.63 Local ratio of
day visitors
.10.5%
Park name Daingerfield Brazos Bend Eisenhower State Park Galveston Island Fort Richardson Lake Corpus Christi Hueco Tanks Lake Somerville Lake Bob Sandlin Lyndon B. Johnson Lake Livingston Palo Duro Canyon Lake Mineral Wells Tyler
Martin Dies, Jr. Average of per person
per day expenditure
Day visitors : $16.22 Day visitors : $35.80 Overnight visitors : $11.88 Overnight visitors : $15.74
day and overnight visitors across the parks in each cell was calculated. The rationale for using these two criteria was that the number of day visits was a surrogate for a park’s per-ceived quality or attraction power, while the proportion of local/non-local visitors was a surrogate for proximity to urban population centers. The research team believed that both these variables were likely to influence the amounts of visitors’ expenditures.
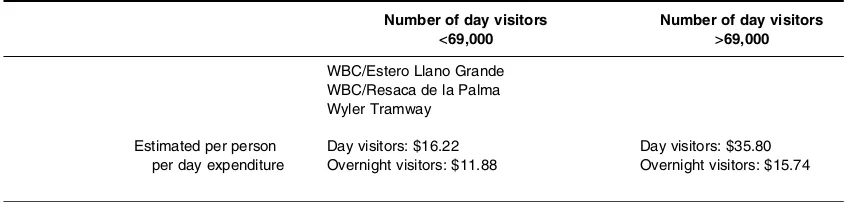
The second stage was to assign the 60 parks at which no surveying was done to one of the
four cells inTable 3. The number of day visits
at each park was provided by TPWD. The superintendents of each park were asked to estimate the proportion of day visits attribu-table to non-locals from beyond the 20 mile radius based on their experience.
TPWD numbers showed that a large majority of these parks had fewer than 69,000 annual day visits (Table 3), and the park superintendents estimated that a large majority of them attracted more than 10.5% of their visitation from the local area. The per person per day estimates used for these 60 parks were the cell averages
derived in Table 2. For example, at Caddo
Lake the average expenditures used were $16.22 and $11.88 for day and overnight visits, respectively; while at McKinney Falls $35.80 and $15.74 were adopted.
FIVE MEASURES OF ECONOMIC IMPACT
For each park, five economic impact
measures were calculated: direct expendi-tures, labor income, value added, sales, and
number of jobs created. The direct
expendi-ture data were collected in the visitor
surveys from each visitor group. After “the purpose of the trip” discount that was described earlier had been applied, the direct expenditures for day and overnight groups were totaled and extrapolated from the sample to the official day visit and over-night visit attendance at each park. Thus, the total direct expenditures estimated the
amount spent in the local economy by all non-local visitors to the park for a year.
The total direct expenditure data were then used as inputs to the IMPLAN input–output model for the county of interest to derive esti-mates of (i) labor income, (ii) value added, (iii) output, and (iv) jobs. There is frequently con-fusion and misunderstanding in interpreting
these alternate measures of economic
impact. Theoutput measureincludes all sales
in the service sector, but for the wholesale
and retail sectors it includes only gross margin, not gross sales. It is calculated as the selling price of an item, less the cost of goods sold (essentially production or acqui-sition costs). If, for example, a visitor to a park purchased a camera from a store while on a trip for $100 and the retailer purchased it from a wholesaler for $60, then the output measure would include only the $40 retailer’s markup on the camera. It has become com-monplace for tourism and economic develop-ment agencies to report economic impact in terms of gross sales generated, not gross margin. This is unfortunate because clearly the wholesale costs immediately leak out of the economy.
The most meaningful economic impact
indicators are those which measure value
addedto the community and a park’s
contri-butions to thelabor incomeof residents in a
jurisdiction. Value added is the value of
output less the value of intermediate con-sumption. That is, the difference between value of goods and cost of materials or supplies purchased from business in other sectors that are used in producing them. It estimates the value added to the county’s gross regional product. This measure elimin-ates the duplication inherent in the sales and output measures, which results from the use of products of some businesses as materials or services by others.
Thus, in the case of the camera example used to illustrate the output definition in the previous section, the $40 retailer markup margin represented in the output measure
Measuring the economic impact of a state park system 245
Table 3. Classification of 60 Parks by Ratio of Local/Non-local Visits and Number of Day Visit
Number of day visitors
<69,000
Number of day visitors
>69,000 Local ratio of
day visitors ,10.5%
Park name Caprock Canyons & Trailways Colorado Bend
Devil’s River Devil’s Sinkhole Fort Leaton Kickapoo Cavern Lake Tawakoni Lost Maples Old Tunnel Possum Kingdom
Estimated per person per day expenditure
Day visitors: $23.40 Day visitors: $28.03
Overnight visitors: $15.39 Overnight visitors: $12.63
Local ratio of day visitors .10.5%
Park name Abilene Bastrop
Atlanta Battleship Texas
Blanco Big Spring
Bonham Cedar Hill
Buescher Guadalupe River/Honey Creek
Caddo Lake Huntsville
Cleburne Lake Casa Blanca
Cooper Lake McKinney Falls
Copper Breaks Mustang Island
Fairfield Lake Falcon Fort Boggy Fort Parker Franklin Mountains Goose Island Government Canyon Hill Country Lake Arrowhead Lake Brownwood Lake Colorado City Lake Whitney Lockhart Martin Creek Lake Meridian Mission Tejas Monahans Sandhills
Monument Hill/Kreische Brewery Mother Neff
Palmetto Purtis Creek San Angelo SP
San Jacinto Battleground and Monument Sea Rim
Sheldon Lake South Llano River SP Stephen F. Austin Village Creek
WBC/Bentsen-Rio Grande
(Continued)
presumably included costs associated with operating a retail store such as packaging; fuel, gas, and electricity supply; rent; trans-portation; insurance; and repair and mainten-ance. While value-added is part of the output measure, the output includes these other costs whereas they are omitted in the value-added measure because they are duplicated, appearing in other sectors of the economy.
The conceptual rationale for measuring economic impact is to compare how much money a community’s residents invest in a tourism project with how much income they receive from it (Figure 1). Thus, the
labor income measure should be the
primary indicator of interest to policy-makers. It reports the effect of an extra unit of visitor spending on the changes that result in levels of personal income in the host community. That is, the income per dollar of direct sales that accrues to resi-dents. It includes both employee compen-sation and payroll benefits, and proprietor income. Unfortunately, because it generates a much lower number than the gross sales, output, and value-added measures, it is fre-quently omitted in reports done by consult-ants or advocates who are seeking large numbers to legitimize their position.
The common use of the inappropriate gross sales and output measures creates an ethical dilemma for those who seek to present meaningful conclusions of economic impact studies. If they do not present these measures, then a park’s impact is likely to
appear relatively insignificant when it is com-pared to the results from other public invest-ments which do not highlight them. A solution to this conundrum is to focus the report on value-added and labor income measures. The sales and output measures may also be reported for the purpose of com-parison, but their inappropriateness should be emphasized. The use of a gross sales measure is so egregiously misrepresentative that it was not included in the study, but the reasons for omitting it were stated so legis-lators were aware of its inappropriateness. The output measure was provided, but policy-makers were urged to focus on the value-added and personal income measures.
The jobs measure of economic impact
does not distinguish between full-time and part-time jobs, and neither the proportion of full- or part-time jobs is identified, nor the number of hours worked. However, the probability of full-time staff jobs being created is much higher if the impact being measured is based on revenues from facili-ties, like Texas state parks, that have a reasonably consistent flow of visitors for long periods of the year. A consistent flow makes it more economically feasible for local businesses to hire full-time staff to accommodate the demand.
CALCULATING ECONOMIC IMPACTS
The estimates of economic impact required two basic elements: (i) economic structure
Table 3. Continued
Number of day visitors
<69,000
Number of day visitors
>69,000 WBC/Estero Llano Grande
WBC/Resaca de la Palma Wyler Tramway
Estimated per person per day expenditure
Day visitors: $16.22 Overnight visitors: $11.88
Day visitors: $35.80 Overnight visitors: $15.74
Measuring the economic impact of a state park system 247
of the host county in which the park was located and (ii) visitor expenditures. The economic structure of the county, as well as the multipliers utilized, were obtained by using the IMPLAN software, which creates separate models of the economic structure of each county in Texas or, in some instances, a model for two counties if park boundaries crossed county lines.
The IMPLAN acronym is derived from IMpact analysis for PLANning. It is an input – output modeling system, developed originally by federal agencies over 20 years ago, but now privately owned, that builds its accounts with secondary data collected
from a multitude of federal government agencies. It is widely accepted in the econ-omic community and used extensively by economic development agencies in the USA. Revenues by visitors spent inside the park
were not included in the economic impact
calculations because they did not enter the local economy. All such revenues were
forwarded directly to TPWD’s Austin
headquarters.
The following steps were used to compute the economic impact of visitors to each park. Enchanted Rock State Park is used as an example (Table 4); the same format was used for all 89 state parks.
Stage 1 1335 individuals were interviewed at Enchanted Rock State Park. However, 109 of the questionnaires were incomplete and not usable; 16 of the remaining 1226 respondents resided in Gillespie or Llano Counties. Thus, 1210 respondents came from outside the local counties. Of these 967 were day visitor groups, while 243 were overnight visitors (Table 1)
Stage 2 The average per person, per day expenditures reported by the day visitor and overnight visitor groups were calculated. If their response to the 10 point question asking the extent to which visiting the park was the primary purpose of their trip to the area was less than 10, then their per person expenditures were discounted accordingly. The highest 1% and the lowest 1% of per person per day values were removed from each visitor group. After these outliers were excluded, 947 day visitor groups and 239 overnight visitor groups were analyzed. This process revealed that the average per person per day expenditure of day and overnight visitors at Enchanted Rock were $26.97 and $6.37, respectively
Stage 3 The per person, per day amounts were multiplied by 225,208 and 22,121 to estimate total direct expenditures for each of the either expenditure items by out of county day and overnight visits, respectively
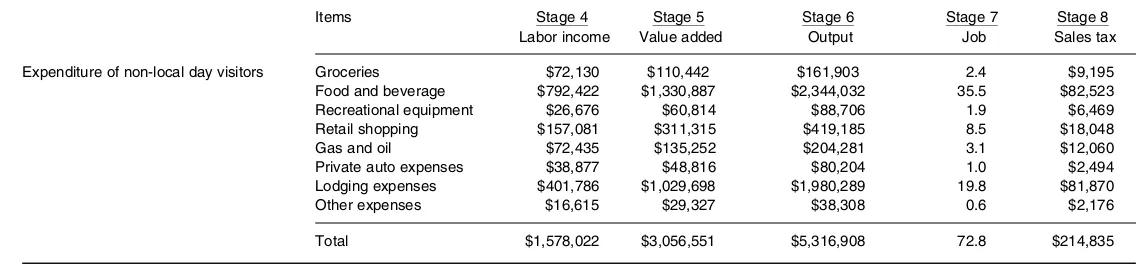
Stages 4, 5, 6, 7 and 8
The total direct expenditures in each of the eight expenditure categories were entered into the IMPLAN software to calculate the impact on Gillespie and Llano Counties of these direct expenditures on labor income (Stage 4), value added (Stage 5), output (Stage 6), jobs (Stage 7), and sales tax (Stage 8)
Stage 9 In addition to expenditures by visitors, the operating budget provided by TPWD for the park constitutes an economic impact on the two counties, because these are new dollars coming into the county from Austin. The FY 2014 budget allocation for Enchanted Rock State Park of $577,775 is shown in Stage 9
Stage 10 Finally, at the foot of each of the 89 park economic impact studies, the total economic impact on labor income, value added, output, and jobs created is reported. An estimate of the sales tax accruing to the county from expenditures associated with the park is included
Table 4. The Economic Impact of Enchanted Rock State Park on Gillespie County and Llano County
Stage 1
Totalday visitordays fy2014 237,061
Day visitors’average party size 3.4 Totalovernight visitordays fy2014 22,121
Overnight visitors’average party size 7.3 Estimated non-localday visitor days 225,208
Estimated non-localovernight visitor days 22,121
Stage 2 Stage 3
Per person per day expenditures of non-local visitors within county Annual expenditures of non-local vistors within county
Items Day visitors Overnight visitors Items Day visitors Overnight visitors
Groceries $1.84 $1.61 Groceries $414,383 $35,615
Food & beverage $7.81 $1.14 Food and beverage $1,758,874 $25,218
Recreational equipment $0.76 $0.73 Recreational equipment $171,158 $16,148
Retail shopping $3.22 $0.38 Retail shopping $725,170 $8,406
Gas and oil $6.13 $1.67 Gas and oil $1,380,525 $36,942
Private auto expenses $0.26 $0.08 Private auto expenses $58,554 $1,770
Lodging expenses $6.50 $0.56 Lodging expenses $1,463,852 $12,388
Other expenses $0.47 $0.20 Other expenses $105,848 $4,424
Total $26.97 $6.37 Total $6,073,860 $140,911
Economic impacts of non-localday visitorsandovernight visitorswithin county
Items Stage 4
Labor income
Stage 5 Value added
Stage 6 Output
Stage 7 Job
Stage 8 Sales tax
Expenditure of non-local day visitors Groceries $72,130 $110,442 $161,903 2.4 $9,195
Food and beverage $792,422 $1,330,887 $2,344,032 35.5 $82,523
Recreational equipment $26,676 $60,814 $88,706 1.9 $6,469
Retail shopping $157,081 $311,315 $419,185 8.5 $18,048
Gas and oil $72,435 $135,252 $204,281 3.1 $12,060
Private auto expenses $38,877 $48,816 $80,204 1.0 $2,494
Lodging expenses $401,786 $1,029,698 $1,980,289 19.8 $81,870
Other expenses $16,615 $29,327 $38,308 0.6 $2,176
Total $1,578,022 $3,056,551 $5,316,908 72.8 $214,835
(Continued)
Measuring
the
eco
nomic
impact
of
a
state
park
system
249
Expenditure of non-local overnight visitors Groceries $6,199 $9,492 $13,915 0.2 $790
Food and beverage $11,361 $19,082 $33,608 0.5 $1,183
Recreational equipment $2,517 $5,738 $8,369 0.2 $610
Retail shopping $157,081 $311,315 $419,185 8.5 $18,048
Gas and oil $1,938 $3,619 $5,466 0.1 $323
Private auto expenses $1,175 $1,476 $2,424 0.0 $75
Lodging expenses $3,400 $8,714 $16,758 0.2 $693
Other expenses $694 $1,226 $1,601 0.0 $91
Total $184,365 $360,662 $501,326 9.7 $21,813
Stage 9
Economic impacts of a park budget spending within county
Items Labor income Value added Output Job Sales tax
Park budget Total ($577,755) $232,696 $460,378 $761,151 6.3 $7,597
Stage 10
Summary of state park’s impacts on county
Items Labor income Value added Output Job Sales tax
Grand total Enchanted rock state park $1,995,083 $3,877,591 $6,579,385 88.8 $244,245
Table 4.Continued
Jeong
and
Crompto
n
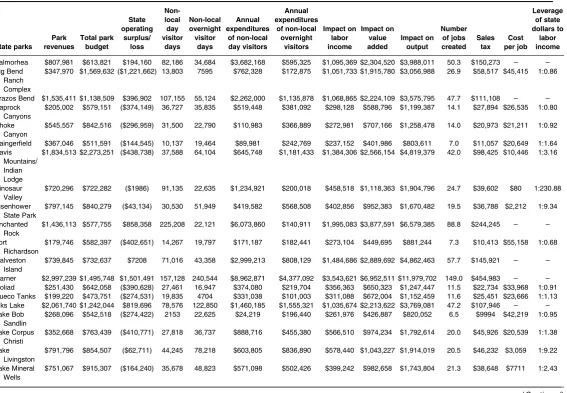
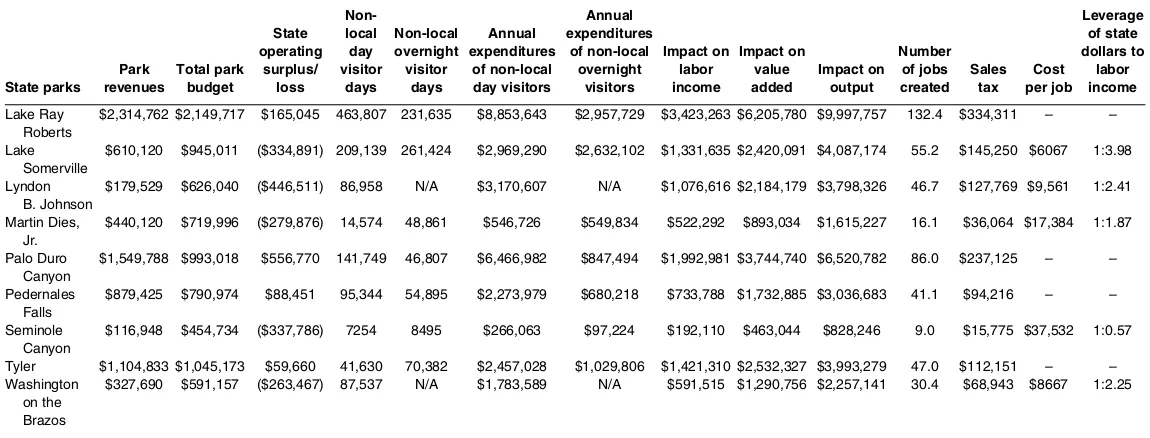
Table 5. Summary of Findings for 29 State Parks (Fiscal Year 2014)
Balmorhea $807,981 $613,821 $194,160 82,186 34,684 $3,682,168 $595,325 $1,095,369 $2,304,520 $3,988,011 50.3 $150,273 – – Big Bend
Ranch Complex
$347,970 $1,569,632 ($1,221,662) 13,803 7595 $762,328 $172,875 $1,051,733 $1,915,780 $3,056,988 26.9 $58,517 $45,415 1:0.86
Brazos Bend $1,535,411 $1,138,509 $396,902 107,155 55,124 $2,262,000 $1,135,878 $1,068,865 $2,224,109 $3,575,795 47.7 $111,108 – – Caprock
Canyons
$205,002 $579,151 ($374,149) 36,727 35,835 $519,448 $381,092 $298,128 $588,796 $1,199,387 14.1 $27,894 $26,535 1:0.80
Choke Canyon
$545,557 $842,516 ($296,959) 31,500 22,790 $110,983 $366,889 $272,981 $707,166 $1,258,478 14.0 $20,973 $21,211 1:0.92
Daingerfield $367,046 $511,591 ($144,545) 10,137 19,464 $89,981 $242,769 $237,152 $401,986 $803,611 7.0 $11,057 $20,649 1:1.64 Davis
Mountains/ Indian Lodge
$1,834,513 $2,273,251 ($438,738) 37,588 64,104 $645,748 $1,181,433 $1,384,306 $2,566,154 $4,819,379 42.0 $98,425 $10,446 1:3.16
Dinosaur Valley
$720,296 $722,282 ($1986) 91,135 22,635 $1,234,921 $200,018 $458,518 $1,118,363 $1,904,796 24.7 $39,602 $80 1:230.88
Eisenhower State Park
$797,145 $840,279 ($43,134) 30,530 51,949 $419,582 $568,508 $402,856 $952,383 $1,670,482 19.5 $36,788 $2,212 1:9.34
Enchanted Rock
$1,436,113 $577,755 $858,358 225,208 22,121 $6,073,860 $140,911 $1,995,083 $3,877,591 $6,579,385 88.8 $244,245 – –
Fort Richardson
$179,746 $582,397 ($402,651) 14,267 19,797 $171,187 $182,441 $273,104 $449,695 $881,244 7.3 $10,413 $55,158 1:0.68
Galveston Island
$739,845 $732,637 $7208 71,016 43,358 $2,999,213 $808,129 $1,484,686 $2,889,692 $4,862,463 57.7 $145,921 – –
Garner $2,997,239 $1,495,748 $1,501,491 157,128 240,544 $8,962,871 $4,377,092 $3,543,621 $6,952,511 $11,979,702 149.0 $454,983 – – Goliad $251,430 $642,058 ($390,628) 27,461 16,947 $374,080 $219,704 $356,363 $650,323 $1,247,447 11.5 $22,734 $33,968 1:0.91 Hueco Tanks $199,220 $473,751 ($274,531) 19,835 4704 $331,038 $101,003 $311,088 $672,004 $1,152,459 11.6 $25,451 $23,666 1:1.13 Inks Lake $2,061,740 $1,242,044 $819,696 78,576 122,850 $1,460,185 $1,555,321 $1,035,674 $2,213,622 $3,769,081 47.2 $107,946 – – Lake Bob
Sandlin
$268,096 $542,518 ($274,422) 2153 22,625 $24,219 $196,440 $261,976 $426,887 $820,052 6.5 $9994 $42,219 1:0.95
Lake Corpus Christi
$352,668 $763,439 ($410,771) 27,818 36,737 $888,716 $455,380 $566,510 $974,234 $1,792,614 20.0 $45,926 $20,539 1:1.38
Lake Livingston
$791,796 $854,507 ($62,711) 44,245 78,218 $603,805 $836,890 $578,440 $1,043,227 $1,914,019 20.5 $46,232 $3,059 1:9.22
Lake Mineral Wells
$751,067 $915,307 ($164,240) 35,678 48,823 $571,098 $502,426 $399,242 $982,658 $1,743,804 21.3 $38,648 $7711 1:2.43
(Continued)
Measuring
Table 5. Continued
State parks
Park revenues
Total park budget
State operating
surplus/ loss
Non-local day visitor
days
Non-local overnight visitor
days
Annual expenditures
of non-local day visitors
Annual expenditures
of non-local overnight
visitors
Impact on labor income
Impact on value added
Impact on output
Number of jobs created
Sales tax
Cost per job
Leverage of state dollars to
labor income
Lake Ray Roberts
$2,314,762 $2,149,717 $165,045 463,807 231,635 $8,853,643 $2,957,729 $3,423,263 $6,205,780 $9,997,757 132.4 $334,311 – –
Lake Somerville
$610,120 $945,011 ($334,891) 209,139 261,424 $2,969,290 $2,632,102 $1,331,635 $2,420,091 $4,087,174 55.2 $145,250 $6067 1:3.98
Lyndon B. Johnson
$179,529 $626,040 ($446,511) 86,958 N/A $3,170,607 N/A $1,076,616 $2,184,179 $3,798,326 46.7 $127,769 $9,561 1:2.41
Martin Dies, Jr.
$440,120 $719,996 ($279,876) 14,574 48,861 $546,726 $549,834 $522,292 $893,034 $1,615,227 16.1 $36,064 $17,384 1:1.87
Palo Duro Canyon
$1,549,788 $993,018 $556,770 141,749 46,807 $6,466,982 $847,494 $1,992,981 $3,744,740 $6,520,782 86.0 $237,125 – –
Pedernales Falls
$879,425 $790,974 $88,451 95,344 54,895 $2,273,979 $680,218 $733,788 $1,732,885 $3,036,683 41.1 $94,216 – –
Seminole Canyon
$116,948 $454,734 ($337,786) 7254 8495 $266,063 $97,224 $192,110 $463,044 $828,246 9.0 $15,775 $37,532 1:0.57
Tyler $1,104,833 $1,045,173 $59,660 41,630 70,382 $2,457,028 $1,029,806 $1,421,310 $2,532,327 $3,993,279 47.0 $112,151 – – Washington
on the Brazos
$327,690 $591,157 ($263,467) 87,537 N/A $1,783,589 N/A $591,515 $1,290,756 $2,257,141 30.4 $68,943 $8667 1:2.25
Jeong
and
Crompto
n
Table 6. Summary of Findings for 60 State Parks (Fiscal Year 2014)
Abilene $354,810 $674,894 ($320,084) 4128 27,545 $66,956 $327,235 $332,707 $707,863 $123,8681 13.9 $19,082 $23,028 1:1.04 Atlanta $108,622 $257,079 ($148,457) 2259 13,992 $36,641 $166,225 $129,650 $234,910 $451,116 3.9 $7704 $38,066 1:0.87 Bastrop $738,129 $1,030,008 ($291,879) 49,101 49,695 $1,757,816 $782,199 $893,269 $1,679,242 $3,061,673 35.6 $88,791 $8199 1:3.06 Battleship
Texas
$1,085,007 $1,018,964 $66,043 64,544 189,604 $2,310,675 $2,984,367 $2,270,252 $3,707,296 $5,569,888 56.9 $154,100 – –
Big Spring $900 $98,586 ($97,686) 21,356 N/A $764,545 N/A $201,000 $403,629 $670,426 8.8 $24,269 $11,101 1:2.06 Blanco $374,999 $452,540 ($77,541) 23,107 31,758 $374,796 $377,285 $280,636 $679,311 $1,174,652 13.8 $30,878 $5,619 1:3.62 Bonham $137,857 $289,574 ($151,717) 3334 39,923 $54,077 $474,285 $201,607 $362,964 $672,369 7.2 $17,374 $21,072 1:1.33 Buescher $245,770 $399,349 ($153,579) 13,112 26,314 $212,677 $312,610 $289,082 $528,126 $985,953 9.7 $18,333 $15,833 1:1.88 Caddo Lake $408,340 $545,752 ($137,412) 23,746 28,578 $385,160 $339,507 $271,451 $616,789 $1,065,354 12.3 $23,567 $11,172 1:1.98 Caprock
Canyons & Trailways
$205,002 $579,151 ($374,149) 19,574 52,746 $457,953 $811,708 $515,468 $1,033,281 $1,947,325 22.6 $55,500 $16,555 1:1.38
Cedar Hill $1,814,151 $1,706,997 $107,154 40,029 76,277 $1,433,038 $1,200,600 $1,956,314 $3,177,938 $4,715,674 41.7 $90,407 – – Cleburne $349,781 $483,724 ($133,943) 5556 32,947 $90,118 $391,410 $306,413 $534,457 $981,554 9.0 $18,658 $14,883 1:2.29 Colorado Bend $218,730 $410,829 ($192,099) 12,837 31,734 $300,386 $488,386 $319,429 $590,250 $1,108,412 11.7 $29,349 $16,419 1:1.66 Cooper Lake $570,631 $1,233,988 ($663,357) 3795 44,380 $61,555 $527,234 $750,033 $1,349,704 $2,554,129 21.3 $28,723 $31,144 1:1.13 Copper Breaks $59,319 $294,026 ($234,707) 742 9987 $12,035 $118,646 $128,099 $231,271 $456,141 3.8 $6736 $61,765 1:0.55 Devil’s River $21,084 $389,651 ($368,567) 551 1102 $12,893 $16,960 $101,349 $281,595 $517,351 5.2 $5599 $70,878 1:0.27 Devil’s Sinkhole – $8,336 ($8,336) 1639 N/A $38,353 N/A $12,807 $23,786 $44,089 0.5 $1660 $16,672 1:1.54 Fairfield Lake $237,117 $470,164 ($233,047) 15,461 21,951 $250,777 $260,778 $236,238 $548,424 $922,908 10.3 $21,071 $22,626 1:1.01 Falcon $285,950 $405,406 ($119,456) 47,005 26,868 $762,421 $319,192 $335,633 $638,533 $1,156,467 13.8 $34,920 $8,656 1:2.81 Fort Boggy $1450 $99,215 ($97,765) 1090 N/A $17,680 N/A $39,057 $66,277 $134,563 1.0 $1179 $97,765 1:0.40 Fort Leaton $19,496 $284,766 ($265,270) 3594 N/A $84,085 N/A $157,892 $274,482 $426,090 3.6 $6179 $73,686 1:0.60 Fort Parker $194,519 $453,378 ($258,859) 6952 21,101 $112,761 $250,680 $232,232 $405,408 $790,742 7.0 $13,086 $36,980 1:0.90 Franklin
Mountains
$140,328 $488,587 ($348,259) 6089 1108 $98,764 $13,163 $238,384 $518,852 $868,050 8.4 $14,579 $41,459 1:0.68
Goose Island $720,533 $787,265 ($66,732) 52,582 91,860 $852,880 $1,091,297 $563,059 $1,309,592 $2,214,757 28.1 $67,259 $2375 1:8.44 Government
Canyon
$271,735 $619,340 ($347,605) 5046 12,105 $81,846 $143,807 $384,558 $749,241 $1,209,477 10.9 $18,857 $31,890 1:1.11
Guadalupe River/Honey Creek
$863,780 $886,557 ($22,777) 79,053 43,004 $2,830,097 $676,883 $1,268,347 $2,298,378 $3,696,253 45.1 $118,396 $505 1:55.69
Hill Country $138,037 $402,467 ($264,430) 6129 8286 $99,412 $98,438 $173,302 $363,682 $655,939 7.0 $12,744 $37,776 1:0.66 Huntsville $1,410,723 $1,022,898 $387,825 99,620 84,045 $3,566,396 $1,322,868 $1,274,768 $2,729,248 $4,541,345 60.5 $161,897 – – Kickapoo
Cavern
$16,020 $226,397 ($210,377) 1158 2597 $27,097 $39,965 $86,339 $168,221 $345,404 2.8 $5267 $75,135 1:0.41
Lake Arrowhead $130,188 $462,591 ($332,403) 4267 14,572 $69,211 $173,115 $210,150 $355,070 $703,729 5.9 $8482 $56,339 1:0.63
(Continued)
Measuring
State parks
$436,989 $848,712 ($411,723) 10,493 37,280 $170,196 $442,886 $508,167 $891,023 $1,671,496 14.8 $28,248 $27,819 1:1.23
Lake Casa Blanca
$766,819 $806,507 ($39,688) 17,539 18,096 $627,896 $284,831 $387,743 $993,500 $1,795,980 21.3 $39,358 $1863 1:9.77
Lake Colorado City
$66,501 $315,559 ($249,058) 1008 4106 $16,350 $48,779 $140,600 $222,142 $423,886 3.0 $3960 $83,019 1:0.56
Lake Tawakoni $405,604 $427,147 ($21,543) 33,625 34,588 $786,690 $517,455 $376,971 $945,505 $1,717,993 19.1 $38,743 $1128 1:17.50 Lake Whitney $455,267 $558,864 ($103,597) 17,103 44,926 $277,411 $533,721 $352,307 $640,779 $1,192,982 12.2 $27,890 $8,492 1:3.40 Lockhart $277,992 $537,248 ($259,256) 4428 15,470 $71,822 $183,784 $260,969 $438,626 $856,084 6.9 $10,920 $37,573 1:1.01 Lost Maples $527,262 $428,185 $99,077 49222 30,124 $1,151,597 $463,578 $623,104 $1,111,962 $1,925,374 23.4 $65,003 – – -Martin Creek
Lake
$260,017 $510,482 ($250,465) 8677 28,770 $140,741 $341,788 $307,237 $551,160 $1,027,113 10.2 $22,017 $24,555 1:1.23
McKinney Falls $1,138,309 $692,919 $445,390 23,689 61,744 $848,066 $971,851 $555,621 $883,146 $1,316,356 16.1 $46,829 – – Meridian $167,579 $353,081 ($185,502) 9174 15,273 $148,802 $181,443 $177,495 $389,000 $655,845 7.3 $15,477 $25,411 1:0.96 Mission Tejas $56,834 $266,575 ($209,741) 2956 7411 $47,946 $88,043 $120,902 $250,151 $423,388 4.1 $6659 $51,156 1:0.58 Monahans
Sandhills
$143,350 $252,847 ($109,497) 12,401 12,531 $201,144 $148,868 $161,662 $292,314 $532,560 5.0 $11,211 $21,899 1: 1.48
Monument Hill/ Kreische Brewery
$1119 $222,577 ($221,458) 13,269 N/A $215,223 N/A $50,308 $159,647 $304,389 3.2 $3837 $69,206 1:0.23
Mother Neff $60,629 $240,021 ($179,392) 3984 5613 $64,620 $66,682 $121,055 $216,377 $404,552 3.4 $6820 $52,762 1:0.67 Mustang Island $756,412 $657,400 $99,012 17,932 57,244 $641,966 $901,021 $651,946 $1,285,094 $2,134,014 24.5 $54,378 – – Old Tunnel $18,498 $64,178 ($45,680) 34,593 8415 $809,337 $129,498 $253,047 $491,997 $846,583 11.2 $33,258 $4079 1:5.54 Palmetto $238,660 $504,392 ($265,732) 19,244 51,926 $312,138 $616,881 $368,519 $662,509 $1,210,107 12.7 $29,493 $20,924 1:1.39 Possum
Kingdom
$279,499 $649,656 ($370,157) 6410 28,347 $149,968 $436,232 $378,162 $674,349 $1,272,250 11.8 $25,124 $31,369 1:1.02
Purtis Creek $329,652 $501,685 ($172,033) 19,637 28,649 $318,512 $340,350 $316,233 $569,213 $1,065,017 10.7 $23,445 $16,078 1:1.84 San Angelo SP $311,467 $422,865 ($111,398) 6133 27,225 $99,477 $323,433 $200,230 $476,263 $840,830 9.2 $17,240 $12,108 1:1.80 San Jacinto
Battle-ground and Monument
– $1,250,507 ($1,250,507) N/A N/A N/A N/A $732,217 $1,311,822 $2,010,843 15.0 $22,658 $83,367 1:0.59
Sea Rim $34,302 $405,208 ($370,906) 11,194 34,762 $181,567 $412,973 $285,777 $545,761 $897,366 9.6 $19,129 $38,636 1:0.77 Sheldon Lake – $375,453 ($375,453) 2116 49,517 $34,322 $588,262 $389,118 $658,719 $995,256 9.2 $21,078 $40,810 1:1.04 South Llano
River SP
$334,331 $405,518 ($71,187) 13,848 38,972 $224,615 $462,987 $244,433 $559,878 $950,456 11.7 $26,057 $6,084 1:3.43
Stephen F. Austin
$442,948 $548,916 ($105,968) 16,826 42,341 $272,918 $503,011 $355,132 $602,516 $1,111,927 11.3 $22,829 $9,378 1:3.35
Village Creek $119,302 $335,146 ($215,844) 1822 15,784 $29,553 $187,514 $225,819 $355,802 $526,273 4.8 $9200 $44,967 1:1.05
WBC/Bentsen-Rio Grande
$136,291 $706,454 ($570,163) 20,167 302 $42,464 $3588 $325,621 $666,851 $1,089,801 9.5 $14,188 $60,017 1:0.57
254
Jeong
and
Crompto
n
A summary of the findings for the 29 state parks at which data were collected is shown in Table 5. The same process was used in
extrapolations to the other 60 state
parks, and these findings are reported in Table 6
CONCLUDING COMMENTS
The data demonstrated the economic impor-tance of state parks to local communities. Most state parks reported an operating loss and required subsidies from the state budget. However, the state’s subsidy rep-resents an investment in the local commu-nities in which the parks are located that leverages a substantial return. For example, Lake Somerville state park (Table 5) reported annual revenues of $610,120, while its operat-ing costs were $945,011, so it lost $334,891. However, the park generated 55.2 jobs and over $1.3 million in income for the residents of Burleson and Lee Counties. This equates to a cost to the state of approximately $6067 per job ($334,891/55.2) and a leverage rate of 1:3.97, that is, each net state dollar invested generated almost $4 of income for local residents. It is likely that this level of return on public investment would be widely applauded if it were announced by an economic development agency in the context of a manufacturing plant or service business that the agency had assisted in locating in a community.
In some ways, state parks are analogous to retail stores. The park, like a store, is a facility, but it is only a shell. Merely providing a facil-ity is no guarantee of economic success. Economic success is dependent on what happens inside the park. If the retail store invests in attractive, popular products or ser-vices, then the store is more likely to be econ-omically successful. Similarly, the economic success of parks is reliant on investment in services and amenities inside them: struc-tures, infrastructure, concessions, special
events, trails, environmental education
centers, interpretation programs, etc. Such investments will likely lead both to more visi-tors and to higher per capita expenditures per visitor. The result of such investment will be higher revenues to the state and more jobs and income to residents in the parks’ host communities. The converse also is likely to apply. Reduced state investments will likely lead to fewer visitors and reduced revenues both to the state and to the host commu-nities. This analogy resonates with legislators. Parks traditionally have not been evalu-ated in economic terms, because advocates believe that there are many other appealing and rational justifications for acquiring and operating them. Unfortunately, when park providers have to compete for funds with other public services, these traditional justi-fications do not propel parks to a position of prominence. In the minds of elected officials and taxpayers, parks are perceived to be a discretionary service which has a much lower funding priority than primary/second-ary education, higher education, highways, health care, prisons, etc.. Thus, when government is forced to allocate budget cuts among these amenities, parks are likely to be disproportionately adversely impacted.
The only way to avoid this outcome is to change the context of the debate so parks are perceived to be a service that is essential to the material economic (as opposed to spiritual/psychological) well-being of citi-zens. This change of context is essential to reflect the pervasive, persuasive rhetoric of elected officials who say, “I am in favor of parks, but we cannot afford them in the
present difficult economic situation
because there are more pressing priorities.” If the debate parameters are changed so the discussion revolves around jobs and incomes, then there is greater likelihood that adverse budgetary impacts on parks can be ameliorated.
The challenge of park providers and advo-cates is to achieve widespread recognition of
Measuring the economic impact of a state park system 255
the economic contributions of parks and to measure them, so they are adequately rep-resented in the planning, social, and political calculus of budgetary decisions. In Texas, recognition of the centrality of parks to tourism was a key to creating momentum for initially establishing a state parks system in the 1920s and 1930s. In recent decades, park providers and advocates dis-regarded this economic rationale. The
econ-omic case for parks was similarly
prominent in creating momentum for the US National Parks system in its formative years, and played a role in many other state park systems. These original rationales for parks remain potent if they are prominent in legislative budget discussions.
This paper has demonstrated how to gen-erate data at a relatively low cost to support the economic case for repositioning parks as economic engines in host communities by using volunteers to collect the data, simple procedures for assessing its likely represen-tativeness, and a method for generalizing the data to parks at which none were collected.
It is recognized that IMPLAN is a resource unique to the USA, so the development of output, value added, labor income, and jobs measures may not be feasible in other contexts. This does not detract from the utility of the approach described here. Indeed, the potential abuse of output measures led to the following recommen-dation, “Given the complexities associated with multipliers, the wisest course of action for park and recreation professionals is to focus their efforts on obtaining a good
estimate of visitor spending and not
attempt to use multipliers”(Crompton,2010,
p. 37).
The report provides a “selling” document with evidence for advocates to use to lobby legislators, and to make presentations to influential groups and the media in their local communities. However, two points
should be stressed. First, it is of paramount importance that data are collected and
ana-lyzed with integrity. Economic impact
studies are notorious for creating hyperbolic numbers created by false assumptions. If faulty analyses are suspected, then the
whole lobbying effort is undermined.
Second, legislators turn over, so there is an ongoing challenge to repeatedly establish this revised economic engine position with new legislators. Repositioning is a difficult task because it involves shifting widely held, long-established attitudes towards parks. Hence, it is likely to take many years of persistent reiteration of the economic engine role of parks before it becomes widely accepted again as conventional wisdom.
DISCLOSURE STATEMENT
No potential conflict of interest was reported by the authors.
NOTE
1. A copy of the survey can be obtained by email-ing [email protected].
REFERENCES
Commission for Architecture and the Built Environment. (2009). Making the invisible visible: The real value of park assets. London: CABE.
Crompton, J. L. (2006). Economic impact studies: Instruments for political shenanigans? Journal of Travel Research,45(1), 67 –82. Crompton, J. L. (2007). Community benefits and
repositioning: The keys to park and recreation’s future viability. Ashburn, VA: National Recrea-tion and Park AssociaRecrea-tion.
Crompton, J. L. (2010). Measuring the economic impact of park and recreation services. Ashburn, VA: National Recreation and Park Association.
Crompton, J. L., & Tian-Cole, S. (2001). An analysis of thirteen tourism surveys: Are three waves of data collection necessary? Journal of Travel Research,39(4), 356 –368.
Harnik, P., & Crompton, J. L. (2014). Measuring the total economic value of a park system
to a community. Managing Leisure, 19(3), 188–211.
Kaczynski, A. T., Crompton, J. L., & Emerson, J. E. (2003). A procedure for improving the accuracy of visitor counts at state parks.Journal of Park and Recreation Administration,21(3), 140–151.
Measuring the economic impact of a state park system 257