Design Methodology Internal Sub State Observer Using CPLD
Joydeb RoyChoudhury1,Tribeni Prasad Banerjee1 Embedded System Lab, CMERI (CSIR)
Durgapur-713209, West Bengal, India. e-mail: [email protected], [email protected]
Aniket Nathvani2, Rangeen Basu Roy Chowdhury2, Dr. A. K Bhattacharya2
NIT, Durgapur
Durgapur-713209, West Bengal, Indi. e-mail:[email protected]
Abstract—The main objective of the current paper is to design and validate a sub sate observer which can communicate the health status of the stitching needle to the stitch controller in right time without any false alert signal using Microcontroller and CPLD interfacing. This has been achieved through a design methodology of a fault aware controller which can interact with a stitch controller [8] for automatic decorative cricket ball stitching machine. The reason behind this is it cannot recognize a ‘degraded state’- in proper time before turned in to a bad state. Thus it necessary to convert it to a grey scale with proper truth value. In order to impose this aspect - health is estimated by its ‘duration of work’ - which measured and associated with a degraded state in terms of a specific time duration. The novelty of the paper is that to overcome the Microcontroller based [8] high speed state estimation and observer design by this CPLD.
Keywords-Substate observer; CPLD; Microcontroller Interfacing ;Automated Controller
I. INTRODUCTION
We propose a design methodology of the ‘internal State Observer’ - using a generic probabilistic model of a working system during its lifetime of operation[1]. Using this probability distribution a suitable algorithm is developed with a Complex programmable logic device (CPLD) based hardware and. finally integrated with a micro-controller based real time stitch controller. Through observing and analyzing the internal sub-states in terms of time duration makes the system more fault aware. If we consider an observer as a sequence of instructions programmed in a chip then there are two approaches can be considered for an observer design- a finite state machine based observer or a stored program based observer depending on the latency period. In case of a FSM based observer a dedicated logic implements an event sequence required for observation in real time whereas in a stored program based observer, data stored in memory specifies the corresponding event sequences in terms program required to perform observation task. One important difference between these two observers lies in their limitation of observation latency period. If we consider a particular task associated with the term ‘observation’, which again can be further granulated into a set of executable program, then FSM usually takes fewer clock cycles compared to a stored program machine for executing the same set of event sequences or tasks. Hence depending on the nature of latency period of the observer
these two fundamental concepts can be implemented separately or can be integrated for state and sub state observation of a system.
II. DESIGN PRINCIPLE OF THE STATE ESTIMATION SWITCHING SYSTEM BASED STATE OBSERVER
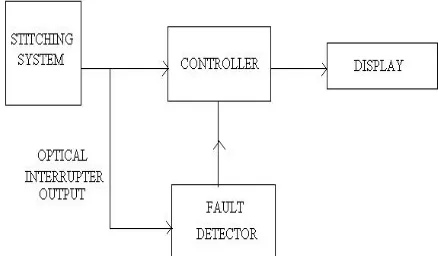
The basic principle is to observe the needle position through an optical interrupter, which tracks the up down timing of the needle movement [8]. In order to pre-detect the possibility of a needle fault (before breakage due to aging), it is necessary to estimate the internal state of the needle and communicate the same to the controlling unit before breakage i.e in proper time, in which case it can ensure necessary precautionary measures for the overall system to avoid any off specification behavior. The overall stitching system, with the sub - state observer, can be represented by a block diagram fig1. The stitching system consists of an optical interrupter which monitors the movement of the needle as it makes stitches across the circular periphery of a hemispherical leather cap of a cricket ball. After one stitch, the controller generates a signal to turn the motor by an angular distance (measured from the predefined number of stitches required) for performing the next stitch. For one complete up down movement of the needle, the counter is incremented once and this continues till the completion of required number of stitches. Thus the embedded processor, which is engaged in observing the stitch count (macro state) and controlling the process, is unable to observe the needle movement duration and differentiate between the time taken by a sharp needle from a blunt one, which takes more time to stitch the same quality of leather fitted along a hemispherical cup.
III. DESCRIPTION OF THE STATE MODEL OF THE CONDITION MONITORING
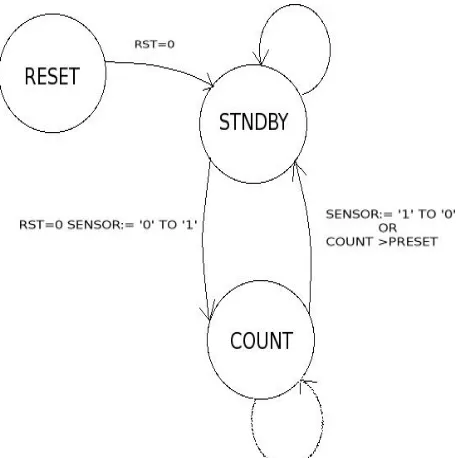
In order to understand the overall system we develop a model of the system reflecting all the possible states including the degraded state i.e. when the quality of its operation deteriorates with time [1]. This model will be used to observe the states of the system. The primary theory is that for any system, the efficiency of operation decreases when it becomes fatigued, and continuous operation in a fatigued condition ultimately leads to failure. Thus in it's transition from normal operation to failed state, the system passes through another sub state known as the 'Degraded State'. The healthy to failed state transition commences with oscillation between normal and degraded state which remains unobserved by the main stitch controller. It has been observed that initially the oscillation is less and it spends more time in the normal state. But as time passes, the system remains in the degraded state for a longer amount of time than in the normal state. This occurs as a result of fatigue accumulation and indicates possibility of a fault in the near future. Once the breaking limit is reached, the system snaps and enters failed state. The above condition is described through a model figure.2.
Apparently the two states, namely normal sub-state and degraded sub-sub-state, are 'Equivalent States'. So it is extremely difficult to distinguish between them by just looking at the input and output signals. On the other hand, the failed state gives a type of output which is totally different from the degraded and normal states. This output can be distinguished easily through a comparator, but it is of no use since the system has already failed. The primary objective of the observer is to distinguish between the normal sub-state and the degraded sub-state clearly and process this information, which will help estimate the level of degradation and the possibility of fault. Once it is rightly estimated without any ambiguity then it will generate an alert signal for the main controller.
IV. DESIGN METHODOLOGY OF THE INTELLIGENT STATE ESTIMATOR
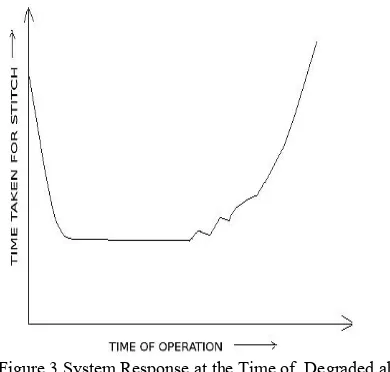
The design of a sub state observer starts from a generic curve figure 3 which describes the operation of any degradable system. Generally it has been observed that the system initially starts with degraded operation due to inertia of the various working components and stabilizes rapidly. As time passes, the system continues to operate normally for a long time after which it starts deteriorating. Under this condition the system passes through a transition region where it oscillates between normal and degraded operation that is reflected in the stitch duration (figure. 3). The extent of normal duration of operation may vary from component to component but the general shape of the curve remains the same. It only gets stretched in time axis.
Considering the above feature the next important concern is how to detect a degraded state i.e. how to differentiate between the two equivalent states namely normal and degraded. This cannot be done directly. Rather, an indirect method has to applied. This is where Timed Automata comes in [4].The easiest way is to measure the duration of stitch and compare it with a threshold value. Time is a continuous quantity and so, to use it in discreet logic, it needs to be discretized by sampling. Higher the sampling frequency, lesser the quantization error and higher the accuracy. So, basically the stitch is being qualified by quantifying the stitching time duration from duration modeling. This can be explained by Timed Safety Automata [2],which is a modified version of Timed Automata (also called timed Buchi Automata), and can be easily achieved through a high frequency hardware counter implemented using CPLD or FPGA. Finally the processed output has to be communicated to the main stitch controller.
The condition of the needle at any instant can be estimated from the ratio of the number of degraded states (in terms of stitch duration) to the number of normal states(in terms of stitch duration) appearing per unit time. If we
Figure 2. State Model of Degradable Condition
denote the unit time duration as ∆t then the condition of the needle at time t is:
Condition (t) α degraded states ∆t / normal states ∆t . So a new parameter has been introduced here which reflects this ratio. The parameter called the degradation factor represents the relative number of degraded states per unit time with respect to the number of normal states. This parameter can be determined from experiment. Another parameter called the degradation number, which is a more comprehensible depiction of degradation factor, can be generated using a simple algorithm and it tracks the probability of failure curve. The is the main parameter for implementation of the state observer logic. An algorithm needs to be developed that can process the input from the optical interrupter and generate the degradation number.
Though delay can effectively eliminate noise, it is not suitable for real time operations. So a method of weighted counting method has been used. Weighted counting is a primitive learning mechanism having all the characteristics as described above. It is an extremely simple algorithm with minimum latency and hence is applicable to real time systems. It can eliminate noise and avoid false detection by taking into account all the previous states. Its cumulative nature makes it extremely reliable. The conclusion about the status is drawn depending all the previous states throughout the working period of the system which can provide a qualitative estimation of the internal sub state of the system.
There are four possible state transitions which need to be taken into account. These are:
1. Normal stitch after a normal stitch
2. Normal stitch after a degraded stitch
3. Degraded stitch after a normal stitch
4. Degraded stitch after a degraded stitch
We give four different weight age to the four different transitions. Let the weight ages be p, q, r, s. Next step is to replace the variables with appropriate values so that the algorithm can be realized. Taking a look at the fault probability curve (figure. 4), it becomes clear that the whole duration can be divided into three major parts. One where the curve is almost flat and the value of probability of fault is
nearly 0, second, where the probability of failure starts growing and in this region the system oscillates between normal and degraded state and third, where the curve becomes extremely steep and in this region, operation is always degraded. Curve fitting can be employed to derive the weight ages and hence design the algorithm. In order to avoid complexity, statistical reasoning has been employed. The following steps describe the derivation of the weights and the algorithm.
1. In the first part only normal stitches are being made and so the transition A i.e a sequence of normal stitches falls into this group. As the base value of the state ratio number is 0, so the weight age value for p should be ideally 0. But making it 0 would mean that if due to some abnormality there is a burst of degraded stitches after which the system resumes normal operation, the state ratio number would not be able to fall to 0. So it has to be negative and the minimum value for state ratio number has to be 0. So the negative value of p is only effective when state ratio value is greater than zero. Thus the first part of the curve can be satisfied.
2. Now coming to the second part, initially though we find a lot of oscillations, the probability of failure keeps on increasing. Transition B and C occur in this region. Hence weight age values q and r will decide the slope of the curve in this region. The two transitions can be considered equivalent but since appearance of a degraded state is harmful, so |r|>|q|. Also to allow for some sort of flexibility and using the argument in from the previous point, the weight age for transition B i.e normal after degraded, q, can be very well taken as negative and for simplicity can be made same as p.
3. In the third part, operation is completely degraded and the slope is also very high. So it may be concluded that the weight age for transition D should be the highest.
4. Using arguments 1, 2 and 3 it can be concluded that p=q< 0 < |q| < r < s.
The Pseudo code of the Algorithm is as follows: Start from a state ratio value of 0
Else if previous state was degraded Then Increment degradation count by 3
We will validate the concept through the integration of a separate CPLD based hardware with the existing stitch controlling hardware. The robustness of the algorithm can be judged by plotting its output with a sequence of input that follows the system characteristic and then comparing the plot with the probability of fault curve shown into the figure 5 and figure 6.
V. SYSTEM IMPLEMENTATION AND THE STATE MODEL
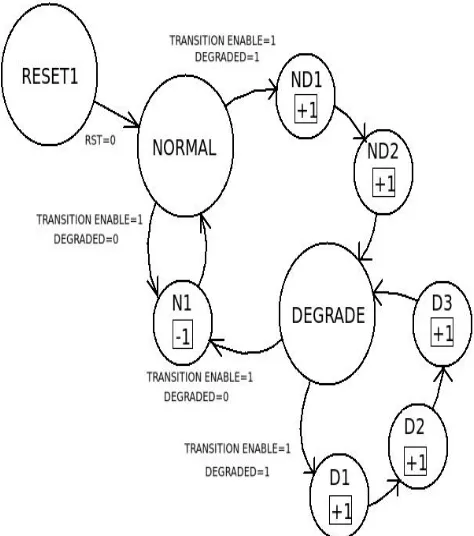
The implementation of the concept was performed on an Altera Max II CPLD [9] based board. The design part consist of two stages, one that qualifies the stitch i.e. implementation of the timed safety automata and second that takes the actual decision based on the parameter generated using the algorithm developed and generates proper alarm signal. The CPLD based implementation of the design has been named as Faultdec. The first stage uses an EFSM to implement the timed safety automata figure. 7. The threshold can be experimentally found out. The optical interrupter output was used as the trigger. The output of this stage is a signal that indicates whether the state is normal or degraded described as the count enable signal for the counter used in the first stage. The second stage implements the degradation number generation algorithm. This stage also uses an EFSM figure. 8 which has the count enable signal from the first stage as trigger. The output of this stage is the state ratio number that is used to generate the alarm by comparing it with the critical value. Synthesizable VHDL coding methods were used for implementation. Each EFSM was divided into
two sub blocks, an extended block and a FSM block. Standard VHDL code was used for the FSM block [5]. The extended block, which evaluates the trigger conditions, was written using behavioral architecture.
Figure 5. Real Time Simulated Input Curve Figure 6. Real Time Simulated Output Curve
CONCLUSION
The proposed system has a novelty in work is that the system can overcome the Microcontroller based time scheduling operation scheme using state machine model and high speed time sequential modeling scheme. The state estimation can overcome many real time scheduling problem. The design methodology of the FAULTDEC was validated by injecting a simulated fault input figure. 5 generated from a microcontroller based signal generator which can generate various stitch duration based on an algorithm which tries to simulate the health characteristic of the needle. This signal was injected to the CPLD based sub state observer for processing. The output signals were monitored using LEDs which gave desired results. The result was also plotted figure 6 and analyzed. The input curve figure 5 is a piecewise linear curve generated using pulses by the microcontroller circuit.
From the observations of the many time runs of the algorithm it was found that the alarms were generated at proper instants of time. The critical value of degradation number here is for a test case that has been used. The actual value can very easily be found out experimentally using the algorithm which proves the robustness of the algorithm.
REFERENCES
[1] Monitoring and predictive maintenance: Modeling and
analyse of fault latency -Zineb Simeu-Abazi 1, Zouhir
Bouredji -Computers in Industry 57 (2006) 504– 515,Elsavier publication.
[2] Timed Automata: Semantics, Algorithms and Tools.
Johan Bengtsson and Wang Yi. UNU-IIST. 2004.
[3] Patrcia Bouyer. Timed Automata-From Theory to
Implementation LSV- CNRS & ENS de Cachan France.
2003.
[4] Sicco Verwer, Mathijs de Weerdt, and Cees Witteveen.
Efficiently Learning Simple Timed Automata
[5] Rajeev Alur, David Dill. The Theory of Timed Automata.
Theoretical Computer Science 126:183-235, 1994 (preliminary versions appeared in Proc. 17th ICALP, LNCS 443, 1990, and Real Time: Theory in Practice, LNCS 600, 1991)
[6] Volnei A. Pedroni Circuit Design With VHDL Prentice Hall India.
[7] A. Guerrouat, H. Richter. A Formal Approach for
Analysis and Testing of Reliable Embedded Systems.
[8] US Patent 7308860 - Sewing machine for decoratively stitching a cricket ball . Inventors Singh, Hardyal Sehmby, Surinder Singh ,Mukherjee, Narayan Prasad Balamurugan, Gopalsamy, Datta Uma , Roychoudhury, Joydeb Central Mechanical Engineering research Institute Durgapur 7132 [9] Reader’s Manual, SLS ELT II toolkit.
[10] Real time systems Theory and practice ,Rajib Mall , Pearson publication.
[11] Diagnosis of discrete event system described by timed automata. Jan Lunze ,Peerasan Aupavatanakul Institute of automation control D-44780 Bochum Germany.
[12]Diagnosis of discrete event systems using timed automata Zineb Simeu Abazi,Maria Si Mascolo ,Michel Knotek Honey well Brno Aero space.
[13]J.roychoudhuryT.P.Banerjee,A.K.Bhattacharya,Ajith Abraham, “A desigh Methodology of a faultaware controller Design”,IEEE Proceedings of Computer Society (to be apper in IEEE Explore),published in HIS-09 IEEE conference.