Reporter OnLine at: www.nber.org/reporter NATIONAL BUREAU OF ECONOMIC RESEARCH
NBER
Reporter
A quarterly summary of NBER research
ALSO IN THIS ISSUE
2016 Number 3
The 2016 Martin Feldstein Lecture
* This is an edited and annotated version of the Martin Feldstein Lecture delivered on July 27, 2016. Caroline M. Hoxby is the Scott and Donya Bommer Professor in Economics at Stanford University. She is an NBER research associate and director of the NBER Economics of Education Program. Business Cycle Impacts on Health Behaviors 7
China’s Trade Policies 11 Multinational Firms, Value Chains,
and Vertical Integration 14 Regional Evidence on Business Cycle Fluctuations and Countercyclical Policy 20
NBER News 24 Conferences 28 Program and Working Group Meetings 34 NBER Books 35
The Dramatic Economics
of the U.S. Market for Higher Education
Caroline M. Hoxby*
We have in the United States what is arguably the world’s only true market for higher education, as opposed to systems that are largely centrally controlled or financed. This market exhibits a strong positive correlation between students’ college readiness (hereafter “CR”) and the educational resources of the institution they attend. Moreover, my research shows, the more powerful the market forces, the stronger the correlation.
From my latest research, which breaks new ground with both data and methods, I show the productivity of institutions across this market. Strikingly, among institutions that experience strong market forces, the productivity of a dollar of educational resources is fairly similar, even if the schools serve students with substantially different CR. On the other hand, among institutions that experience weak market forces, productiv-ity is lower and more dispersed. These facts suggest that market forces are needed to keep schools productive and to allocate resources across schools in a way that assures that the marginal return to additional resources at dif-ferent institutions is roughly comparable.
If we take the productivity results and the resources-CR correlation as manifestations of market forces, then it follows that a student with higher CR must make more productive use of any marginal dollar of educational resources than a student who is less prepared for college. This property, which economists call “single-crossing,” has long been hypothesized to be a law of nature, at least in tertiary education. This is the first compelling evidence. Single-crossing has profound consequences for the role of higher education in income growth, a point I clarify when concluding.
The U.S. market for higher education includes about 7,500
NBER
Reporter
The National Bureau of Economic Research is a private, nonprofit research orga-nization founded in 1920 and devoted to objective quantitative analysis of the American economy. Its officers and board of directors are:
President and Chief Executive Officer — James M. Poterba
Controller — Kelly Horak
Corporate Secretary — Alterra Milone
BOARD OF DIRECTORS Chairman — Martin B. Zimmerman
Vice Chairman — Karen N. Horn
Treasurer — Robert Mednick
DIRECTORS AT LARGE
DIRECTORS BY UNIVERSITY APPOINTMENT
DIRECTORS BY APPOINTMENT OF OTHER ORGANIZATIONS Jean-Paul Chavas, Agricultural and Applied Economics Association
Martin Gruber, American Finance Association
Arthur Kennickell, American Statistical Association
Jack Kleinhenz, National Association for Business Economics
Robert Mednick, American Institute of Certified Public Accountants
Alan L. Olmstead, Economic History Association
Peter L. Rousseau, American Economic Association
Gregor W. Smith, Canadian Economics Association
William Spriggs, American Federation of Labor and Congress of Industrial Organizations
Bart van Ark, The Conference Board
The NBER depends on funding from individuals, corporations, and private foundations to maintain its independence and its flexibility in choosing its research activities. Inquiries concerning contributions may be addressed to James M. Poterba, President & CEO, NBER, 1050 Massachusetts Avenue, Cambridge, MA 02138-5398. All contributions to the NBER are tax deductible.
The Reporter is issued for informational purposes and has not been reviewed by the Board of Directors of the NBER. It is not copyrighted and can be freely repro-duced with appropriate attribution of source. Please provide the NBER’s Public Information Department with copies of anything reproduced.
Requests for subscriptions, changes of address, and cancellations should be sent to Reporter, National Bureau of Economic Research, Inc., 1050 Massachusetts Avenue, Cambridge, MA 02138-5398 (please include the current mailing label), or by email to [email protected]. Print copies of the Reporter are only mailed to subscribers in the U.S. and Canada; those in other nations may request electronic subscriptions at www.nber.org/drsubscribe/.
Peter Aldrich Elizabeth E. Bailey John H. Biggs John S. Clarkeson Don R. Conlan Kathleen B. Cooper Charles H. Dallara George C. Eads Jessica P. Einhorn
Mohamed El-Erian Jacob A. Frenkel Judith M. Gueron Robert S. Hamada Peter Blair Henry Karen N. Horn Lisa Jordan John Lipsky Laurence H. Meyer
Michael H. Moskow Alicia H. Munnell Robert T. Parry James M. Poterba John S. Reed
Marina v. N. Whitman Martin B. Zimmerman
Timothy Bresnahan, Stanford
Pierre-André Chiappori, Columbia
Alan V. Deardorff, Michigan
Ray C. Fair, Yale
Edward Foster, Minnesota
John P. Gould, Chicago
Mark Grinblatt, California, Los Angeles
Bruce Hansen, Wisconsin-Madison
Benjamin Hermalin, California, Berkeley
Marjorie B. McElroy, Duke
Joel Mokyr, Northwestern
Andrew Postlewaite, Pennsylvania
Cecilia Elena Rouse, Princeton
Richard L. Schmalensee, MIT
David B. Yoffie, Harvard
tions. Some are publicly controlled; others are private non-profits or for-profits. Institutions are largely free to decide on pricing (tuition, fees, grants), CR requirements, students, fac-ulty, curriculum, salaries, financial aid, and how to raise money from donors if non-profit or investors if for-profit. Although public schools have less discretion, they still have enormous autonomy by world standards, partly because they are controlled by local and state governments, not a national one, and partly because those governments recognize that pub-lic schools must be given latitude if they are to compete with local private schools. Federal intervention is mainly in forms that students can receive regardless of the school they attend: means-tested grants, tax credits and deduc-tions, subsidized loans. On the whole, it is best to think of the U.S. tertiary sector as a market with numerous price distortions relative to lais-sez-faire, but without central control.1
U.S. institutions vary enormously in selec-tivity — that is, in the CR of their students. Selectivity is holistic but, roughly speaking, the “most” selective institutions’ average student has a combined (math plus verbal) SAT (or trans-lated ACT) score above 1300, the 90th per-centile among test-takers. (Since some students do not take the tests, this corresponds to the 96th percentile among all students.) “Highly” or “very” selective institutions have an average student with combined scores above the 75th percentile (about 1170). “Selective” (without a modifier) institutions ask students to sub-mit scores, grades, and other materials and turn down those judged to be inadequately prepared. Schools with combined scores above 1000 (the 47th percentile) are at least modestly selective. Non-selective schools usually only require that a student have a high school diploma or the equiv-alent and often have average combined scores of 800 (the 15th percentile) or below. The divide between non-selective and modestly selective schools is rough but somewhere between 800 and 1000.
NBER Reporter • 2016 Number 3 3 The high CR students who populate this part of the market make
college choices that are elastic with respect to schools’ academic and other resources. Such students have strong incentives to inter-nalize the effects of their tertiary education on their future out-comes because they pay for most of their education themselves using family funds or loans they can expect to repay with near cer-tainty. Even alumni-supported grants, which allow lower-income students to attend highly selective schools, generate strong incen-tives since the schools have every incentive to internalize the effects of educating one generation on their ability to finance the next. (It is worth noting that the market has not always been like this. Rather, the aforementioned features have arisen as informa-tion and mobility costs have fallen. I describe the market’s evolu-tion in the full-length lecture.3)
At the non-selective end of the market, fairly opposite con-ditions prevail. Geographic integration, competition, and infor-mation are poor. Students, who typically but not universally have low CR, seem not to look outside a set of local schools. Even within this set, they appear insensitive to differences in schools’ resources. Because many of these students rely heav-ily on government funds — including veterans’ benefits and loans that will predictably remain unrepaid — their incentives to internalize the effects of their education on their future out-comes is somewhat weak.
I provide evidence in Figures 1 through 3. Figure 1 shows that the educational resources a student experiences tend to rise monotonically with her CR and that the most selective schools’ per-student resources are an order of magnitude greater than those of non-selective schools. Figure 2 shows that nearly all stu-dents who apply to a very selective school send most of their (approximately 10) “competing applications” to schools located in a community other than that of the first school. Hardly any applicants to a non-selective school do this, partly because they usually apply to only one school and partly because those who do send multiple applications do so within a small geographic radius. Figure 3 shows that, at non-selective schools, students themselves account for only about 40 percent of undergraduate-related rev-enue. In contrast, they account for 80 to 95 percent of such reve-nue at highly selective schools. Information about schools is easily characterized: 100 percent of highly selective schools and about 0 percent of non-selective schools provide comparable information to the common dataset that is used to construct college guides. The availability of information jumps dramatically between non-selective and non-selective schools.
In short, every indicator — integration, competition, infor-mation, financing that generates incentives to internalize con-sequences — points to market forces being far stronger among highly selective than among non-selective schools.
Measuring the productivity of institutions is crucial if we are to gain a deeper understanding of the market. But producing reli-able measures has traditionally been extremely challenging, prin-cipally because the strong positive correlation between CR and educational resources generates a formidable selection problem.
the school spends so much on their edu-cation or because they had such high CR when admitted that they would have had high earnings regardless of their college? To measure productivity, I need data and methods that allow me to deal with selec-tion and estimate a school’s value-added, as opposed to the raw outcomes of its graduates. Value-added is the numerator of productivity.
A lesser but still-serious problem plagues the denomina-tor of productivity: the resources devoted to students’ education, not only what they spend person-ally but what society spends in total, including the government and philanthropic funds. I call this “social investment” and it includes not only investment in initial undergraduate schooling but all follow-on education that students are induced to take up. For instance, a Harvard educa-tion not only uses more resources (funded by students, donors, and taxpay-ers) per student each year. Its graduates are more likely to persist as undergradu-ates and more likely to go to graduate school. Thus, its graduates’ lifetime earn-ings reflect more years, as well as more expensive years, of education. Therefore, individuals’ longitudinal
educa-tional histories are needed. My productivity measure-ments use such histories for vir-tually all individuals who were in the U.S. during the prime ages for tertiary education — 18 to 25 — and who were age 32 in 2014. Measurements based on adjacent cohorts are very similar; I use age 32 because it is the ear-liest age at which one can predict earnings through age 65 well.4
I address the selection prob-lem by comparing students who attend different schools but who have identical college
assess-ment scores — indicating extremely sim-ilar CR — and who apply to the same schools, thus demonstrating similar taste and motivation. Some of the comparisons are between students who get into two
schools of equal selectivity but can choose only one. (From a statistical point of view, it is best if they make such choices “quasi-randomly” — that is, based on some arbi-trary factor that matters to them but does not affect long-term outcomes in a sig-nificant, consistent way. Examples would
be the school’s architectural style or the weather on the day they visited.) Other comparisons are between two students who are both “on the bubble” for admis-sion. Admissions staff admit one, quasi-randomly; the other student ends up attending a slightly less selective school.
(Admissions staff often make quasi-ran-dom decisions. For instance, two stu-dents may have equal academic quali-fications, but one may be from an area or have an extracurricular interest that
would otherwise be underrepresented in the class being admitted.) My proce-dure combines all of these student-stu-dent matchups using paired comparison statistical methods which ensure that the resulting measures rely solely on “apples-to-apples” comparisons (common sup-port, in the language of econo-metrics). The procedure generates value-added measures for nearly all institutions.
Because there is no broadly applicable way to account for the decision to attend a non-selec-tive post-secondary institution as opposed to common alternatives such as the military and on-the-job training, I do not attempt to compute the value-added of the lowest selectivity schools rela-tive to such alternarela-tives. Instead, I normalize their value-added to zero; it is plausibly greater than or less than zero. It is important to keep this normalization in mind when assessing the figures that follow.
Figure 4 shows value-added versus raw lifetime earnings for nearly all schools, from the non-selective to the most selec-tive. Value-added rises with selectivity, though not nearly as fast as raw ings. This shows that much of the earn-ings increase is due to students’ higher CR. However, Figure 5 shows that the denominator of productivity, the lifetime educa-tional resources students experi-ence, rises greatly with selectivity. Notice that these resources rise more steeply with selectivity than a single year of resources, shown in Figure 1. This indicates that higher CR students attend more years of higher education.
Thus, productivity may rise or fall with selectivity depending on the “race” between its rising numerator and rising denomina-tor. In fact, as shown by Figure 6, the average productivity of a dollar is fairly flat among schools that are selective. There is, however, a notable increase in the level of productivity as we move from the non-selective to selective schools. Figure Figure 4
NBER Reporter • 2016 Number 3 5 7 shows, in addition, that very selective
schools whose students have the same CR tend to have similar productivity. In con-trast, non-selective schools differ widely in productivity.
The fact that productivity is fairly flat across institutions that range from modestly to highly selective is striking because the least selective schools in this range have much lower educa-tional resources than the most selective schools. Thus, the flat-ness indicates that resources somehow scale up with students’ CR so that there would be no easy gains from reallocating dol-lars among the modestly selec-tive and most selecselec-tive schools. This is undoubtedly the most important result in this lecture because, when combined with the evi-dence on market forces, it has profound implications.
The evidence in Figure 6 also indi-cates that the productivity of a dollar at selective institutions is sufficiently posi-tive that they are a good investment for the students who attend them. (For this not to be true, the least selective schools would need to have nota-bly negative value-added instead of the zero to which I have nor-malized it.) Note that Figure 6 does not imply that selective schools make maximally produc-tive use of resources, just that they make similarly efficient use of resources.
Figure 6 indicates that the average non-selective institution is less productive than selective ones. This result is concerning, especially because enrollment in non-selective schools has grown substantially faster than
enroll-ment in selective schools since at least 1970. The proximate causes of the higher growth rate are fairly clear. The distribu-tion of CR among U.S. secondary school students is largely unchanged since 1970. Thus, selective schools that maintain their CR standards can only grow as fast as the population grows. But non-selective
schools grow both with the population and by enrolling students of lower CR — those who would not have been candi-dates for tertiary education in past years.
As indicated above, it is hard to say whether the average non-selective school is a good investment relative to alterna-tives like the military or on-the-job train-ing. However, Figure 7 tells us that the average is not of first-order importance anyway. The striking fact is that non-selec-tive schools differ greatly in productivity.
This means that students choosing among non-selective schools can make mistakes that have very serious consequences for their life outcomes.
Can economics make sense of all the evidence reviewed so far? Consider a simple world in which (i) there is single-crossing in CR and educational
resources; students with higher CR make more productive use of any marginal dollar of resources. Suppose also that (ii) students maximize their return on education; (iii) college choices are not based on geography but, instead, are elastic with respect to schools’ resources and out-comes; and (iv) students are fully informed and not liquid-ity constrained. In this world, market forces would generate an assortatively matched allocation in which higher CR students would be paired with greater educational resources. Crucially, in this world, market forces would require that each dollar of resources be equally productive.
This model, although overly simple, aligns fairly well with what we see in the selective tertiary sec-tor where assumptions (i) through (iv) are not grossly wrong. (It is surprising that the simple model fits as well as it does given that even the selective sector abounds in price distortions, information gaps, and financing problems.) The simple model does not align at all with the
non-selective sector, and we should not expect that it would. We have seen evidence that the non-selec-tive sector has little integration, weak competition, poor infor-mation, and blunted incentives for participants to internalize the consequences of their educa-tional choices.
What are the broader impli-cations of the evidence and model? If the education pro-duction function for tertiary education does indeed exhibit strong single-crossing, they are profound. To make its maxi-mum contribution to economic growth, the higher education sector must allow educational resources to scale up with CR. Yet, the extent of scaling up that occurs in the U.S. is unique. Most coun-tries allocate more, but only modestly more, resources to higher CR students.
Moreover, single-crossing implies that if a country can make all its students Figure 6
attain high CR, it would be growth-max-imizing to invest more in the tertiary education of all of them. Educational resources are investments, not consump-tion, so that, to a first-order, there is nothing zero-sum about them. This key point is often misunderstood: One might incorrectly think that there is a fixed pie of resources so that some students must necessarily get fewer resources if others get more.
Nevertheless, single-crossing in ter-tiary education puts great pressure on the primary and secondary systems to ensure that all students, regardless of background, are able to attain CR. If educational opportunities are restricted to a subset of students, single-crossing is likely to reduce income mobility and equality. It is important to note that pre-tertiary education may not exhibit single-crossing just because tertiary education does. Indeed, some economists hypoth-esize that, in early childhood education, every marginal dollar of resources is more productive for children from more disad-vantaged backgrounds.5
The other key implication of the evidence and model is that economic growth is likely to increase with policies that facilitate market forces in higher education — better information, greater
integration, stronger competition, and financing that makes students and schools internalize the consequences of their choices. Such policies appear to drive educational resources toward a relatively efficient allocation. While we have not seen evidence here that all tertiary edu-cation investments earn higher returns than competing uses, such as investments in physical capital, policies that generate greater efficiency within higher education are almost certainly pro-growth.
1 For a succinct history of the market’s
evolution, see C. Hoxby, “The Changing Selectivity of American Colleges,” Journal of Economic Perspectives, 23(4), 2009, pp. 95–118. This article also describes some of the market’s key internal logic. Some of the historical evidence is reviewed in the full-length version of this lecture. See
http://nber.org/feldstein_lecture_2016/ feldsteinlecture_2016.html.
Return to text
2 This logic is described in detail
in C. Hoxby (2009) and C. Hoxby, “Endowment Management Based on a Positive Model of the University,” NBER Working Paper No. 18626, December 2012, and published as “Endowment Management Based on a Positive Model of
the University,” in J. Brown and C. Hoxby eds., How the Financial Crisis and Great Recession Affected Higher Education, Chicago, Illinois: University of Chicago Press, 2015, pp. 15–41.
Return to text
3 See the video of this year’s Feldstein
Lecture: http://nber.org/feldstein_lec-ture_2016/feldsteinlecture_2016.html. Return to text
4 For more on the data and methods
described in this and the next few para-graphs, see C. Hoxby, “Computing the Value-Added of American Postsecondary Institutions,” Internal Revenue Service Statistics of Income Division Working Paper, July 2015; see also C. Hoxby, “The Productivity of U.S. Postsecondary Institutions,” in C. Hoxby and K. Stange eds., Productivity in Higher Education, forthcoming, Chicago, Illinois: University of Chicago Press.
Return to text
5 Such a phenomenon could arise simply
because more advantaged parents are bet-ter substitutes for early childhood educa-tion. In other words, the phenomenon would not require that a fundamental complementarity between aptitude and educational resources reverse itself as chil-dren age.
NBER Reporter • 2016 Number 3 7
Research Summaries
Business Cycle Impacts on Health Behaviors
Dhaval Dave
The unemployment rate more than doubled in the United States during the Great Recession, from 4.4 percent to 10 percent, imposing a heavy financial bur-den on households. However, whether such economic downturns also impose a health burden is a subject of much debate. Exploiting area-level variation in measures of labor demand, a large litera-ture, starting with Chris Ruhm’s seminal work, has explored how the business cycle affects population health.1
While it may be intuitive to suppose that population health would improve with the macroeconomy, the evidence is surprisingly murky. Some adverse health effects of economic downturns are direct and undisputed, such as increases in psy-chological stress, depression, and related illnesses, while others are indirect and less clear. Some studies indicate that health is countercyclical, with various measures of mortality, including those from cardio-vascular disease and motor vehicle fatali-ties, declining with reduced economic activity, while others find the opposite.
None of these studies of the link between labor demand and health out-comes presume a direct effect. Rather, the presumption is that labor demand affects workers’ environment (for instance, pol-lution or crowding) or their behavior (for instance, physical activity, diet, tobacco and alcohol use), which then affects health. Health effects may take time to materialize, making it challenging to iden-tify them empirically in the short term. Thus, it is important to examine the inter-mediate links, that is, effects on health behaviors, which may respond more read-ily than health itself to changes in house-holds’ time and income constraints over
the economic cycle. Examining these proximate pathways also is important for judging the validity of the prior, at times contradictory, evidence on health.
Consider, for instance, the various studies that assess whether area-level unemployment affects obesity. It is pre-sumed that unemployment leads to a change in energy expenditure and/or energy intake, which in turn affects body-weight. While some studies find that obe-sity decreases during recessions, others find the opposite, and still others find no consistent effects. Many of these studies use similar methods and data sets. Thus, additional evidence bearing on the sepa-rate links in the causal chain would help assess the credibility of the link between labor demand and obesity. Similarly, research has examined the effects of labor demand on heart disease, with one pre-sumed causal pathway being that unem-ployment leads to less physical exertion which leads to fewer heart attacks.
In a series of papers with Gregory Colman and Inas Kelly, I examine how labor demand affects health behaviors, in order to shed light on the effects of the economic cycle on health.
Energy Expenditure
and Time Use
Prior evidence on the effects of unemployment on energy expenditure has been confined to recreational exercise, and has been inconsistent. While recre-ational exercise is certainly an important behavioral outcome, it constitutes only about 4 percent of total physical activ-ity. Furthermore, in a study with Henry Saffer, Michael Grossman, and Leigh
Dhaval Dave is the Stanton Research Professor in Economics at Bentley University. He is also a research fellow at the Institute for the Study of Labor and a research associate in the NBER Program on Health Economics. He holds a Ph.D. from the Graduate Center of the City University of New York, and B.S. and M.A. degrees from Rutgers University. Before joining the Bentley faculty, Dave was a John A. Olin postdoctoral research fellow at the Wharton School of the University of Pennsylvania.
Dave is an applied microeconomist with primary research areas at the intersection of health and labor economics. His current research examines the demand for electronic cigarettes, the link between welfare policy and longer-term effects on behavioral outcomes for parents and their children, broader non-economic effects of the minimum wage, and labor market effects of the Affordable Care Act. He is also interested in the economics of crime, and is analyzing interventions in the juvenile justice system and how they impact youth recidivism and educational outcomes. Dave’s research has been supported by the National Institutes of Health, the Agency for Healthcare Research and Quality, and various research foundations. He is currently serving as an associate editor of Economics and Human Biology.
Ann Leung, I find significant substitution across recreational exercise, work-related physical activity, and other modes of activ-ity.2 Thus, it cannot be presumed that,
because exercise improves health, if unem-ployment increases exercise it must also improve health. It is total physical activity, not just recreational exercise per se, which is the salient input into the individual’s health production function.
Colman and I study whether shifts in labor demand induce individuals to become more or less physically active.3 We
exploit within-state variation in gender-specific employment ratios matched with detailed time diary information from the American Time Use Survey (ATUS) over 2003–10, a period which included the Great Recession. The ATUS is based on a national sample drawn from the Current Population Survey (CPS) and tracks all activities undertaken by the respondent in the past 24 hours. For each activity, in addition to duration, we measure intensity using the Metabolic Equivalent of Task (MET). A unit of MET is defined as the ratio of a person’s working metabolic rate relative to his resting metabolic
rate.4 By combining
informa-tion on the durainforma-tion of each activity with its MET value, we are able to group activities and also to construct a standard-ized and consistent measure of total physical activity or exer-tion during the day.
Figure 1, which compares unadjusted means before and after the recession began in late 2007, summarizes our main results. We find that a reduc-tion in employment increases exercise, and specifically exercise
activities which are relatively less vigorous, with a MET value of 4 or lower, such as walking or golfing. The increase in exercise during a recession is consistent with a reces-sion-induced easing of time constraints. We also find that part of the time freed from a decrease in working hours over the recession flows into other time-intensive activities such as housework, childcare, eat-ing and drinkeat-ing, watcheat-ing television, and sleeping. Total physical exertion, however,
declines during a recession, as the aver-age individual’s loss in work activity is not offset by the increases in exercise and other home-based, mostly low-MET lei-sure activities.
As a validation check, we find that these effects are concentrated among groups — particularly males who are low-educated or employed in physically demanding occupations — whose employ-ment was most adversely affected by the recent economic collapse. The decrease in physical activity and exertion during an economic downturn may partly explain the positive association often found between unemployment and depression, and also lends some credibility to studies that uncover a procyclical relationship in mortality from cardiovascular causes.
Diet and Food Intake
The flip side to energy expenditure and physical exertion is how a recession affects food intake, a question that I address in a study with Kelly.5 We utilize
individual-level data from the Behavioral Risk Factor
Surveillance System (BRFSS) spanning the 20 years of 1990–2009 and including the comparatively mild 1990–91 and 2001 recessions and the severe 2007–09 down-turn. While self-reported measures of types of foods consumed and frequency of con-sumption in the BRFSS are subject to mea-surement error and less than ideal, the long time span and the large sample sizes allow us to provide some of the first evidence on this issue. Exploiting within-state variation
in subgroup-specific unemployment and employment rates, we find that individu-als’ food consumption choices systemati-cally vary over the economic cycle, though in ways that defy simple characterization.
Specifically, we find consistent evi-dence that a higher unemployment rate is associated with reduced frequency of fruit and vegetable consumption, and weak evidence of an increased frequency of consuming snacks and foods relatively dense in calories and fat, such as ham-burgers and fried chicken. Together with the ATUS data, the results indicate that reduced employment is associated with an increase in time spent eating and drinking. While this may not necessarily reflect calo-ries consumed, it may reflect an increase in “secondary eating,” that is, snacking while watching television — both of which are activities our studies show tend to increase during a recession.
One issue with the BRFSS measures of consumption of foods such as hamburgers and fried chicken is that they conflate con-sumption of such foods prepared at home with those consumed in fast food
restau-rants and other establishments. Using data from the National Longitudinal Survey of Youth (NLSY), Colman and I specif-ically assess effects on fast food consumption and find that unemployment reduces the number of fast food meals that respondents consume weekly.6
There is considerable heteroge-neity in these effects. As with the results for exercise and physical activity, the reduc-tions are larger among males and lower-educated individu-als — groups which tend to be concentrated in boom-and-bust industries such as manufacturing and construction and thus relatively more vulnerable to the adverse employment effects of a recession.
Mechanisms
and Intra-Household Spillovers
NBER Reporter • 2016 Number 3 9 observed changes in behaviors. Own
job-loss can affect exercise and diet by easing time endowment constraints as well as through a negative income shock. Further, it may lead to loss of health insurance and reduced access to care, which may also impact health behaviors. In prior work, Robert Kaestner and I find evidence of ex ante moral hazard whereby loss of cover-age may actually lead individuals to behave more healthily, though there is also a coun-teracting effect from reduced contact with physicians due to loss of health care cov-erage, which can lead to an increase in unhealthy behaviors.7 While these are
direct “internal” effects from recession-induced job loss, an economic downturn may, in addition, have external spillovers on health behaviors, conditional on own labor supply. Inability to find work, risk of job loss, and expectations may affect mental health and perceived health status, which may affect behaviors.
We assess the role of some of these pathways in explaining the changes in observed food consumption choices. We find that, to varying degrees, shifts in household income, time constraints, and mental health status play important roles. With respect to reduced fast food con-sumption associated with unemployment, we find that this mostly reflects the greater availability of time for cooking rather than less income available to purchase fast food. This is supported by data from the ATUS, which show that the time spent on meal preparation is positively associated with the unemployment rate. For these behav-iors, we do not find insurance coverage to be an important mediator, possibly due to the counteracting incentives noted above, and partly due to the increase in pub-lic coverage buffering the drop in private coverage. We also assess whether shifts in the relative prices of food over the busi-ness cycle can explain any substantial part of the link between unemployment and food consumption, and generally do not find this to be the case, with the caveat that measuring the relative prices of food is sub-ject to multiple challenges.
One point generally overlooked in the literature is the possibility of exter-nal effects due to intra-household
spill-overs. For married or cohabiting couples, for instance, a spouse’s job-loss can affect a respondent’s behavior due to joint house-hold production even if their own labor supply remains unchanged. Using the ATUS, Colman and I assess the impor-tance of such spousal spillover effects.
Due to the segregation of gen-ders across industries and sectors and to the much stronger adverse employment effects on male-dominated sectors dur-ing the recent recession, there is substan-tial within-state variation in each gender’s employment ratio independent from the other. Exploiting this variation, we find some evidence of spousal spillovers. Where the husband’s and wife’s time are substitute inputs — for instance, housework, child-care, and shopping — one spouse’s job loss reduces the other spouse’s time use in these activities. Thus, spousal job-loss allows the spouse to take over some of these activities, and frees up the other spouse’s time which then appears to be spent on personal care, socializing and relaxing, and sleeping. The presence of these and other external effects also underscores why it is not appropriate to use area-specific labor demand shocks as instrumental variables for own labor sup-ply to identify effects on health behaviors and outcomes.
Average Population Effect versus
‘Treatment-on-the-Treated’
An important issue that arises in this literature relates to the interpretation of effect sizes, and whether they are econom-ically significant. In most of these stud-ies, including some of our own, area-level measures of labor demand are linked to person-level data. What is being estimated is a reduced-form or average population effect (APE), which conflates those who are affected and those who are not affected by the recession. For instance, we find that a one percentage point decrease in the employment-to-population ratio increases time spent exercising by 0.27 minutes per day, an effect which is precisely estimated but appears to be very small. This APE is expected to be small, however, since most individuals are not affected and do not lose their jobs during a recession. This also poses
a challenge in this literature, as very large sample sizes are required to reliably detect it. If we assume that the effect is being real-ized only for individuals who lose their jobs during a recession, then this APE translates into a treatment-on-the-treated (TOT) effect of a 27-minute increase in time spent exercising, a meaningful effect size.
Consider the effect on total physi-cal exertion for low-educated males, the group most affected by the recent eco-nomic downturn. We find that total physi-cal activity declines by between 5.1 and 6.3 MET-adjusted minutes for every one per-centage point decrease in the employment-to-population ratio. Again, if the effect is the result of changes in behavior only of those who become unemployed, this trans-lates into a decline in total daily physi-cal exertion of about 21 to 24 percent for the average laid-off individual. If there are external spillovers of the depressed labor demand on other individuals, then the TOT will be smaller. For instance, if we assume that the external effects are as large as the “internal” effects — so for instance, the recession affects as many other indi-viduals as those who lose their jobs — then this implies a reduction in total physical exertion of 10 to 12 percent a day.
Longitudinal Evidence
Colman and I provide some of the first longitudinal evidence on these questions.8
We specifically consider the effects of indi-viduals’ job loss on their health behav-iors, using alternate measures — becoming unemployed during a recession, becom-ing unemployed because of bebecom-ing laid off, becoming unemployed due to plant or business closure — that are plausibly exog-enous, based on data from the 1979 NLSY Cohort and the Panel Study of Income Dynamics (PSID). The use of longitudinal information allows us to address several lingering questions in the literature.
For instance, if recessions reduce smoking, cross-sectional data have a dif-ficult time determining whether this reflects light smokers quitting or heavy smokers cutting back. Responses may also vary based on the duration of unemploy-ment. Recent job losers will change their behavior little if they expect to be re-employed, whereas if they expect jobless-ness to last, they will adjust to a possibly prolonged decline in income and increase in non-work time. Longitudinal data also allow us to control for potential compo-sitional selection arising from interstate migration that may be correlated with job prospects and health.
Consistent with our work with the ATUS, we find that becoming unem-ployed is associated with a small increase in recreational exercise but a substan-tial drop in total physical activity. These effects are more pronounced with lon-ger unemployment duration. We also find some suggestive evidence for other health behaviors including a moderate decrease in smoking. Prior evidence on the effect of unemployment on smoking has been mixed, and our longitudinal evidence sug-gests that this may be due to heterogeneity across various margins. Among females, job loss is associated with an increase in the probability of being a current smoker, consistent with a decline in smoking ces-sation or relapse into smoking among
for-mer smokers due to stress. However, both males and females who were heavy smok-ers at baseline tend to somewhat reduce their cigarette consumption, consistent with an income effect. A longer unem-ployment duration is also associated with a greater likelihood of delaying a doctor visit, which may reflect individuals delay-ing or postpondelay-ing utilization until they have a job and health care coverage.
Prior research on the effects of unem-ployment on the body mass indes (BMI) has either found small effects on both sides or no effects. This may reflect that the true effect, if it exists, is simply too small to measure in a population-based sample. Thus, there is also some value in being able to measure energy expenditure (proxied by exercise and physical activity), energy intake (proxied by consumption of fast food, snacks, and other food), and the net effect (BMI) for the same individual over time. Our interpretation of the joint results of physical activity, fast food con-sumption, and BMI is that both energy expenditure and energy intake tend to decline after a job loss, leaving observed BMI unchanged or only slightly higher, mostly among previously obese individu-als, even with prolonged unemployment.
Conclusion
The research presented here shows that the effects of unemployment and risk of job loss on health behaviors are complex and multi-faceted, and cannot necessarily be reduced to broad generalizations along the form of recessions leading individuals to engage in more or less healthy lifestyles. Different behaviors vary in terms of their relative intensity of time- versus market-purchased inputs, and thus respond dif-ferently to shifts in resource constraints over the economic cycle. While our work yields some insights on these relation-ships, it only touches on a few behavioral outcomes and processes at play linking the broader macroeconomy to micro-level choices. In light of the far-reaching effects
of the recent economic downturn, interest in these questions has reemerged among economists and research along these lines will help inform efforts to determine the true economic costs of recessions and the appropriate policy responses.
1 See for instance C. Ruhm, “Health
Effects of Economic Crises,” NBER Working Paper No. 21604, October 2015. Return to text
2 H. Saffer, D. Dave, M. Grossman, and
L. Leung, “Racial, Ethnic, and Gender Differences in Physical Activity,” Journal of Human Capital, 7(4), 2013, pp. 378–410. Return to text
3 G. Colman and D. Dave, “Exercise,
Physical Activity, and Exertion over the Business Cycle,” Social Science & Medicine, 93(c), 2013, pp. 11–20. Return to text
4 One MET represents the energy it takes
to sit quietly, which for the average adult represents about one calorie per every 2.2 pounds of body weight per hour; walking, for instance, has a MET value of 2. Return to text
5 D. Dave and I. Kelly, “How Does the
Business Cycle Affect Eating Habits?” Social Science & Medicine, 74(2), 2012, pp. 254–62.
Return to text
6 G. Colman and D. Dave,
“Unemployment and Health Behaviors over the Business Cycle: A Longitudinal View,” NBER Working Paper No. 20748, December 2014.
Return to text
7 D. Dave and R. Kaestner, “Health
Insurance and Ex Ante Moral Hazard: Evidence from Medicare,” International Journal of Health Care Finance and Economics, 9(4), 2009, pp. 367–90. Return to text
8 G. Colman and D. Dave,
“Unemployment and Health Behaviors over the Business Cycle: A Longitudinal View,” NBER Working Paper No. 20748, December 2014.
NBER Reporter • 2016 Number 3 11 We also find that total world
produc-tion and welfare will increase under a TPP regional free trade initiative and TPP will benefit member countries significantly. Smaller TPP countries gain proportionally more than the U.S. because of their sub-stantial intra-Pacific trade. These results appear to be reasonably robust to changes in key model parameters, such as price elasticities of demand.
We use our model to simulate the effects of Japan joining the TPP and find that this would be a beneficial step for Japan and all other TPP countries, but that this action would have negative effects on China and the rest of the world. We eval-uate the effect of China joining the TPP, and find that China and other TPP tries would all gain, while non-TPP coun-tries would be hurt. In our model, the effects of TPP are different from those of global free trade. Global free trade ben-efits all countries, but TPP benben-efits only member countries. Moreover, the positive effects of global free trade are considerably higher than those of TPP.
China and Mega Trade Deals
Li, Jing Wang, and I explore potential impacts on China and other major coun-tries of mega trade deals beyond TPP.3
These include the Regional Comprehensive Economic Partnership (RCEP), China-Japan-South Korea Free Trade Agreement, China-TPP, and possible China-U.S. and China-India free trade agreements. We also use numerical general equilibrium simula-tion methods, but introduce two impor-tant novelties. First, we divide trade costs into tariff and non-tariff barriers and again
calculate trade costs between countries empirically using gravity-model meth-odology. This allows exploration of free-trade agreement effects from both tariff and non-tariff reduction. Secondly, we use an inside money structure to form an endogenous trade imbalance model that captures important reali-ties in China’s large trade imbalances. Using a 13-country Armington-type global general equilibrium model, we endogenously determine trade imbalance effects from the trade initiative and calibrate our model to a base case
captur-China’s Trade Policies
John Whalley
Recent developments in China’s trade policy include discussions of the possibil-ity of joining the Trans-Pacific Partnership, exploration of mega trade deals with a number of trade partners, and enactment of a China-Korea free trade agreement. My research program applies numerical simulation methods to various economic models of China and its trading partners to analyze the potential impacts of such changes. The work draws on the output of two research efforts by young Chinese scholars that intensively examined a broad range of Chinese economic topics.1
China and the TPP
The Trans-Pacific Partnership (TPP) is a proposed regional arrangement among 13 countries; China is not a participant. Chunding Li and I assess the potential effects of the TPP on China and other countries.2 We use a numerical
five-coun-try global general equilibrium model which incorporates trade costs and a mon-etary structure that incorporates inside money and thereby allows for impacts
on trade imbalances. Trade costs are cal-culated using a method based on gravity equations. Our simulation results show small negative effects of the TPP on China and other non-TPP countries.
Figure1
John Whalley is a research associate in the NBER International Trade and Investment program and a professor of economics and co-director of the Centre for the Study of International Economic Relations at Western Uni versity in Canada. He is a Distinguished Fellow at the Centre for International Governance Innovation (CIGI) in Canada.
Whalley’s major research interests include computable general equilibrium, interna-tional trade, public finance, development economics and transition economies, global-ization, and climate change economics.
ing China’s large trade surplus. We cali-brate the model to 2011 data and use counterfactual simulations to explore the effects.
Our simulation results show that almost all mega deal member countries will gain and nearly all mega deal non-member countries will lose. The more non-tariff barriers are eliminated, the more significant the impacts the mega deal will have on all countries. All mega deals will benefit China in terms of welfare, trade, exports, and imports. Comparatively, the RCEP and China in the TPP generate the highest wel-fare outcomes in the model. The next highest is a
China-Japan-Korea free trade agreement (FTA), and then a China-U.S. agreement. For the China-U.S., China in the TPP gener-ates the highest welfare gain. The next highest is a China-U.S. FTA. For the European Union, all China-involved mega deals except a China-U.S. FTA generate negative welfare outcomes. For Japan, RCEP generates the high-est welfare gain; the next highest is China in the TPP. For Korea, RCEP generates the highest welfare gain, fol-lowed by a China-Japan-Korea FTA. For India, RCEP
generates the highest welfare gain, fol-lowed by a China-India FTA.
China and Trade
Policy Bargaining
Timing is an issue in China’s trade bargaining, since the country is grow-ing faster than its OECD partners. Li and I use a multi-country, single-period numerical general equilibrium model which describes the economies of China and its major trading partners to examine the outcomes of trade policy bargaining solutions — bargaining over tariffs and financial transfers — over time.4 We compute gains relative to
non-cooperative Nash equilibria (NE) for a range of model parameterizations.
This yields a measure of both absolute and relative gain to China from global trade policy bargaining. We calibrate the model to base case data for 2008 and use a model formulation in which there are heterogeneous goods across countries. The gains from trade bar-gaining accrue more heavily to coun-tries other than China when we focus on the economic circumstances in 2008 than when we use data from a later year. We consider the impact of differing prospective national growth estimates, which sharply increase China’s size rel-ative to its trading partners. Our objec-tive is to assess how China’s gains from
bargaining change over time, and in particular whether they grow at a faster rate than GDP.
Our simulation results show that China’s welfare gains from bargain-ing with the OECD increase over time if all countries keep their pres-ent GDP growth rates. Using the Nash Equilibrium solution concept, China’s share of global bargaining gains in the simulation is 41 percent in 2010, 67.7 percent in 2050, and 88.7 per-cent in 2100. [See Figure 2.] This shows growth in bargaining gains at roughly the rate of increase in relative GDP. China’s annual average growth rate in its trade bargaining welfare gain is about 11 percent, just a little higher than its GDP growth rate. The
compa-rable statistic for the OECD is about 6 percent, higher than its GDP growth rate. When we use an alternative Kalai-Smorodinsky (KS) solution concept, things are different. China’s share of global gains is initially smaller — only 10.6 percent in 2010 — but grows much more rapidly to 70.9 percent in 2050 and to 99.1 percent in 2100. We get these results under the assumption that China maintains its growth rate at 10.47 percent, its average in 2001-10, and the OECD stays at a rate of 1.66 percent, its average in the same period.
These findings imply important differences when using Nash and KS bargaining solution con-cepts for numerical policy-based work. With asym-metric shifts in the utility possibility frontier due to growth, the Nash bargain-ing approach uses tangencies between an implicit Cobb-Douglas preference func-tion and the utility possi-bility frontier, while the KS uses a utopia point propor-tional to intersections with axes. The two equilibrium concepts behave differently. Additionally, if China joins with India and Brazil to bar-gain jointly with the OECD, China’s welfare gain from bar-gaining increases by 40 percent com-pared to the Nash bargaining China-OECD case. We also find that if we take account of the relative size of China’s economy by making a purchas-ing power parity correction to our ini-tial calibration, China’s welfare gain would be even larger.
China’s Service Trade
Services are an increasingly impor-tant part of China’s trade. Chen and I discuss the country’s service trade per-formance from 1980 to 2010, focus-ing on service subsectors in both the Chinese and the world economies.5 We
NBER Reporter • 2016 Number 3 13 sectoral decomposition, comparative
advantage, and degree of openness. The data suggest that despite China’s high growth rate, development of service trade lags behind merchandise trade. The openness index for China’s service trade differs across subsectors, and the international competitiveness of major service subsectors remains low.
We examine China’s service trade in light of prospective development strategies and assess potential effects on the Chinese and global economies. China has adjusted its long-term policy bias in favor of merchandise manufac-turing and heavy industries to encour-age high-tech manufacturing and ser-vices in its far-reaching 12th Five-Year Plan. A series of facilitating policies on taxation, finance, land use, and other elements has been launched to boost the service trade, which already has had large impacts on the country’s eco-nomic growth, employment, and tech-nology diffusion. The potential global impacts of China’s service trade devel-opment include changes in China’s competitiveness in offshore service out-sourcing, shifts in global FDI patterns and flows, and international migration of educated labor.
The Shanghai Pilot
Free Trade Zone
China still maintains relatively rig-orous capital controls for both state secu-rity and policy independence reasons. The adoption of the China (Shanghai) Pilot Free Trade Zone in September 2013 was part of an ambitious new round of reform, designed to liberalize the capital account and facilitate trade in the small area of Shanghai to which the zone’s special policies apply. Daqing Yao and I discuss the reasons for and objectives of China’s adoption of such a zone and review its first year of opera-tion.6 We find that the main impacts of
the zone has not been its trade volume
or foreign investment, but the institu-tional innovation it has generated. The most significant changes include imple-mentation of a “negative list” model for foreign investment management, more efficient operation of new trade supervi-sory institutions for trade execution, the launch of financial reform experiments on capital account convertibility and in financial services, and the cutting of red tape in administration.
The Shanghai zone is a trial intro-duction of both floating exchange rates and capital account liberalization into China’s macro policy mix. We examine three measures to evaluate its effects: the price spread between the Chinese yuan in Hong Kong and mainland China, the yield gaps between Renminbi accounts in onshore and offshore markets, and the extent to which changes in China’s money supply lead to changes in foreign interest rates. We find that the yield gap between three-month notes onshore and offshore declined after the found-ing of the Shanghai zone. Our results more generally suggest that China’s cap-ital controls have weakened since initia-tion of the zone.
The zone incorporates many policy innovations such as free trade accounts and a negative list for foreign invest-ment, as well as new trade facilities. These reforms enable funds to flow in and out of China more freely, and inte-grate the Chinese financial market more into the international market.
1 One was a “Young China Scholars
Network on China’s Policy Options in a Post Crisis World” sponsored by Western University, the Centre for International Governance
Innovation (CIGI, Waterloo), and the International Development Research Centre (IDRC, Ottawa) between 2010 and 2013. Another was a six-year (October 1, 2009, to September 31, 2015) project titled “The Western-CIGI-China (BRIC)-Ontario Project”
which was supported by Western University, Ontario Research Fund (ORF), CIGI, and a number of Chinese universities and research institutions. Return to text
2 C. Li and J. Whalley, “China and
the TPP: A Numerical Simulation Assessment of the Effects Involved,” NBER Working Paper No. 18090, May 2012, and published as “China and the Trans-Pacific Partnership: A Numerical Simulation Assessment of the Effects Involved,” The World Economy, 37(2), 2014, pp.169–92.
Return to text
3 C. Li, J. Wang, and J. Whalley,
“Numerical General Equilibrium Analysis of China’s Impacts from Possible Mega Trade Deals,” NBER Working Paper No. 20425, August 2014, and published as “Impact of Mega Trade Deals on China: A Computational General Equilibrium Analysis,” Economic Modelling, 57, 2016, pp. 13–25.
Return to text
4 C. Li and J. Whalley, “China’s
Potential Future Growth and Gains from Trade Policy Bargaining,” NBER Working Paper No.17826, February 2012, and published as “China’s Potential Future Growth and Gains from Trade Policy Bargaining: Some Numerical Simulation Results,” Economic Modelling, 37(C), 2014, pp. 65–78.
Return to text
5 J. Whalley and H. Chen, “China’s
Service Trade,” Journal of Economic Surveys, 28(4), 2014, pp. 746–74. Return to text
6 D. Yao and J. Whalley, “The
China (Shanghai) Pilot Free Trade Zone: Background, Developments and Preliminary Assessment of Initial Impacts,” NBER Working Paper No.
20924, February 2015, and The World Economy, 39(1), 2016, pp. 2–15.
In recent decades there has been a very rapid increase in flows of goods and capital between countries and between firms, driven by technological progress and falling cross-border restrictions. The rising ability to retain or outsource vari-ous production stages within firms and across country boundaries has fueled frag-mentation of production and the emer-gence of global value chains. Cross-border production, investment, and trade in final and intermediate goods by multinational corporations (MNCs) are key drivers of this phenomenon.
In a series of papers combining new firm-level datasets and novel insights from trade and organizational econom-ics, my colleagues and I have examined the characteristics and determinants of MNCs, value chains, and vertical produc-tion. We have found new patterns of for-eign direct investment (FDI), and inves-tigated the relationships among market conditions, vertical integration, and the effects of foreign capital.
We document the emergence of new MNC industrial clusters and their dis-tinct agglomeration patterns. The orga-nizational choices that firms make in structuring their value chains suggest that complex production and process decisions involving multiple stages explain intra-firm activity. Our work enhances under-standing of the sources of productivity gains and resilience to external shocks afforded to host countries by MNC activ-ity and cross-border vertical relations.
Global Patterns of
MNC Activity
Agglomeration
One strand of my research has examined the geographic concentra-tion of the plants operated by MNCs,
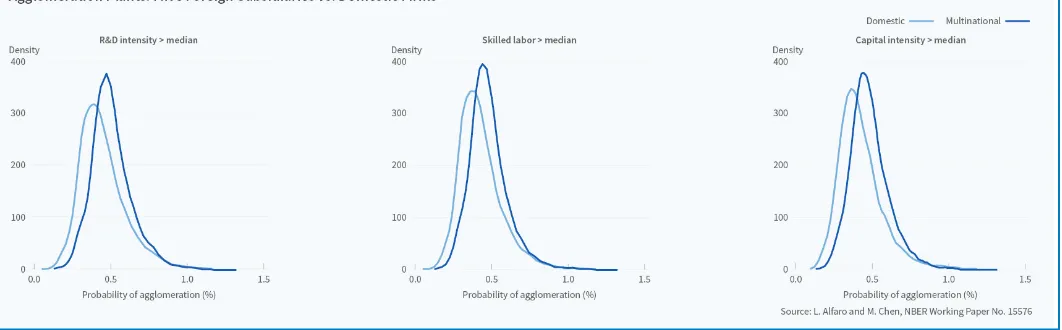
and compared that concentration with the analogous pattern for domestic firms. Maggie Chen and I find evi-dence of MNC clusters, which we label agglomeration.1 MNCs’ offshore
sub-sidiaries’ higher productivity, verti-cally integrated production, and higher knowledge- and capital-intensities all suggest that their motives for agglomer-ation are different from those of domes-tic firms. We quantify patterns of spa-tial location by constructing an index of agglomeration that compares establish-ments at both the industry and plant levels.2 The index quantifies the extent
to which MNC establishments are more or less likely to agglomerate than their domestic counterparts. Dun and Bradstreet’s WorldBase data enables us to compute this index based on plant-level observations. The dataset includes primary and secondary industries, own-ership information, and plant-level physical location, which can be used to calculate the distance between pairs of establishments.
Our comparative analysis generates a rich array of new findings. MNC headquarters are, on average, the most agglomerative, meaning that they are most concentrated geographically. Headquarters facilities are followed by MNC foreign subsidiaries and domes-tic plants in their degree of concentra-tion. The differences in the degree of agglomeration of these three different types of facilities suggest that MNC offshore clusters are not simply a reflec-tion of domestic industrial ones.
Figure 1, on the following page, plots the distributions of pairwise industries’ agglomeration densities, computed using a distance of 50 km to define “close” establishments for MNC foreign subsidiaries and domestic plants, respectively. MNC foreign
sub-Multinational Firms, Value Chains,
and Vertical Integration
Laura Alfaro
Laura Alfaro is a research asso-ciate in the NBER’s International Finance and Macroeconomics (IFM) Program and the Warren Alpert Professor of Business Administration in the business, government, and international economy unit at Harvard Business School, the faculty of which she joined in 1999. For several years she has co-organized the NBER’s IFM spring meeting.
In 2010–12, Alfaro served as Minister of National Planning and Economic Policy in her native Costa Rica during a leave of absence from Harvard.
Alfaro’s main research inter-ests are in international economics, in particular international capital flows, sovereign debt, foreign direct investment, and multinational activity. Her recent research focuses on multinational activity, value chains, and vertical integration.
Alfaro earned her Ph.D. in eco-nomics in 1999 from the University of California, Los Angeles, from which she received a dissertation fellowship award. She received a Licenciatura from the Pontificia Universidad Católica de Chile in 1994, from which she graduated with highest honors, and a B.A. in economics with honors from the Universidad de Costa Rica in 1992.
NBER Reporter • 2016 Number 3 15 sidiaries are more agglomerative than
domestic plants in capital-, skilled labor-, and R&D-intensive indus-tries. In industries with greater than median levels of capital intensity, the distribution of agglomeration indices is rightward-shifted for MNC for-eign subsidiaries compared to domes-tic plants. This pattern is similarly observed for industries with greater than median levels of skilled labor and R&D intensities.We also evaluate how agglomeration economies, par-ticularly input-output linkages, labor and capital goods market externali-ties, and technology diffusion, affect MNCs relative to domestic firms. We find that MNCs’ choice of location is significantly influenced by technol-ogy diffusion and capital-good mar-ket externalities.
These findings are largely consis-tent with the MNCs’ vertically inte-grated organizational form and sub-stantial investment in technology and capital goods, as well as with the increasing segmentation of activities within firm boundaries and increas-ingly complex sourcing strategies.
Intra-Industry FDI
Andrew Charlton and I show that large FDI flows across rich coun-tries associated with these more com-plex strategies do not fit the
tra-ditional classification of horizontal FDI.3 Although patterns of foreign
investment are recognized as com-plex, the literature has tradition-ally, for analytical simplicity, dis-tinguished between two forms of, and motivations for, locating activi-ties abroad: horizontal — replicating a subset of activities or processes in another country, and vertical — frag-menting production by function. In general, market access models are favored empirically over comparative advantage models. Our results sug-gest that data limitations have led the prior studies to underestimate verti-cal FDI systemativerti-cally.
We use a combination of four-digit, sector-level information from the WorldBase data together with input-output tables to distinguish between horizontal and vertical FDI. We classify a horizontal subsidiary as a plant in the same sector as its foreign parent owner, and a verti-cal subsidiary as a plant in sectors that are inputs to the foreign par-ent’s product. As we do not observe interplant trade, this approach infers vertical relations from information about the goods produced in each establishment and their input-output relationships. While we acknowledge its limitations, this method yields a large amount of data for many coun-tries and induscoun-tries and avoids
con-cerns about transfer pricing affect-ing values.
We find that the bulk of MNC activity occurs between rich nations, but some of our plant-level findings provide a new perspective that goes beyond this traditional wisdom. Many vertical subsidiaries, which we find are larger than commonly thought, are located in sectors related to higher skill input in high-skill countries. These subsidiaries have been assumed to be market seeking.4 We term such
higher, on average, between two verti-cally related plants than between two randomly selected ones.
Firm Boundaries and
Organizational Choices
Value Chains
Pol Antràs, Davin Chor, Paola Conconi, and I examine firms’ orga-nizational choices along value chains and their key decisions regarding which segments of the production process to own and which to out-source.5 We combine WorldBase data
on firm activities across many coun-tries and induscoun-tries with information from standard input-output tables to study the differences between value chains for integrated and
non-integrated inputs. We construct an indus-try-pair specific measure of the position of differ-ent industries along the value chain that summa-rizes the extent to which a firm’s integrated inputs tend to be more upstream compared to its non-inte-grated inputs.
We develop a rich theoretical framework of firm behavior amenable to estimation using firm-level data.6 In an
incom-plete-contracts setup in which the manufacture of final goods entails a large number of produc-tion stages performed in a predetermined order, sup-pliers engaged in different stages undertake
relation-ship-specific investments. The divi-sion of surplus between the final-good producer and each supplier is gov-erned by bargaining after inspection of the completed stage. We allow for heterogeneity in the importance of inputs for production as well as in sup-pliers’ marginal cost of production at different points along the value chain.
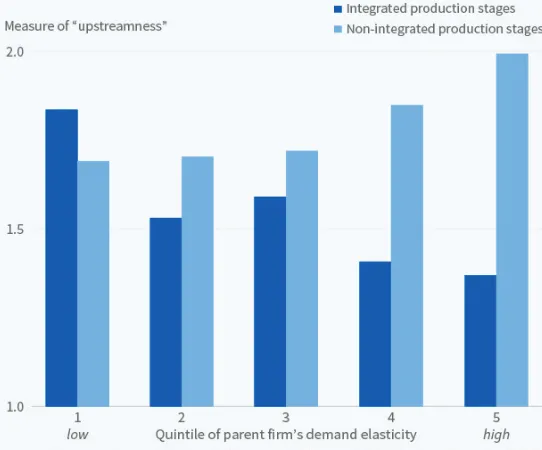
We find that a firm’s propensity to integrate upstream inputs depends critically on the elasticity of demand for its final good and the elasticity of substitution across its production stages. When demand is elastic or inputs are not particularly substitut-able, input investments are sequen-tial complements; the greater the upstream supplier’s investments, the greater that supplier’s marginal incen-tive to undertake relationship-specific investments. In this case, it is optimal to contract at arm’s length to incen-tivize upstream suppliers’ investment efforts and integrate the stages fur-thest downstream to capture surplus. When demand is inelastic or inputs are sufficiently substitutable, input investments are instead sequential
substitutes. In this case, firms choose to integrate relatively upstream stages and outsource downstream suppliers. Figure 2 illustrates these patterns for different quintiles of the parent firm’s elasticity of demand.
In our model, greater upstream use of contract arrangements reduces a firm’s need to rely on
organiza-tional arrangements to elicit the right incentives from suppliers positioned at early stages. We construct a mea-sure of input contractibility for each industry and find that a greater degree of contractibility of upstream inputs increases the likelihood that a firm facing high elasticity of demand will integrate upstream inputs. These empirical patterns provide strong evi-dence that the position of inputs in the production process and contrac-tual frictions critically shape a firm’s integration choices.
Prices and Vertical Integration
The impact of market conditions, in particular prices, on firms’ orga-nizational choices is a long-standing
question in organizational economics. In a recent paper, Conconi, Harald Fadinger, Andy Newman, and I find strong support for the view that output prices are a key determi-nant of vertical integra-tion.7 This result stems
from managers not only having a stake in the orga-nizational goal, but also standing to derive pri-vate, non-contractible benefits.8 Suppose that
integration increases pro-ductivity, but at a cost; improved coordination among suppliers, for example, could engender administrative costs inde-pendent of output and product price. A price-taking firm would choose to integrate only if the ben-efits of increased profitability out-weigh the cost of integrating. At low prices, productivity gains from inte-gration are seldom sufficiently valu-able to justify the cost. As the mar-ket price rises, the tradeoff resolves in favor of more integration.
NBER Reporter • 2016 Number 3 17 an exogenous source of price
varia-tion. Trade policy provides one such source, since the degree of trade pro-tection obviously affects equilibrium prices, but it is unlikely to be influ-enced by firms’ vertical integration decisions. Under the most favored nation (MFN) principle set out in the General Agreement on Tariffs and Trade (GATT), member coun-tries agree not to discriminate among trading partners, with some excep-tions. Long-term multilateral trade negotiations render MFN tariffs less responsive to domestic political pres-sure. Reverse causality is also unlikely to be a concern in our analysis as the MFN tariffs that firms faced in 2004, the year we examine, were determined during the Uruguay Round of multi-lateral trade negotiations (1986–94). Combining information on firms’ production activities drawn from WorldBase with input-output tables, we construct firm-level vertical inte-gration indices that measure the frac-tion of inputs used in the producfrac-tion of a final good that can be produced in-house.
We find that the higher the tar-iff on imports of a given product, and thus the higher the domestic price, the more vertically integrated are the firms that produce the product in that coun-try. The effect is larger precisely where organizational decisions ought to be more responsive to import tariffs — for firms that serve only the domestic mar-ket and in sectors in which tariffs have a greater impact on domestic prices. We rule out several alternative mech-anisms that could generate a positive correlation between tariffs and verti-cal integration, such as competition and credit constraints. Our estimates imply that price changes can have large effects on firm boundaries. Contrary to the direction of causality suggested by foreclosure theories, whereby ver-tical integration raises prices as firms integrate with their suppliers to reduce competition, our analysis suggests that higher prices may induce more vertical integration.
Effects of Multinational
Firms Productivity,
Selection, and Reallocation
The impact of MNCs on their host countries has been widely stud-ied.9Positive gains from MNC
activ-ity are often attributed to within-firm productivity improvements resulting from productivity spillover from for-eign MNCs to domestic firms, or from self-upgrading by domestic firms. But MNC production can also precipitate more intense competition in product and factor markets, as well as reallo-cation of resources from domestic to multinational firms and from less pro-ductive to more propro-ductive domes-tic firms. Although both channels imply aggregate productivity gains, they represent two distinct margins. Within-firm productivity improve-ment operates through an “intensive margin” where foreign production increases the productivity of domes-tic firms that persist, while between-firm selection and market realloca-tion operates at an “extensive margin” where foreign competition induces the exit of the least productive firms. The implications for domestic econo-mies are also sharply different: growth or contraction of domestic industries. My recent work with Chen dis-entangles the two channels in deter-mining aggregate productivity gains from MNC production.10 We
inves-tigate the ways market reallocation and knowledge spillovers influence po


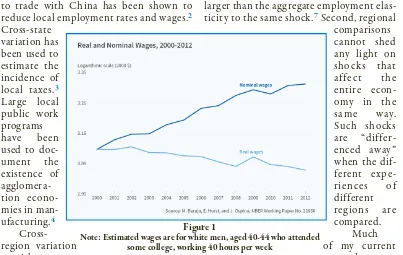
![Figure 1.]In new work with Martin Beraja data sources, we show that states with the largest rela-tive employment declines had the smallest relative wage increases](https://thumb-ap.123doks.com/thumbv2/123dok/1639316.1558827/21.612.181.434.261.454/figure-beraja-sources-employment-declines-smallest-relative-increases.webp)
