Vol.6 (2016) No. 5
ISSN: 2088-5334
Retinal Microaneursym Detection using Maximally Stable
External Region Algorithm
Diana Tri Susetianingtias
#, Sarifuddin Madenda
*, Dewi Agushinta Rahayu
#, Rodiah
##
Department of Informatics, Gunadarma University, Margonda Raya Street, Depok, 16424, Indonesia E-mail: {diants, dewiar, rodiah}@staff.gunadarma.ac.id
* Doctoral Program in Information Technology, Gunadarma University, Margonda Raya Street, Depok, 16424, Indonesia E-mail: [email protected]
Abstract— The growth of diabetics’ worldwide increased drastically. Diabetic can cause blindness due to retinopathy diabetic. Often the patients of retinopathy diabetic do not experience the sign and the symptoms at early stage of their symptoms, even in the severe stages where the bleeding start to occur. One indicator of patients that has diabetic retinopathy can be seen from the blood vessel that experienced microaneurysm and hemorrhage due to a swelling blood vessels in the retina. The study in this paper will implement the Maximally Stable External Region (MSER) algorithm to detect microaneursym. Microaneursym is one of the main indicators that causes retinopathy diabetic. This study uses HRF dataset. The results are expected to improve the accuracy microaneursym detection.
Keywords— Fundus Image; Gaussian Filter; Histogram Equalization; Microaneursym
I. INTRODUCTION
There is no official data for the patients with retinopathy diabetic in Indonesia yet. In a survey conducted by Household Health Ministry of Health of Indonesian Republic in 1995, this disease has not been defined and still registered in Indonesian blindness database (with around 28% of data regarding the blindness). From all the data of the patients that visit the Eye Polyclinic of RSCM (One of the largest central hospital in Indonesia), the number of the patients with diabetic retinopathy increased from 2.4 percent in 2005 to 3.9 percent in 2006. The World Health Organization (WHO) in 2004 reported 4.8 percent of people worldwide become blind due to diabetic retinopathy. Diabetic retinopathy informed in 4th position after cataract, glaucoma, and macular degeneration (AMD = age-related macular degeneration) [1]. One indicator of a person suffering from diabetic retinopathy can be seen from the occurrence of microaneursym on the retina. Microaneursym can be seen and detected through the examination with fundus camera (ophthalmoscope). It is wide-ranging of retina focal point and the capillaries appear as small round dark red dots. The increased number of microaneurysms indicates the degree of disease (staging).
The difficulties to see microaneurysms in retina are due to the similarity of color composition of diabetic retinopathy symptom with the color located around the retina [2].
Previous study classified some diabetic retinopathy symptom by using Bayesian method for the symptoms classification [3]. The training set of the data contain segmented images that prepared by the specialists. The training was executed using a random subset of the image pixels. Only a small part (window) from sample image that were manually segmented. The labeled pixel are used to train the classifier which will be applied for the same image segmentation. This strategy can be developed into fundus semi-automatic segmentation software, in which the operator only draw a small portion of the vessel or select a small section of the image as a vessel. Then the system (software) will segmented the pixels of all the images [3].
of optic disc were conducted by watershed transformation [4]. Another study evaluated the trace of blood vessels network trace in fundus image to find the indicator symptoms of diabetic retinopathy. Morphological operations were employed to extract the blood vessels. The data images for the experiments were obtained from DIARETDB1 Database. The initial estimation of the results showed there are a lot of noises in blood vessels network. Moreover, there are still many faults in retina edge detection. Image enhancement operations were carried out to eliminate retinal boundaries. This process is conducted by performing edge detection on the green channel image using morphological operations of erosion and closing. Edge detection was performed to obtain the retinal boundaries [5].
The patients of retinopathy often do not experience the signs and symptoms even in the stage of bleeding in the retina that causes the patient complained of seeing floaters (the shadow hovering black objects that follow the movement of the eyes) or to complain about clogged vision suddenly [1]. A direct medical examination and observation of patients with diabetic retinopathy is done by a doctor via ophthalmoscope examination. The imaging results will produce retinal fundus image in which the retinal image has many blood vessels in many areas, making it difficult to distinguish between normal and abnormal regions of the retina. The requirement to set the appropriate threshold values for edge detection in microaneursym is important. Since the threshold can clarify and eliminate the drawbacks of the optic disc that were used in some previous studies. The experiments in this study proposed Maximally Stable External Region (MSER) algorithms to detect and segment microaneursym. Microaneursym is one of many characteristics that indicate the symptoms of diabetic retinopathy. This algorithm is expected to help the doctor to detect microaneusym rapidly and accurately.
II. MATERIAL AND METHODS
Microaneursym is an area shaped as small pockets bulging in the blood vessels in the retina. Because of its small size, microaneurysms is difficult to see directly. The growth of microaneursym occurs continuously causes blockage of the blood vessels that nourish the retina. Partially blocked blood vessels rupture resulting in the emergence of other characteristics; (i) dot and (ii) blot hemorrhages.
A. Retinal Fundus Dataset
In this study the images from the High-Resolution Fundus (HRF) Image Database are used. The images are taken using a fundus camera Canon Cr-1 with the angle of 45 ° field of view (FOV). The sizes of the images are 768 × 584 pixels with the composition [6]:
1. 15 normal retinal images
2. 15 images with diabetic retinopathy disorders
Figure 1 shows an example of the ideals fundus images used in this study [7]:
Fig. 1. Fundus Image [6]
B. Gaussian Filter
In general, the process to detect microaneursym retinal fundus image begins with reading the fundus image and then perform grayscale image. Fundus image is a color image, therefore for detecting microaneursym, a grayscale image detection method is carried out to obtain the gray-level levelling the histogram. In this study, a Gaussian filter [8] is used to categorize the image using Equation (2)
)
σ
= standard distribution deviation function, where the center of the distribution lies on x arsisx
=0 (mean=0)C. Equalization Histogram
in grayscale image resulting the color object image faded away. On the contrary, the high contrasted image will have histogram components that distributed evenly throughout the range of grey level image. The images that have more detailed greyish level will have wider dynamic range. Moreover, these images occupied almost all the possibility of the image grey level. Their pixels are distributed evenly in all the images. Thus these images will make the interpretation process run smoothly.
Histogram equalization is a technique to adjust the pixel values in order to create images with better contrast. This technique is totally dependent on the histogram. The histogram can be a continuous function, with r is a variable that stated the gray level image and has been normalized on the interval [0, 1]. The example can be seen in Figure 2 with
r = 0 is black and r = 1 is white. Finally a discrete histogram function is sought and pixel values will fall on the interval [0-L-1]. L is the number of the intensity possibility. For 8-bit image, the grayscale L = 28 = 256. For all r value that qualified, a s transformation can be found as in the equation below to generate a histogram that has been equated averaged (equalize) with the boundary condition 0 ≤r≤ 1.
Fig. 2. Fundus Image Equalitation Histogram
D. Binarization
Finding the microaneursym in fundus image is a very important task. This step is carried out after performing histogram equalization of fundus image. It is important since microaneursym is one of diabetic retinopathy characteristics. To address the problems of finding microaneursym, it is necessary to get back on the results of the original fundus images where microaneursym has a very low intensity or black, while the objects that are in the fundus image has higher intensity than microaneursym. This shows that binary image process can be applied in retinal fundus image. Binary algorithm for fundus image that are obtained from histogram equalization derived from these following steps:
1. Determining the value of threshold T to distinguish the intensity between other objects in retina with
The experiment in this study use T accordance with the maximum intensity value of microaneursym (i.e., T = 15).
E. Optic Disc Elimination Process
One of the difficulties in microaneursym color intensity detection is the similarity between microaneursym colors with other parts of the retinal. Furthermore, the unwanted occurrence of optic disc inside retinal fundus image objects also interrupts retinal microaneursym detection. The appearances of optic disc pixels are considered as noise thus need to be removed from the fundus image.
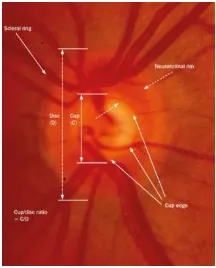
Optic disc or optic nerve head is the location to respond the stimulus of the light. This leads to one point in the visual field of the fundus image so-called blind spot [10]. Normal cup to disc ratio (the diameter of cup divided by the overall diameter of the optic disc) is about 1/3 or 0.3 [11]. There are several variations of normal cup; (i) with some people hardly have a cup (i.e., having a cup to disc ratio is 1/10 or 0.1) and (ii) others that have a cup to disc ratio of 4/5 or 0.8 [11]. Optic disc of image can be seen in Figure 3.
Fig. 3. Optic Disc of Fundus Image [11]
The elimination of optic disc is done by examining pixels (P) by pixel (from left to right side and from top to the bottom of the fundus image) to identify the areas of connected pixels (conn). The connected area of pixel is an area of the pixel‘s borders that have the same intensity or the same intensity values within a set of V (in binary image V = {1}) [12].
F. Feature Microaneursym Detection with Maximally Stable External Region Approach
The next step after performing fundus image histogram equalization is to determined microaneursym on fundus retinal images. The experiments in this paper detect the microaneursym using Maximally Stable External Region method. This method is a collection of different images regions that were detected from grey scales images. All regions in fundus image will be defined as an external property of the intensity function in the region and above the outer region limits.
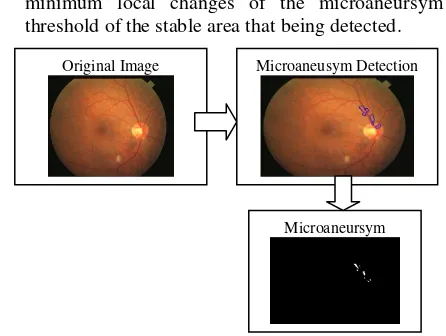
In general the process of microaneursym segmentation processes can be seen in Figure 4. This algorithm will detect microaneursym in continuous geometry transformation locally and invariant toward the changes in the pixels intensity of fundus image. The algorithms work as follow:
1. Sort the pixels based on image intensity 2. Place the pixels in the image
3. Update the structure of related components
5. For all the connected components, count the minimum local changes of the microaneursym threshold of the stable area that being detected.
Fig. 4. Microaneursym Segmentation Process
III.RESULTS AND DISCUSSION
The result from segmentation steps are compared with doctor’s observations. The images that being compared in segmentation step are the original retinal and the segmented retinal image. The next step is to compute the microaneurysms candidate of the original image manually and then the original image that already being segmented is checked. The ophthalmologists will verify the analysis of fundus retinal image conventionally. The result of segmented microaneursym image can be seen in Table 1 below. These results are based on maximally stable external region.
TABLEI
THE RESULT OF SEGMENTATION PROCESS USING MSER
Mikroaneursym Detection Microaneursym Image
As can be seen in Table 1, the experiments for microneursym detection using maximally stable external region successfully detect the microneursym of fundus image. One of the causes for illumination differences in fundus image detection is the emergence of noise. The noise will disturb the segmentation process thus it is very important to eliminate or at least to reduce the noise. . By removing the noise, the obtained retinal images consists not only images that have prominent image contours but also narrow image objects to detect microaneursym.
Original Image Microaneusym Detection
IV.CONCLUSIONS
The implemented algorithms were able to detect small areas on the retinal blood vessels, especially in areas that experienced microaneursym. The experiments showed changes in the values of contrast will give effects to the precise degree of retinal image microaneursym detection’s result. The level of detection’s accuracy depends on the value changes. For example if the value of the contrast is small, the microaneursym that going to be segmented is less. For further research we plan to add some different symptoms related to diabetic retinopathy indications. One of the indications is to detect the blood vessel that experienced venous beading due to the abnormalities in intra retinal micro vascular.
ACKNOWLEDGMENT
We are indebted to the experts who have contributed towards development of the template.The authors would like to acknowledge to Gunadarma University, dr Rakhma Indria Hapsari.,SpA from Awal Bros Hospital Tangerang (Ophtamologist), Research Center of Medical-Informatics of Gunadarma University
REFERENCES
[1] Aparna.A, Prof I Muthumani. Optical Character Recognition for Handwritten Cursive English Characters. International Journal of Computer Science and Information Technologies. Vol 5(1). 847-848. ISSN : 0975-9646. 2014
[2] Chew EY,Ferris FL III. Nonproliferative Diabetic Retinopathy. In. : Ryan SJ, Hinton DR, Schachat AP(eds) Retina, Vol.2. Medical Retina. Mosby. St.Louis. 2001
[3] D.J. Cornforth, H.J. Jelinek, J.J.G. Leandro, J.V.B. Soares, R.M. Cesar,Jr., M.J. Cree, P.Mitchell, and T. Bossomaier. Development of
retinal blood vessel segmentation methodology using wavelet transforms for assessment of diabetic retinopathy. 2005
[4] Divya SN. Detection of Diabetic Retinopathy using Kirsch Edge Detection and Watershed Transformation Algorithm. International Journal Of Advance Research, Ideas and Innovations In Technology. Volume 1, Issue 2. ISSN : 2454-132X. 2015
[5] A.S. Jadhav and Pusphpa B. Patil. Classification Of Diabetes Retina Images Using Blood Vessel Area. International Journal on Cybernetics and Informatics (IJCI) Vol 4 No. 2. 2015
[6] Thomas Köhler, Attila Budai, Martin Kraus, Jan Odstrcilik, Georg Michelson, Joachim Hornegger. Automatic No-Reference Quality Assessment for Retinal Fundus Images Using Vessel Segmentation, 26th IEEE Internatioal Symposium on Computer-Based Medical Systems 2013.
[7] Jan Odstrcilik, Radim Kolar, Attila Budai, Joachim Hornegger, Jiri Jan, Jiri Gazarek, Tomas Kubena, Pavel Cernosek, Ondrej Svoboda, Elli Angelopoulou,. Retinal vessel segmentation by improved matched filtering: evaluation on a new high resolution fundus image database. IET Image Processing. Volume 7, Issue 4 pp.373-383.DOI: 10.1049/iet-ipr.2012.0455. Print ISSN 1751-9659, Online ISSN 1751-9667. 2013
[8] Raju Sahebrao Maher, Dyaneshwar Panchal, Jaypalsing Kayte. Automatic Diagnosis Microaneursym Using Fundus Images.International Journal of Adbanced Research in Computer Science and Software Engineering.ISSN : 227 128x. Volume 5, Issue 10. 2015
[9] William K. Pratt. Introduction to Digital Image Processing. ISBN : 1482216698.EAN. 9781482216691.Productivity PR Inc. 2013 [10] Brad Bowling, Kanskis's Clinical Ophthalmology A Systematic
Approach, Eighth Edition, ISBN: 978-0-7020-5572-0, Elsevier, Sydney, New South Wales, Australia. 2016
[11] Rahul Chakrabarti, C Alex Harper and Jill Elizabeth Keeffe. Diabetic Retinopathy Management Guidelines. Expert Rev.Ophthalmol. 7(5), 417-439. 2012
![Fig. 1. Fundus Image [6]](https://thumb-ap.123doks.com/thumbv2/123dok/1724163.1576184/2.595.332.531.52.188/fig-fundus-image.webp)