ISSN: 2339-076X, Volume 2, Number 2 (January 2015): 271 - 280
DOI:10.15243/jdmlm.2014.022.271
Research Article
Effects of biochar and crop residues application on chemical properties
of a degraded soil of South Malang, and P uptake by maize
B.D. Satriawan
1*, E. Handayanto
21Postgraduate Program, Faculty of Agriculture, Brawijaya University, Jl. Veteran, Malang 65145, Indonesia. 2
IRC-MEDMIND, Brawijaya University, Jl. Veteran, Malang 65145, Indonesia.
*corresponding author: [email protected]
Abstract:
Low productivity of food crops on marginal dry lands of South Malang, East Java occurs due to low levels of soil fertility in the region due to low soil organic matter content and low content of available P. The purpose of this study was to evaluate the effect of the combination of biochar and plant litter on chemical properties of a degraded soil of South Malang, and P uptake by maize. The treatments tested in this study was a combination of types of biochar (sugarcane litter biochar and maize litter biochar), and the type of fresh litter (sugarcane and maize). Biochar doses applied were 0, 20 and 40 t biochar / ha, whereas the doses of fresh litters applied were 0, 40, and 80 t litter / ha. Three maize seed of BISI 2 variety was grown in each pot (treatment) for 49 days. Nine treatments were arranged in a completely randomized design with three replications. The results showed that application of litter and biochar tended to lower pH, CEC, exchangeable Ca, and total P the soil studied. The interaction of litter and biochar did not significantly increase P availability in the soil. However, application of litter and biochar also increased P uptake by maize. The best treatment for maximum increase of P availability and uptake of P was application 80 t sugarcane fresh litter / ha and 40 t maize litter biochar / ha.Keywords:biochar, calcareous soil, maize, organic matter
Introduction
Critical lands in the Brantas river basin that are scattered in Malang, Blitar, Tulungagung, Kediri, Jombang, Nganjuk, Mojokerto and Pasuruan, cover162 819 hectares or 12.48% of the total area of degraded land in East Java. In the critical dry land are in Malang, maize, sweet potatoes, and cassava are widely cultivated crops, despite the low production. This occurs due to low levels of soil fertility in the region due to low soil organic matter content (less than 1%), and low content of available P. Improvement of soil fertility can actually be done by addition of inorganic fertilizers into the soil. However, the limitations of socio-economic conditions of local communities make them less able to buy inorganic fertilizers. Improvement of soil fertility in the region can also be done by adding organic matter, either in the form of commercial compost, manure and crop residues. It is known that organic material has two main functions, namely the
direct supply of nutrients through the decomposition process, and indirectly increase the levels of soil organic matter that can improve soil physical properties and regulate the supply of nutrients at a later date (Handayanto et al., 1994 ). However, the type of organic material that is popular in the community, such as crop residues, its availability is very limited and must compete for animal feed. Moreover, the addition of plant litter continuously to maintain soil fertility can increase the amount of carbon emissions into the atmosphere because of the decomposition of organic material (Widowati et al., 2011). Therefore, it required an effort to reduce carbon emissions due to the decomposition of organic matter and at the same time maintaining soil fertility.
stated that the soil treated with biochar showed consistently C content increase and was more stable than the soil that was not treated with the addition of biochar. Yamato et al. (2006) revealed that biochar can lead to changes in physical and chemical properties of the soil that resulted in the increased nutrient availability in the soil and increase plant root colonization by mycorrhizal fungi. According to Lehmann et al. (2003), biochar addition can improve plant productivity directly because of its nutrient content and release characteristics, or indirectly, through improved nutrient retention. However, due to the nutrient content in biochar is low (Lehman, 2007), the improvement of soil fertility using biochar needs to be accelerated by adding fresh organic material (not biochar).
The purpose of this study was to evaluate the effect of the combination of biochar and plant litter on chemical properties of a degraded soil of South Malang, and P uptake by maize.
Materials and Methods
Biochars used in this study were made from sugar cane and maize crop residues obtained from the Bululawang District of Malang. Air-dry crop residues were incorporated into the pyrolysis reactor at a temperature of 1200C for 18-24 hours. Results of biochar chemical composition analysis were as follows: maize biochar: pH 9.35, available P 0.35 mg / kg, sugarcane biochar: pH 9.30, available P 0.30 mg / kg. Biochar and the maize and sugar cane litters that had been oven dried (60° C for 72 hours), were ground to pass through a 2 mm sieve.
The treatments tested in this study were combinations of types of biochar (sugar cane litter biochar and maize litter biochar), and the type of fresh litter (sugarcane and maize litters). Biochar doses applied were 0, 20 and 40 t biochar / ha, whereas the doses of organic matter (fresh litter) applied were 0, 40, and 80 t of litter / ha (Table 1). Each combination of biochar and fresh litter was then added into 5 kg of air-dried topsoil air and placed in a plastic pot. Determination of biochar dose referred to the study of Zhang et al. (2011) while the litter dose determination referred to the study of Rachman et al. (2008).
Soil used for this study was an Alfisol collected from the Bululawang District of Malang Regency. The soil has the following characteristics: pH 7.14, available P 4.31 mg / kg, Ca 20.60 cmol / kg, CEC 10.71 cmol / kg, P total 384.45 mg / kg, 31.87% base saturation. After incubation for seven days, three maize seeds of BISI 2 variety were planted in each plot and
grown for 49 days. Nine treatments were arranged in a completely randomized design with three replications. During growth, the water supplied periodically to ensure that the growth of maize was not limited by the availability of water. At the age of 7, 14, 28, 35, 42, and 49 days, measurements were made for soil chemical properties (pH, CEC, exchangeable Ca, available P, total P, and C organic, and plant growth (plant height). Plant dry weight and P uptake was measured at the age of 49 days. The data obtained were analyzed using Anova and the F test (P <5%) followed by LSD test.
Table 1. Treatments tested in the study
Treatment Description
A0B0 Control (without the addition of biochar and fresh litter)
A0B1 20 sugarcane litter biochar / ha A0B2 40 t maize litter biochar / ha A1B0 40 t maize fresh litter / ha A1B1 40 t maize fresh litter / ha + 20 t
sugarcane litter biochar / ha A1B2 40 t maize fresh litter / ha + 40 t
maize litter biochar / ha A2B0 80 t sugarcane fresh litter / ha A2B1 80 t sugarcane fresh litter / ha + 20
t sugarcane litter biochar / ha A2B2 80 t sugarcane fresh litter / ha + 40 t
maize litter biochar / ha
Results and Discussion
Soil pH
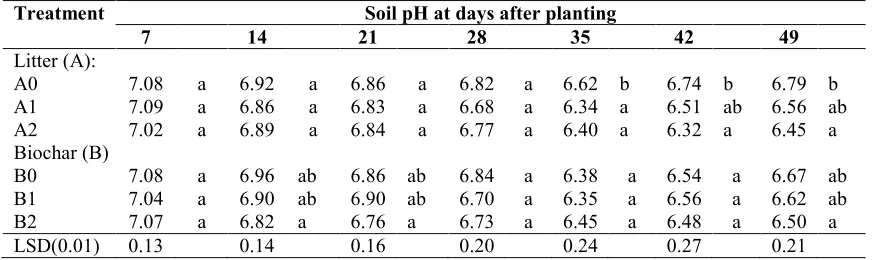
The results showed a decrease in the pH of the soil due to biochar (B) and fresh litter (A) treatments. The highest pH values of all treatments occurred at the beginning of 7 days after planting then the pH decreased during the period of 35 and 42 days after planting. The soil pH increased again after a period of 42 days (Table 2). In the treatment without fresh litter (A0), the highest pH was observed in the period of 35 days after planting with the addition of 40 t maize litter biochar / ha (treatment A0B2). Application of 40 t sugarcane fresh litter / ha without biochar (treatment A1B0) and application of 40 t maize litter biochar / ha without fresh litter (treatment A0B2) generated the lowest pH at 35 days.
(A1B0) reduced greater soil pH than the A0B0 and A1B2 treatments, while the addition of fresh litter dose (A2) with B1 and B2 generated the same pattern of decrease in pH of the A2B0. The pH decline observed for A2 treatment was similar to that observed for B0, B1, and B2 treatments. This might be due to the decomposition of litter that produced volatile organic compounds, while
organic compounds of biochar were stable. Based on the analysis of variance, application of fresh litter decreased the pH in the periods of 35 to 49 days after planting. Application of biochar in the periods of 14, 21 and 49 days after planting also significantly decreased the soil pH. There was no significant interaction effect of the treatments on the pH decrease.
Table 2. Effects of application of biochar and fresh litter on soil pH
Treatment Soil pH at days after planting
7 14 21 28 35 42 49
Litter (A):
A0 7.08 a 6.92 a 6.86 a 6.82 a 6.62 b 6.74 b 6.79 b
A1 7.09 a 6.86 a 6.83 a 6.68 a 6.34 a 6.51 ab 6.56 ab
A2 7.02 a 6.89 a 6.84 a 6.77 a 6.40 a 6.32 a 6.45 a
Biochar (B)
B0 7.08 a 6.96 ab 6.86 ab 6.84 a 6.38 a 6.54 a 6.67 ab
B1 7.04 a 6.90 ab 6.90 ab 6.70 a 6.35 a 6.56 a 6.62 ab
B2 7.07 a 6.82 a 6.76 a 6.73 a 6.45 a 6.48 a 6.50 a
LSD(0.01) 0.13 0.14 0.16 0.20 0.24 0.27 0.21
Remarks: The number followed by the letter and the same column are not significantly different at the 1% level LSD
Results of further statistical test indicated that application of 80 t maize fresh litter / ha (A2) decreased the soil pH by 6.23% at 42 days whish was greater that at 35 days (3.26%) and that at 49 days after planting (5.04%). Application of 40 t maize litter biochar / ha (B2) yielded a pH of the third lowest in the observation period, but it did not differ between treatments (Table 2). This was probably caused by the content of CaCO3 in
calcareous soil that produced hydrolyzed carbonic acid and the release of negatively charged hydroxyl groups.
According to Cheng et al. (2006), abiotic oxidation reaction occurs more frequently than biotic oxidation at the beginning of the period of biochar that creates a negative charge. Another factor that generated the pH decrease might be the temperature used in the pyrolysis process. Novak et al. (2009) stated that the pyrolysis process at a temperature of 5000C has a surface area, pH, and ash content that are greater than the pyrolysis temperature of 2500C. Raw materials and pyrolysis temperature levels can produce differences in physical form as well as the chemical structure of biochar. Biochar contribute to nutrient uptake through the exchange or covalent interactions in the surface area of biochar (Verheijen et al., 2010). Thermo chemical processes in the pyrolysis produce solid material (charcoal), gas, liquid or oil. In addition, pyrolysis affects the physical, chemical and biological properties of biochar. According to Steiner et al.
(2007), the decrease in pH associated with the addition of biochar is caused by a decrease in the concentration of alkali metal oxides (e.g., Ca2+, Mg2+ and K+). Steiner (2007) also stated that that increasing pyrolysis temperature of about 5250C could add surface area (1.8 to 56 m2/g); CEC decrease (from 16.2 to 5.2 cmol / kg).
The linkage between the temperatures of the resulting biochar products will affect the reduction of P adsorbed by Ca due to increased acid group. The higher the acid groups, the lesser is the amount P anion adsorbed by Ca. Soil organic C content can affect soil pH. The decline in soil organic C content is followed by a decrease in soil pH. Soil organic carbon as a constituent of organic compounds acts as chelating agent. The organic compounds with high molecular weight will compete to bind bases thus affecting solute concentration in the soil.
Soil cation exchange capacity
maize fresh litter / ha without biochar (A2B0 treatment) resulted in the lowest CEC.
The CEC value showed a decrease by 25% of the CEC control. Interaction of biochar and fresh litter significantly affected the decline soil CEC. The decline of CEC due to the effect of litter occurred in the period of 35 days after planting. Interaction effect was also seen in 35 and 42 days after planting. Results further statistical tests on the effect of fresh litter showed that application of 80 t maize fresh litter /ha without biochar (A2B0 treatment) resulted in the highest decrease of CEC at 35 days that was significantly different from A1B0 treatment and control. The test results also indicated that A1B1 treatment had the lowest CEC at 35 days that was
different with A0B0; A0B1; A0B2; A1B0; A1B2; A2B1; A2B2, A2B0 treatments but it was not different with them at 49 days. The A1B2 treatment resulted in the lowest CEC and different with A0B0; A0B1; A02; A1B1; A2B1 and A2B2 treatment, but it was not different with A1B0 and A2B0 treatments (Table 3). Increasing doses of fresh litter also affected soil CEC. Application of 40 t maize fresh litter / ha (A1B1 treatment) to 80 t maize litter biochar / ha (A1B2 treatment) resulted in the lowest CEC. This happened because the release of organic compounds in which there are elements of C and H that may affect the cation exchange capacity of the negative charge due to the addition of new functions such as Ca2+adsorb bases.
Table 3. Effects of application of biochar and fresh litter on soil CEC
Treatment CEC (cmol/kg) at days after planting
7 14 21 28 35 42 49
Litter (A):
A0 40.00 a 40.61 a 39.47 a 39.85 a 39.14 b 37.63 a 40.22 a
A1 40.26 a 41.28 a 40.51 a 40.03 a 33.44 ab 32.14 a 39.70 a
A2 40.66 a 41.59 a 39.95 a 40.67 a 32.94 a 36.71 a 41.31 a
Interaction:
A0B0 41.60 a 40.47 a 39.33 a 40.08 a 41.60 e 41.22 e 40.85 a A0B1 39.60 a 40.32 a 39.97 a 41.84 a 38.51 de 35.14 cd 40.72 a A0B2 38.79 a 41.03 a 39.11 a 37.63 a 37.32 de 36.54 cd 39.07 a A1B0 38.75 a 40.97 a 40.62 a 38.44 a 33.15 bc 33.84 ab 40.68 a A1B1 40.19 a 39.82 a 38.67 a 39.44 a 29.87 a 34.85 bc 39.04 a A1B2 41.85 a 43.04 a 42.24 a 42.21 a 37.31 de 27.74 a 39.36 a A2B0 39.72 a 41.73 a 38.67 a 41.31 a 31.48 ab 33.44 ab 41.65 a A2B1 41.58 a 41.58 a 42.24 a 40.78 a 32.22 bc 40.01 de 39.61 a A2B2 40.67 a 41.46 a 38.94 a 39.90 a 35.11 bcd 36.67 d 42.66 a
LSD(0.01) 4.39 4.10 3.25 6.65 4.57 6.09 3.26
Remarks: The numbers in the column followed by the same letter are not significantly different at the 1% level LSD
Organic materials and biochar have functional groups such as hydroxyl, carboxyl and other functional binding elements or compounds in the soil due to their negative charged. The functional group binds to Ca on the outer side of the structure of biochar (Novak et al., 2009). Decomposition of organic matter to produce compounds that formed on the main elements C, H and O. The presence of Ca in the form of Ca mineral apatite or butite Ca for example, in calcareous soils when it reacted with compound decomposition products will liberate phosphate because Ca ions in the cation exchange complex will be replaced by H ion.
Soil exchangeable Ca
Data presented in Table 4 show that application of fresh litter and biochar reduced the solubility of
with that of B2 and B0 treatments (Table 4). This seemed likely to be due to the influence of the initial decomposition and the presence of organic compounds and products of litter biochar. Early stages of litter decomposition produces small
amount organic compounds and oxidation reactions that only occur at the outer surface of the biochar negative charge (OH group) bind Ca cation produced.
Table 4. Effects of application of biochar and fresh litter on soil exchangeable Ca
Treatment Exchangeable Ca (cmol/kg) at days after planting
7 14 21 28 35 42 49
Litter (A):
A0 16.57 a 16.59 a 16.42 a 16.48 a 16.48 a 16.42 a 16.46 a
A1 16.59 a 16.63 a 16.50 a 16.39 a 16.36 a 16.23 a 16.02 a
A2 16.63 a 16.81 a 16.70 a 16.74 a 16.24 a 16.20 a 16.46 a
Biochar (B):
B0 16.58 a 16.65 a 16.52 a 16.49 a 16.07 a 16.07 a 15.85 a
B1 16.53 a 16.63 a 16.50 a 16.46 a 16.31 a 16.40 a 16.06 a
B2 16.68 a 16.75 a 16.60 a 16.65 a 16.69 a 16.72 a 16.46 a
LSD(0.01) 0.51 0.56 0.57 0.71 0.63 0.77 0.63
Remarks: The numbers in the column followed by the same letter are not significantly different at the 1% level LSD
Soil total P
Litter and biochar treatments reduced the total P content (Table 5). The A0B2 (40 t maize litter biochar/ ha with biochar) and A1B0 (40 t sugarcane fresh litter / ha without biochar) treatments yielded the lowest total P at 35 days after planting. Application of 80 t maize fresh litter / ha of (A2) without litter resulted in the higher decrease of P total than that of B1 and B2 treatments (Table 5). This was because the releasing compounds or single element of decomposition was more volatile and there was no
competition with biochar nutrient sorption. Applications of litter and the interaction between litter and biochar very significantly reduced the total P content. Litter treatment lowered the total soil P at 14, 35 and 42 days after planting, while the interaction effect occurred at 14 and 35 days (Table 5). Based on further statistical test, application of 80 t maize litter / ha (A2) yielded the lowest total P at 35 days which was significantly different from the A1 and control treatments. At 14 and 42 days, the total P content was similar between treatments.
Table 5. Effects of application of biochar and fresh litter on total soil P
Treatment Total P (mg/kg) at days after planting
7 14 21 28 35 42 49
Litter (A):
A0 21.39 a 22.01 a 21.74 a 21.87 a 19.11 b 22.93 b 18.05 a A1 21.61 a 25.71 a 21.52 a 22.41 a 15.20 a 19.71 a 19.63 a A2 21.83 a 22.48 a 23.07 a 22.08 a 13.63 a 18.22 a 18.42 a interaction:
A0B0 22.86 a 23.76 bcd 21.90 a 21.90 a 21.01 g 22.39 a 21.92 a A0B1 21.41 a 21.40 abc 21.91 a 23.74 a 20.52 f 25.53 a 16.40 a A0B2 19.90 a 20.86 ab 21.74 a 21.79 a 15.81 cd 20.87 a 19.51 a A1B0 20.85 a 24.59 cd 19.95 a 22.76 a 14.32 ab 17.61 a 20.38 a A1B1 18.99 a 26.09 e 25.15 a 20.42 a 14.78 bc 19.98 a 18.55 a A1B2 24.98 a 26.47 d 21.52 a 21.45 a 16.50 ef 21.56 a 19.94 a A2B0 22.27 a 22.71 abc 20.30 a 22.27 a 11.59 a 16.47 a 17.42 a A2B1 20.08 a 20.07 a 22.46 a 20.55 a 14.79 bc 19.61 a 18.64 a A2B2 23.13 a 24.65 e 23.07 a 24.20 a 16.00 cde 18.59 a 19.20 a
LSD(0.01) 3.95 2.47 4.12 4.95 4.45 4.38 3.79
Interaction effect between 80 t maize litter / ha and 20 t sugarcane biochar/ ha (A2B1 treatment) yield P total that was significantly higher than that of A0B0, A1B0, A1B1, A1B2 and A2B2 treatments; but it was not different from other treatments. At 35 days, application of 80 t maize litter/ ha without biochar (A2B0 treatment) resulted in significantly higher P total that that of A0B0, A0B1, A0B2, A1B0, A2B1, A2B2 treatments (Table 5).
Soil available P
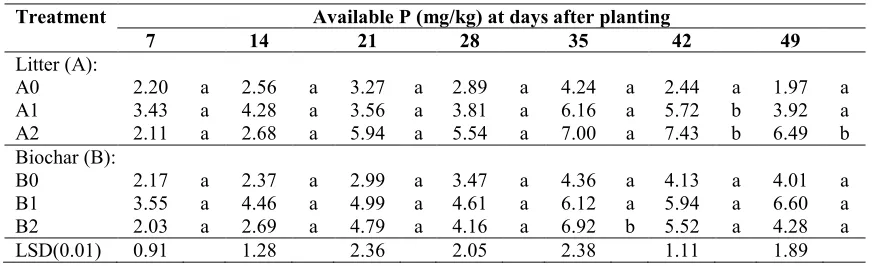
In general, application of litter and biochar increased the content of P available. The data presented in Table 6 show that at 42 days, application of 20 t sugarcane biochar / ha without litter resulted in a higher P availability than of B2 treatment. Application of 40 t sugarcane leaf litter / ha with 20 t sugarcane biochar / ha (A1B1 treatment) and application of 80 t maize litter / ha of maize plant litter with and 20 t sugarcane leaf biochar / ha (A2B1 treatment) resulted in the high available P content. The A2, B1 and B3
treatments added boosted P available with the same results in each period of growth. This was probably due to differences in the type of raw material in the litter and biochar used for this study. Application of litter type of treatments was more quickly producing nutrients that affected P available at any given period of growth despite the addition of biochar with different doses and types. Burning of crop residues or waste transportation can reduce the availability of P in the soil. But on the contrary, if the waste is returned to agricultural land in the form of litter can increase the availability of P. Based on the data presented in Table 6 it can be seen that the treatments of litter and biochar very significantly increased availability of P. The effect of litter began to occur in 21 to 49 days whereas the effect of biochar occurred in 14 days. There was no interaction effect of litter and biochar application in increasing the availability of P (Table 6). This was probably caused by the reaction of the competition and thus P turned back into the organic P or experiencing immobilization.
Table 6. Effects of application of biochar and fresh litter on soil available P
Treatment Available P (mg/kg) at days after planting
7 14 21 28 35 42 49
Litter (A):
A0 2.20 a 2.56 a 3.27 a 2.89 a 4.24 a 2.44 a 1.97 a
A1 3.43 a 4.28 a 3.56 a 3.81 a 6.16 a 5.72 b 3.92 a
A2 2.11 a 2.68 a 5.94 a 5.54 a 7.00 a 7.43 b 6.49 b
Biochar (B):
B0 2.17 a 2.37 a 2.99 a 3.47 a 4.36 a 4.13 a 4.01 a
B1 3.55 a 4.46 a 4.99 a 4.61 a 6.12 a 5.94 a 6.60 a
B2 2.03 a 2.69 a 4.79 a 4.16 a 6.92 b 5.52 a 4.28 a
LSD(0.01) 0.91 1.28 2.36 2.05 2.38 1.11 1.89
Remarks: The numbers in the column followed by the same letter are not significantly different at the 1% level LSD
Results of further statistical tests showed that the average P provided the highest litter treatment during the period of 42 days resulting from the different treatment A2 with other treatments (an increase of 67.16% available P). At 21, 28, and 35 days there was no significant difference in the P available between treatments. The B2 and B1 treatments produced the highest available P at 21 and 28 days; but there was no significant different between treatments. Litter treatment had higher available P and P supply period longer than biochar treatment during the study. This was probably due to the faster P supply process because the decomposition process is unstable unless humus, while biochar produced from thermo chemical processes is stable so that the release of elements requires a long period.
Phosphate derived from primary and secondary minerals as well as organic materials that undergo mineralization and decomposition. The physical processes change the shape and chemical reactivity differences. According to Zhao et al. (2014), low-level release of P is due to a change of the form of organic material into biochar so as elements of P in a stable form (Ca, Mg)3(PO4
-)2.
Organic material decomposition and biochar will produce a new compound that serves the functional groups also play a role in the binding of Ca in calcareous soils
Soil organic C
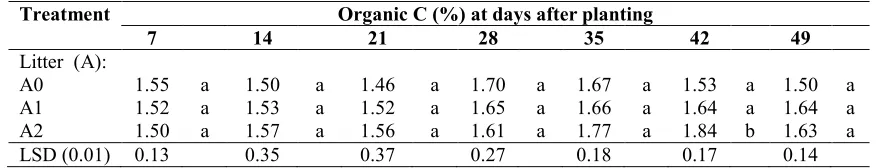
maize biochar / ha (B2) without litter (A0), and application of 40 t sugarcane litter / ha (A1) with 40 t maize biochar / ha of (B2) resulted in the highest soil organic C. For the treatment of 80 t maize litter/ ha (A2) without biochar (A2B0 treatment) produced the highest organic C in the period of 42 days after planting. When observing the highest rates, the A2B0 treatment had higher organic C than that of A1B2 and A0B2 treatments (Table 7). Based on the analysis of variance, litter treatment very significantly increased soil organic C at 35 and 49 days after planting, while the biochar treatment and interaction did not affect the increase of organic C. This was probably due to organic C compounds or elements resulting from the decomposition of litter to be released into the soil, while the carbon in biochar is stable so it is difficult to unravel the ordinary chemical reactions. Based on results of further statistical
test, application of 80 t maize litter / ha (A2) resulted in the soil organic C content at 42 days that was significantly different to the A1 and A0 (control) treatments. Biochar application and interaction showed no difference. Application of maize fresh litter increased soil organic C content by 16.85% compared to the control (Table 7). Organic matter affects soil organic C content through decomposition of its functional group composed of C, H and O compounds such as lignin, protein, resin, fulvic acid, humic acid, malic acid, oxalic acid, H2O and others, while the
product carbon derived from the biochar carbon is stable. Compounds and decomposition products of pyrolysis may affect the availability of P organic acids. Decomposition products will affect the P sorption in calcareous soil particle surfaces. Oxalic acid can reduce the level of fixation P (Anonymous, 2012).
Table 7. Effects of application of biochar and fresh litter on soil organic C
Treatment Organic C (%) at days after planting
7 14 21 28 35 42 49
Litter (A):
A0 1.55 a 1.50 a 1.46 a 1.70 a 1.67 a 1.53 a 1.50 a
A1 1.52 a 1.53 a 1.52 a 1.65 a 1.66 a 1.64 a 1.64 a
A2 1.50 a 1.57 a 1.56 a 1.61 a 1.77 a 1.84 b 1.63 a
LSD (0.01) 0.13 0.35 0.37 0.27 0.18 0.17 0.14
Remarks: The numbers in the column followed by the same letter are not significantly different at the 1% level LSD
P uptake by maize
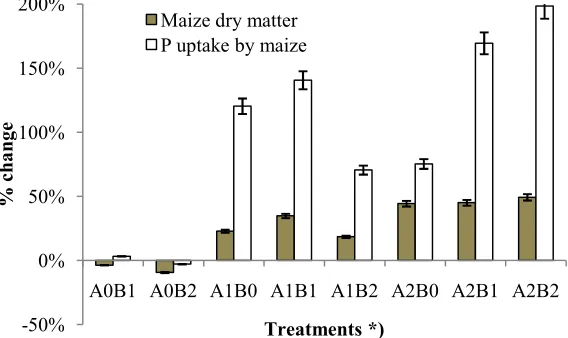
P uptake by maize increased with the increasing application of litter and biochar during the period of growth. Data presented in Figure 1 show that the highest P uptake occurred in the application of 80 t maize litter / ha of coupled with 40 t maize litter biochar / ha at 42 and 49 days. The decrease of P uptake from 42 to 49 days in almost all treatments might indicate the decrease of soil available P due to P uptake before 42 days. Results of analysis of variance showed that litter and biochar treatments significantly increased P uptake, whereas the combination of litter and biochar did not significantly increase the P uptake. When the values of maize dry matter and P uptake by maize at 49 days of all treatments were compared to those of the control treatment (A0B0), it can be seen that except for the A0B1 and A0B2 treatments, application of biochar and litter increased maize dry weight that ranged from 19% (A0B2 treatment) to 49% (A2B2 treatment), and increased P uptake by maize that ranged from 71% (A1B2) to 198% (A2B2) (Figure 2). According to DeLuca et al. (2009), biochar increases the availability of P in alkaline soil due
to increased reactivity of P with soil and form insoluble compounds with Ca. The negative charge is contained in biochar will bind Ca. Results presented in Figure 2 also indicate that maize dry weight and P uptake by maize decreased when during the growth the maize was not supplied with fresh litter, even biochars were supplied.
solution, followed by a decrease of calcium phosphate in alkaline soil (Mullen, 1998). The absorption of nutrients by plants involves the roots through the process of diffusion, interception roots and microorganisms. The presence of fungal hyphae that have threads that infects the roots of the plants forms symbiotic mutualism. Fibers play a role in absorbing roots of P in the soil solution, and then bring to the leaves through the xylem ion. The mechanism of absorption of P by plants divided by the capacity
of the root absorbing element, the diffusion of nutrients, as well as the displacement of the element and into the soil solution. Orthophosphate thought to be absorbed through the root cells containing threads hyphae (Sieverding, 1991). Factors that may also affect the uptake P is the presence of other anions. Anions such as silicates, carbonates, sulfates, arsenic and molybdate compete with phosphate anion exchange conditions (Anonymous, 2012).
Figure 1. P uptake by maize due to application of biochar and fresh litter. *) see Table 1
Figure 2. Percent change of maize dry weight and P uptake by maize due to application of biochar and fresh litter. *) see Table 1
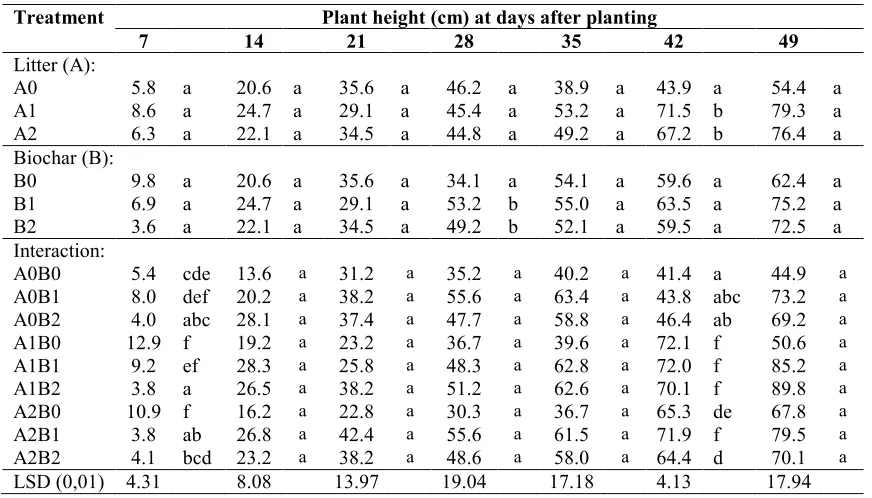
Maize growth
In general, the results showed that there was a high increase plant height due to the litter and biochar treatments. Application of 20 t sugarcane
biochar / ha without litter (A0B1 treatment) produced the highest plant in the period 49 days after planting. The provision of 40 t sugarcane leaf litter / ha and 80 t maize fresh litter / ha without biochar (A1B2 treatment) produced
-0.1 0.2 0.3 0.4 0.5 0.6 0.7 0.8 0.9 1.0
A0B0 A0B1 A0B2 A1B0 A1B1 A1B2 A2B0 A2B1 A2B2
P
u
p
ta
k
e
b
y
m
a
iz
e
(µ
g
/p
o
t)
Treatments *)
42 days 49 days
-50% 0% 50% 100% 150% 200%
A0B1 A0B2 A1B0 A1B1 A1B2 A2B0 A2B1 A2B2
%
ch
a
n
g
e
Treatments *)
highest crop yield in the period 49 days after planting. A similar result was also observed for the provision of 80 t maize litter / ha) and 20 t sugarcane biochar / ha (A2B1 treatment) (Table 9). The results of analysis of variance showed that the application of litter, biochar and their
interaction very significantly affected the increase in plant height. Results of further statistical test indicated that the provision of 40 t sugarcane litter / ha without biochar (A1B0 treatment) resulted the highest plant in the period of 42 days after planting.
Table 9. Effects of application of biochar and litter on maize plant height
Treatment Plant height (cm) at days after planting
7 14 21 28 35 42 49
Litter (A):
A0 5.8 a 20.6 a 35.6 a 46.2 a 38.9 a 43.9 a 54.4 a
A1 8.6 a 24.7 a 29.1 a 45.4 a 53.2 a 71.5 b 79.3 a
A2 6.3 a 22.1 a 34.5 a 44.8 a 49.2 a 67.2 b 76.4 a
Biochar (B):
B0 9.8 a 20.6 a 35.6 a 34.1 a 54.1 a 59.6 a 62.4 a
B1 6.9 a 24.7 a 29.1 a 53.2 b 55.0 a 63.5 a 75.2 a
B2 3.6 a 22.1 a 34.5 a 49.2 b 52.1 a 59.5 a 72.5 a
Interaction:
A0B0 5.4 cde 13.6 a 31.2 a 35.2 a 40.2 a 41.4 a 44.9 a
A0B1 8.0 def 20.2 a 38.2 a 55.6 a 63.4 a 43.8 abc 73.2 a
A0B2 4.0 abc 28.1 a 37.4 a 47.7 a 58.8 a 46.4 ab 69.2 a
A1B0 12.9 f 19.2 a 23.2 a 36.7 a 39.6 a 72.1 f 50.6 a
A1B1 9.2 ef 28.3 a 25.8 a 48.3 a 62.8 a 72.0 f 85.2 a
A1B2 3.8 a 26.5 a 38.2 a 51.2 a 62.6 a 70.1 f 89.8 a
A2B0 10.9 f 16.2 a 22.8 a 30.3 a 36.7 a 65.3 de 67.8 a
A2B1 3.8 ab 26.8 a 42.4 a 55.6 a 61.5 a 71.9 f 79.5 a
A2B2 4.1 bcd 23.2 a 38.2 a 48.6 a 58.0 a 64.4 d 70.1 a
LSD (0,01) 4.31 8.08 13.97 19.04 17.18 4.13 17.94
Remarks: The numbers in the column followed by the same letter are not significantly different at the 1% level LSD
The provision of 20 t sugarcane biochar / ha (A1) with 20 t / ha sugarcane litter (B1) also increased plant height. The highest plant was observed from the A1BO treatment (Table 9). Plant vegetative phase requires the availability of P to perform the formation of new tissue, cell division, the development of new roots and others, while the generative phase function for the manufacture of organs for breeding crops such as flowers and fruit formation and ripening seeds.
Availability of organic matter in the soil is important so that the supply or availability of P is maintained at all times. In line with the results of this study, Minardi et al. (2007) showed the same results that the increased uptake and plant growth was caused by the use of organic material that served to release the adsorbed P to increase the availability of P.
Each type of plant has the ability to move and distribute nutrients to the tissues of plants through the roots. Plant roots are also known to produce root exudates. Tilman et al. (2014) indicated that plants change P element by releasing phosphoric acid, proton, and or
carboxylic acid around rhizosphere to increase dissolved P in the soil. This means that root exudates and displacement of the material also serve to increase the availability of nutrients.
Carvalhais et al
. (2011) argued that the release of most compounds in the forms of amino acids, sugars and organic acids is the efforts of plant to overcome nutrient deficiencies. Plant height is related with P uptake by plant roots, the longer the period of growth the greeter is amount of P needed. Nevertheless, it also needs to be remembered, that the amount of P absorbed is not directly proportional to availability. When related with the availability of P, then the plants only absorbed 0.99 mg P / kg of the ability of plants to absorb P of 20%. In this study, however, availability of P increased from very low category (2.44 mg / kg) to low (7.43 mg / kg).Conclusion
not significantly increase P availability in the soil. However, application of litter and biochar also increased P uptake by maize. The best treatment for maximum increase of P availability and uptake of P was application 80 t sugarcane fresh litter / ha and 40 t maize litter biochar / ha
Acknowledgements
The first author wishes to thank Sonia Tambunan and the entire staff of soil laboratory Brawijaya University for their technical assistance in conducting this study.
References
Anonymous. 2012. Total Organic Carbon. Soil Quality for Environmental Health. http://soilquality.org/indicators/total_organic_carbo n.html.
Carvalhais, L.C., Dennis, P.G., Fedoseyenko, D., Hajirezaei, M.R., Borris, R. and von Wirren, N. 2011. Root exudation of sugars, amino acids, and organic acids by maize as affected by nitrogen.
Journal of Plant Nutrition and Soil Science174 (1): 3-11.
Cheng, C.H., Lehmann, J., Thies, J.E., Burton, S.D. and Engelhard, M.H. 2006. Oxidation of black carbon through biotic and abiotic processes. Organic Geochemistry37 : 1477 – 1488.
DeLuca, T. H., MacKenzie, M.D. and Gundale, M.J. 2009. Biochar Effects on Soil Nutrient Transformation. Earthscan Publisher, London, UK. pp. 251-270.
Handayanto, E., Cadisch, G. and Giller, K.E. 1994. N release from legume hedgerow tree prunings in relation to their quality and incubation method.
Plant and Soil160, 238-247
Lehmann, J. 2007. A handful of carbon. Nature447: 143-144.
Lehmann, J., Silva Jr., P.J., Steiner, C., Nehls, T., Zec, W. and Glaser, B. 2003. Nutrient availability and leaching in an archaeological Anthrosol and a Ferralsol of the Central Amazon basin: fertilizer, manure and charcoal amendments. Plant and Soil
249: 343–357
Mau, A.E. and Utami, S.R. 2014. Effects of biochar amendment and arbuscular mycorrhizal fungi inoculation on availability of soil phosphorus and growth of maize.Journal of Degraded and Mining Lands Management1(2): 69-74.
Minardi, S., Handayanto, E., Syekhfani, dan Suntoro. 2007. Penggunaan macam bahan organik dengan kandungan total asam humat dan fulvat berbeda dan pupukp terhadap ketersediaan dan serapan p pada tanaman jagung.Agrivita 29 (2): 111-123.
Mullen, M O. 1998. Transformation of Other Elements. Prentice-Hall. New Jersey
Novak,, J.M., Busscher, W.J., Laird, D.L., Ahmedna, M., Watts, D.W. and Niandou, M.A.S. 2009. Impact of biochar amendment on fertility of Southeastern Coastal Plain soil. Soil Science 174: 105-112.
Rachman, I.A., Djuniwati, S. dan Komarudin, I. 2008. Pengaruh bahan organik dan pupuk NPK terhadap serapan hara dan produksi jagung di Inceptisol Ternate.Jurnal Tanah dan Lingkungan10 (1) : 7-13.
Sieverding, E. 1991. Vesicular-Arbuscular Mycorrhiza Management in Tropical Agroecosystems. Deutsche Gesellschaft fur Technische Zusammenarbeit (GTZ) GmbH, DagHammarskjold-Weg1+2. Eschborn, Federal republic of Germany. ISBN: 3-88085-462-9. 62-64 Steiner, C., Teixeira, W.G., Lehmann, J., Nehls, T., de
Macedo, J.L.V., Blum, W.E.H. and Zech, W. 2007. Long term effects of manure, charcoal and mineral fertilization on crop product and fertility on a highly weathered central Amazonian upland soil. Plant and Soil291 : 275 – 290
Sukartono, Utomo, W.H., Kusuma, Z. and Nugroho, W.H. 2012. Soil fertility status, nutrient uptake, and maize (Zea mays L.) yield following biochar and cattle manure application on sandy soils of Lombok, Indonesia. Journal of Tropical Agriculture49 (1-2) : 47-52
Tilman, D., Hans.L. and Long, L. 2014. Plant diversity and over yielding: insight from belowground facilitation of intercropping in agriculture. New Phytologist203(1):63-69.
Verheijen., A.C. Jeffery, A.C., Bastos, F., van der Velde, M. and Diafas, I. 2010. Biochar application to soils. A critical scientific review of effects on soil properties, processes dan functions. European Communities. Luxembourg. ISBN: 978-92-79-14293-2. pp. 31-45.
Widowati, Utomo, W.H. and Guritno, B. 2012. The effect of biochar on the growth and N fertilizer requirement of maize (Zea maysL.) in green house experiment.Journal of Agricultural Science 4 (5): 255-266.
Widowati, Utomo, W.H., Soehono, L.A. and Guritno, B. 2011. Effect of biochar on the release and loss of nitrogen from urea fertilization. Journal of Agriculture and Food Technology1(7): 127-132. Yamato, M., Okimori, Y., Wibowo, I.F., Anshiori, S.
and Ogawa, M. 2006. Effects of the application of charred bark of Acacia mangium on the yield of maize, cowpea and peanut, and soil chemical properties in South Sumatra, Indonesia. Soil Science and Plant Nutrition Journal52:489–495 Zhang, A., Liu, Y., Genxing, P., Hussain, Q., Li, L.,
Wei, J. and Zhang, X. 2011. Effect of biochar amendment on maize yield and greenhouse gas emissions from a soil organic carbon poor calcareous loamy soil from Central China Plain.
Plant and Soil. Springer Science Business Media B.V. DOI. 10.1007/s11104-011-0957-x. http://www.academia.edu