UJI VALIDITAS DAN RELIABILIAS VARIABEL PENGETAHUAN
Case Processing Summary
N %
Cases
Valid 25 100.0
Excludeda 0 .0
Total 25 100.0
a. Listwise deletion based on all variables in the procedure.
Reliability Statistics
Cronbach's Alpha
N of Items
.867 4
Item Statistics
Mean Std. Deviation N
X1_1 3.72 .678 25
X1_2 3.76 .926 25
X1_3 3.52 1.005 25
Item-Total Statistics
Scale Mean if Item Deleted
Scale Variance if Item Deleted
Corrected Item-Total Correlation
Cronbach's Alpha if Item
Deleted
X1_1 10.96 7.457 .669 .861
X1_2 10.92 6.160 .735 .823
X1_3 11.16 6.140 .651 .858
UJI VALIDITAS DAN RELIABILITAS VARIABEL KETERAMPILAN
Case Processing Summary
N %
Cases
Valid 25 100.0
Excludeda 0 .0
Total 25 100.0
a. Listwise deletion based on all variables in the procedure.
Reliability Statistics
Cronbach's Alpha
N of Items
.957 4
Item Statistics
Mean Std. Deviation N
X2_1 3.56 1.083 25
X2_2 3.56 1.193 25
X2_3 3.52 1.085 25
Item-Total Statistics
Scale Mean if Item Deleted
Scale Variance if Item Deleted
Corrected Item-Total Correlation
Cronbach's Alpha if Item
Deleted
X2_1 10.60 9.333 .927 .933
X2_2 10.60 8.833 .900 .944
X2_3 10.64 9.323 .927 .933
UJI VALIDITAS DAN RELIABILITAS VARIABEL PENGALAMAN
Case Processing Summary
N %
Cases
Valid 25 100.0
Excludeda 0 .0
Total 25 100.0
a. Listwise deletion based on all variables in the procedure.
Reliability Statistics
Cronbach's Alpha
N of Items
.931 4
Item Statistics
Mean Std. Deviation N
X3_1 3.44 .961 25
X3_2 3.60 1.041 25
X3_3 3.64 .995 25
Item-Total Statistics
Scale Mean if Item Deleted
Scale Variance if Item Deleted
Corrected Item-Total Correlation
Cronbach's Alpha if Item
Deleted
X3_1 10.92 7.993 .780 .928
X3_2 10.76 7.357 .835 .911
X3_3 10.72 7.543 .846 .907
UJI VALIDITAS DAN RELIABILITAS VARIABEL SIKAP
Case Processing Summary
N %
Cases
Valid 25 100.0
Excludeda 0 .0
Total 25 100.0
a. Listwise deletion based on all variables in the procedure.
Reliability Statistics
Cronbach's Alpha
N of Items
.865 4
Item Statistics
Mean Std. Deviation N
X4_1 3.72 1.308 25
X4_2 3.44 1.044 25
X4_3 3.76 .926 25
Item-Total Statistics
Scale Mean if Item Deleted
Scale Variance if Item Deleted
Corrected Item-Total Correlation
Cronbach's Alpha if Item
Deleted
X4_1 10.92 6.243 .796 .802
X4_2 11.20 8.250 .636 .859
X4_3 10.88 8.277 .755 .819
UJI VALIDITAS DAN RELIABILITAS VARIABEL PRESTASI KERJA
Case Processing SummaryN %
Cases
Valid 25 100.0
Excludeda 0 .0
Total 25 100.0
a. Listwise deletion based on all variables in the procedure.
Reliability Statistics
Cronbach's Alpha
N of Items
.925 6
Item Statistics
Mean Std. Deviation N
Y_1 3.48 .872 25
Y_2 3.60 1.000 25
Y_3 3.72 .980 25
Y_4 3.56 .961 25
Y_5 3.56 .821 25
Item-Total Statistics
Scale Mean if Item Deleted
Scale Variance if Item Deleted
Corrected Item-Total Correlation
Cronbach's Alpha if Item
Deleted
Y_1 18.12 16.110 .733 .918
Y_2 18.00 15.167 .749 .917
Y_3 17.88 14.443 .886 .897
Y_4 18.04 15.290 .770 .913
Y_5 18.04 15.790 .849 .904
Descriptive Statistics
Mean Std. Deviation N
Prestasi Kerja (Y) 22.92 3.782 97
Pengetahuan (X1) 14.76 3.220 97
Keterampilan (X2) 14.94 3.424 97
Pengalaman (X3) 15.55 3.021 97
Sikap (X4) 15.32 3.118 97
Variables Entered/Removeda
Model Variables Entered Variables Removed
Method
1 Sikap (X4), Keterampilan (X2),
Pengalaman (X3), Pengetahuan (X1)b . Enter
a. Dependent Variable: Prestasi Kerja (Y) b. All requested variables entered.
Model Summary
Model R R Square Adjusted R Square
Std. Error of the Estimate
1 .861a .741 .730 1.965
ANOVAa
Model Sum of Squares df Mean Square F Sig.
1
Regression 1017.988 4 254.497 65.889 .000b
Residual 355.352 92 3.863
Total 1373.340 96
a. Dependent Variable: Prestasi Kerja (Y)
b. Predictors: (Constant), Sikap (X4), Keterampilan (X2), Pengalaman (X3), Pengetahuan (X1)
Coefficientsa
Model Unstandardized
Coefficients
Standardized Coefficients
t Sig.
B Std. Error Beta
1
(Constant) 4.937 1.139 4.336 .000
Pengetahuan (X1) .326 .099 .277 3.289 .001
Keterampilan (X2) .236 .081 .214 2.914 .004
Pengalaman (X3) .319 .100 .254 3.188 .002
Sikap (X4) .307 .106 .253 2.898 .005
Cuplikan Tabel Distribusi t
o
10%
5%
2,5%
71
1.294
1.667
1.994
72
1.293
1.666
1.993
73
1.293
1.666
1.993
74
1.293
1.666
1.993
75
1.293
1.665
1.992
76
1.293
1.665
1.992
77
1.293
1.665
1.991
78
1.292
1.665
1.991
79
1.292
1.664
1.990
80
1.292
1.664
1.990
81
1.292
1.664
1.990
82
1.292
1.664
1.989
83
1.292
1.663
1.989
84
1.292
1.663
1.989
85
1.292
1.663
1.988
86
1.291
1.663
1.988
87
1.291
1.663
1.988
88
1.291
1.662
1.987
89
1.291
1.662
1.987
90
1.291
1.662
1.987
91
1.291
1.662
1.986
92
1.291
1.662
1.986
94
1.291
1.661
1.986
95
1.291
1.661
1.985
96
1.290
1.661
1.985
97
1.290
1.661
1.985
98
1.290
1.661
1.984
99
1.290
1.660
1.984
df
1
2
3
4
5
6
7
8
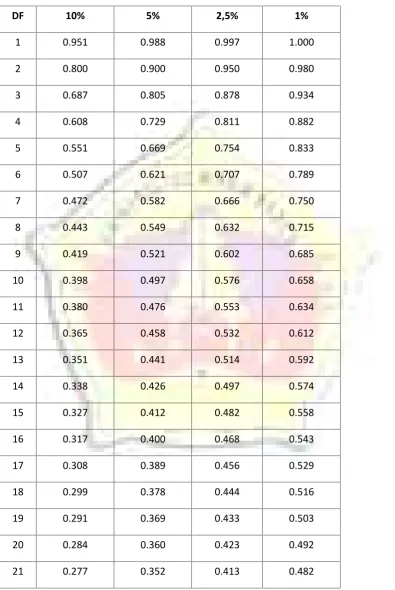
TABEL R
DF
10%
5%
2,5%
1%
Frekuensi Identitas Responden
Statistics
Jenis Kelamin Usia Tingkat Pendidikan
Masa Kerja
N
Valid 97 97 97 97
Frequency Table
Jenis Kelamin
Frequency Percent Valid Percent Cumulative Percent
Valid
Pria 38 39.2 39.2 39.2
Wanita 59 60.8 60.8 100.0
Total 97 100.0 100.0
Usia
Frequency Percent Valid Percent Cumulative Percent
Valid
20 - 30 th 43 44.3 44.3 44.3
31 - 39 th 40 41.2 41.2 85.6
40 - 49 th 12 12.4 12.4 97.9
lebih dari 50 th 2 2.1 2.1 100.0
Tingkat Pendidikan
Frequency Percent Valid Percent Cumulative Percent
Valid
SMA 14 14.4 14.4 14.4
Diploma (D1-D3) 65 67.0 67.0 81.4
SI 14 14.4 14.4 95.9
S2/S3 4 4.1 4.1 100.0
Total 97 100.0 100.0
Masa Kerja
Frequency Percent Valid Percent Cumulative Percent
Frekuensi Pengetahuan
Statistics
X1_1 X1_2 X1_3 X1_4 Pengetahuan (X1)
N
Valid 97 97 97 97 97
Missing 0 0 0 0 0
Mean 3.68 3.79 3.60 3.69 14.76
Median 4.00 4.00 4.00 4.00 15.00
Mode 4 4 4 4 18
Sum 357 368 349 358 1432
Frequency Table
X1_1
Frequency Percent Valid Percent Cumulative Percent
X1_2
Frequency Percent Valid Percent Cumulative Percent
Total 97 100.0 100.0
X1_3
Frequency Percent Valid Percent Cumulative Percent
Total 97 100.0 100.0
X1_4
Frequency Percent Valid Percent Cumulative Percent
2 11 11.3 11.3 14.4
3 22 22.7 22.7 37.1
4 38 39.2 39.2 76.3
5 23 23.7 23.7 100.0
Total 97 100.0 100.0
Pengetahuan (X1)
Frequency Percent Valid Percent Cumulative Percent
Frekuensi Variabel Keterampilan
Statistics
X2_1 X2_2 X2_3 X2_4 Keterampilan (X2)
N
Valid 97 97 97 97 97
Missing 0 0 0 0 0
Mean 3.84 3.69 3.70 3.71 14.94
Median 4.00 4.00 4.00 4.00 16.00
Mode 4 4 4 4 16
Sum 372 358 359 360 1449
Frequency Table
X2_1
Frequency Percent Valid Percent Cumulative Percent
X2_2
Frequency Percent Valid Percent Cumulative Percent
Total 97 100.0 100.0
X2_3
Frequency Percent Valid Percent Cumulative Percent
X2_4
Frequency Percent Valid Percent Cumulative Percent
Total 97 100.0 100.0
Keterampilan (X2)
14 2 2.1 2.1 30.9
Total 97 100.0 100.0
Frekuensi Variabel Pengalaman
Statistics
X3_1 X3_2 X3_3 X3_4 Pengalaman (X3)
N
Valid 97 97 97 97 97
Missing 0 0 0 0 0
Mean 3.91 3.76 3.97 3.91 15.55
Median 4.00 4.00 4.00 4.00 16.00
Mode 4 4 4 4 16
Frequency Table
X3_1
Frequency Percent Valid Percent Cumulative Percent
Total 97 100.0 100.0
X3_2
Frequency Percent Valid Percent Cumulative Percent
X3_3
Frequency Percent Valid Percent Cumulative Percent
Total 97 100.0 100.0
X3_4
Frequency Percent Valid Percent Cumulative Percent
Pengalaman (X3)
Frequency Percent Valid Percent Cumulative Percent
Total 97 100.0 100.0
Statistics
X4_1 X4_2 X4_3 X4_4 Sikap (X4)
N
Valid 97 97 97 97 97
Missing 0 0 0 0 0
Mean 3.87 3.67 3.86 3.93 15.32
Median 4.00 4.00 4.00 4.00 16.00
Mode 4 4 4 4 18
Sum 375 356 374 381 1486
Frequency Table
X4_1
Frequency Percent Valid Percent Cumulative Percent
X4_2
Frequency Percent Valid Percent Cumulative Percent
Total 97 100.0 100.0
X4_3
Frequency Percent Valid Percent Cumulative Percent
X4_4
Frequency Percent Valid Percent Cumulative Percent
Total 97 100.0 100.0
Sikap (X4)
18 20 20.6 20.6 88.7
19 10 10.3 10.3 99.0
20 1 1.0 1.0 100.0
Frekuensi Variabel prestasi kerja
Statistics
N Mean Median Mode Sum
Valid Missing
Y_1 97 0 3.74 4.00 4 363
Prestasi Kerja (Y) 97 0 22.92 24.00 26 2223
Frequency Table
Y_1
Frequency Percent Valid Percent Cumulative Percent
Y_2
Frequency Percent Valid Percent Cumulative Percent
Total 97 100.0 100.0
Y_3
Frequency Percent Valid Percent Cumulative Percent
Y_4
Frequency Percent Valid Percent Cumulative Percent
Total 97 100.0 100.0
Y_5
Frequency Percent Valid Percent Cumulative Percent
Y_6
Frequency Percent Valid Percent Cumulative Percent
Total 97 100.0 100.0
Prestasi Kerja (Y)
22 10 10.3 10.3 38.1
23 7 7.2 7.2 45.4
24 11 11.3 11.3 56.7
25 11 11.3 11.3 68.0
26 20 20.6 20.6 88.7
27 8 8.2 8.2 96.9
28 3 3.1 3.1 100.0