110
CHANGE DETECTION IN MULTI-TEMPORAL IMAGES USING MULTISTAGE CLUSTERING FOR DISASTER RECOVERY PLANNING
Muhamad Soleh1, Aniati Murni Arymurthy1, and Sesa Wiguna2
1Faculty of Computer Science, University of Indonesia, Kampus UI, Depok, 16422, Indonesia 2 Geography, The University of Auckland,Auckland, 1010, New Zealand
E-mail: [email protected], [email protected], [email protected]
Abstract
Change detection analysis on multi-temporal images using various methods have been improved by many researchers in the field of spatial data analysis and image processing. Change detection analysis has many benefit for real-world applications such as medical image analysis, valuable material detector, satellite image analysis, disaster recovery planning, and many others. Indonesia is one of the most countries that encounter natural disaster. The most memorable disaster happened on December 26, 2004. Change detection is one of the important parts of management planning for natural disaster recovery. This article presents the fast and accurate result of change detection on multi-temporal images using multistage clustering. There is three main step for change detection in this article, the first step is to find the image difference of two multi-temporal images between the time before the disaster and after a disaster using operation log ratio between those images. The second step is clustering the difference image using Fuzzy C means divided into three classes. Change, unchanged, and intermediate change region. Afterword the last step is to cluster the change map from fuzzy C means clustering using k means clustering, divided into two classes. Change and unchanged region. Both clustering’s based on Euclidian distance. The accuracy achieved using this method is about 98.80%.
Keywords: Change Detection; Multistage Clustering; Disaster Recovery Planning; Fuzzy C Means; K-Means
Abstrak
Analisis deteksi perubahan pada citra multitemporal menggunakan berbagai metode telah dikembangkan oleh beberapa peneliti di bidang analisis data spasial dan pengolahan citra. Analisis deteksi perubahan memiliki banyak manfaat untuk aplikasi dunia nyata seperti analisis citra medis, detektor bahan yang berharga, citra satelit anaysis, perencanaan pemulihan bencana, dan aplikasi lainnya. Indonesia adalah salah satu negara yang paling banyak menghadapi bencana alam. Bencana yang meninggalkan luka dalam terjadi pada 26 Desember 2004. Change detection merupakan salah satu peranan penting dalam perencanaan pengelolaan bencana alam. Artikel ini menyajikan hasil deteksi perubahan yang cepat dan akurat pada ima multitemporal dengan menggunakan multistage clustering. Terinspirasi oleh penelitian terdahulu tentang change detection menggunakan PCA k-means dan PCA-Net, memimpin metode yang diusulkan ini dengan menggunakan multistage clustering. Ada tiga langkah utama untuk deteksi perubahan pada artikel ini, langkah pertama adalah menemukan perbedaan gambar dua gambar multitemporal antara waktu sebelum bencana dan setelah bencana dengan menggunakan rasio log operasi antara gambar-gambar tersebut. Langkah kedua adalah mengelompokkan perbedaan citra dengan menggunakan fuzzy C yang dibagi menjadi tiga kelas, Change, unchange, dan intermadiate change. Langkah terakhir adalah cluster peta perubahan dari Fuzzy C Means clustering menggunakan k means clustering, terbagi menjadi dua kelas. Mengubah dan mengubah kawasan. Kedua clustering berdasarkan jarak euclidien. Nilai akurasi yang diperoleh dari metode yang diusulkan adalah 98.80%.
Keywords: Deteksi Perubahan; Multistage Clustering; Rencana Pemulihan Bencana; Fuzzy C Means; K-Means
1. Introduction
Change Detection is a method in the field of spatial data analysis used for analyzing the area change of a location at a different time [1]. Based on the process
unchanged areas that require training data. Determination of change by using clustering techniques which known cluster the number is called semi-supervised detection, while unsupervised detection is one of the change detection techniques that use clustering method without knowing the number of its clusters.
Based on the input dataset resolution, change detection is categorized into two, both are object-based change detection and pixel-object-based change detection [2]. Object-based detection is a technique to analyze the change of an area based on the change of objects found in the area being observed. Each object located in that area is categorized by segmentation of a certain pixel range value, whereas pixel-based change detection uses datasets with small to medium resolution. The dataset is used to determine the area of change and unchanged. The area is classified based on the maximum pixel value and the minimum pixel value on the change map.
Some researchers with the topic of interest on remote sensing have done some research related to change detection, using either supervised [3], semi-supervised [1] or unsemi-supervised methods [2]. The pixel-based change detection consists of two processes. The first step is to get the image difference from multi-temporal images. The second step is the filtering area that undergoes changes by using binary masking. The most common methods used in the first phase to find image different those are image subtraction [1], image log ratio [3], change vector analysis [4], correlation coefficient [5], similarity structure index measurement (SSIM) [2] or other methods. As for the binary masking process to get change and unchanged areas, most researchers use optimization [2, 5-7], thresholding [8], clustering [1, 9-10], and classification methods [3, 11-12].
To find the best method to use, most researcher decide based on both types of the dataset and the purpose of the study. Based on the result of some comparing research on change detection method, log ratio is better used for the remote sensing dataset which used an active sensor, while for the passive sensor better-using image subtraction method [3]. In 2013, Ghosh et al proposed a new method of change-detection research using the Change Vector Analysis (CVA) to see the inter-band vector changes in multispectral images. CVA combined with Gibbs Markov Random Fields by sampling the CVA results to determine the difference image based on the previous pixel relationship. The binary masking process proposed by Ghosh is an optimization method using expectation maximization by applying Hopfield-type neural networks [12].
In 2016, Feng Gao et al proposed a method of change detection using deep learning based. Feng
Gao et al used three different datasets, these are San Francisco, Ottawa, and Yellow River Datasets. The difference image gets by using log ratio. The result then transformed into orthogonally using Gabor wavelet as feature extraction, feature vector produced by Gabor wavelet used by Fuzzy C Means Clustering to produce change map which has three clusters consist of change, unchanged, and change detection topic using the Structure Similarity Index Measurement (SSIM) and Multi-objective Evolutionary Algorithm (MOEA). The SSIM used to get the difference image which can handle luminance, contrast, and the structure of the image input, while the MOEA Non-dominated Sorting GA (NSGA II) is used for binary masking for determining the changed region then enhanced by using Markov Random Field Fusion [2].
One of the useful implementation in the real world by doing this research related to change detection is for disaster recovery planning management [13]. There are several factors to consider in recovery after natural disasters happened, such as the number of personnel to be prepared, the supply of food needed, the expected time required, the availability of access road to the location and so on. Indonesia is one country among other countries that often happened the natural disasters.
Based on the data reported by the national disaster management agency, Republic of Indonesia, during the period of January to June 2017, Indonesia has an event 1368 natural disaster. The number of housing damage is 18,983 units. The death toll and disappeared reached 227 people and the number of injured and displaced around 1,710,973 people. Total of Disasters, Victims, and the Impact until June 2017 can be seen in table 1 and table 2 [14]. The purpose of this study is to find the effective and efficient method for change detection. Hopefully, it is can be used for disaster recovery planning.
2. Methods
using Absolute Log Ratio, optimize difference image using Fuzzy C Means Clustering, and Binary Masking using K-Means clustering.
Change detection is one of the methods that can use remote sensing to detect the change in the landscape over time. Its method can separate an interest region of changing area over time. There are several methods that have been implemented to find the change region on multi-temporal images. Absolute log ration is one of the most useful basic methods to separate changing region from two inputs with different time at the same location. Absolute log ratio is an extended method of image ratio. With the log-ratio operator, the multiplicative of speckle noise can be transformed in an additive noise component. Furthermore, the range of variation of the ratio image will be compressed and thereby enhances the low-intensity pixels [16].
The logarithmic scale is characterized by enhancing the low-intensity pixels while weakening the pixels in the areas of high intensity; therefore, the distribution of two classes (changed and unchanged)
could be made more symmetrical. However, the information of changed regions that are obtained by the log-ratio image may not be able to reflect the real changed trends in the maximum extent because of the weakening in the areas of high-intensity pixels. Therefore, to obtain the change map from multi-temporal images, we need to optimize by combining with the other method. A clustering algorithm is one of the methods that can reflect the real changed and unchanged region. Specifically, this method incorporates the information about spatial context to the corresponding objective function for reducing the effect of speckle noise [17].
In this research we use multiple clustering. This combine the Fuzzy C Means and K Means Clustering. FCM used for pre-classification. The main purpose of pre-classification is to find pixels that have high probabilities of being correctly classified into changed or unchanged classes. In fuzzy clustering, each point has a probability of belonging to each cluster, rather than completely
TABLE 1.
TOTAL OF DISASTERS AND VICTIMS FROM JANUARY UNTIL JUNE 2017IN INDONESIA
Disaster Type Disaster Type Number of Event
Victims (people)
Death &
Missing Injured
Affected & Evacuated
Flood 511 88 80 1.544.696
Flood And Landgroup 40 19 37 102.604
Wave / Abrasion Waves 5 0 0 10.155
Earthquake 9 0 47 1.180
Forest Fire And Lands 5 0 0 0
Transportation Accidents 2 17 46 0
Tornado 400 19 113 9.876
Landslide 396 84 111 42.028
Total 1.368 227 434 1.710.539
TABLE 2.
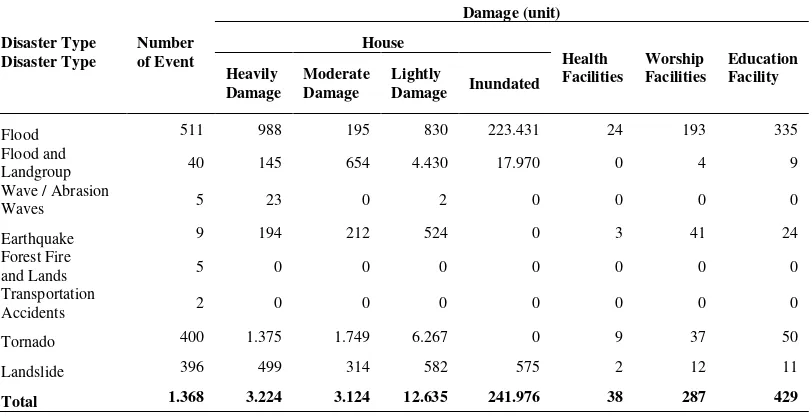
TOTAL OF DISASTERS AND THE IMPACT FROM JANUARY UNTIL JUNE 2017IN INDONESIA
Disaster Type Disaster Type
Number of Event
Damage (unit)
House
Health Facilities
Worship Facilities
Education Facility Heavily
Damage
Moderate Damage
Lightly
Damage Inundated
Flood 511 988 195 830 223.431 24 193 335
Flood and
Landgroup 40 145 654 4.430 17.970 0 4 9
Wave / Abrasion
Waves 5 23 0 2 0 0 0 0
Earthquake 9 194 212 524 0 3 41 24
Forest Fire
and Lands 5 0 0 0 0 0 0 0
Transportation
Accidents 2 0 0 0 0 0 0 0
Tornado 400 1.375 1.749 6.267 0 9 37 50
Landslide 396 499 314 582 575 2 12 11
belonging to just one cluster as it is the case in the traditional k-means. K-means clustering used for binary masking for producing change map. K-means classify the intermediate region area from FCM into change and unchanged area.
Difference image using Log Ratio
In the first stage, two multi-temporal satellite images
𝐼1 and 𝐼2 in the same location as input images. Difference image (𝐼𝐷) is obtained by using the Log Ratio.
𝐼𝐷= |log (𝐼1/𝐼2)| ()
Difference image is used to see the difference between two image inputs. The result of difference image then processed to extract the feature using multiplication operation between 𝐼𝐷 and Gabor kernel. Gabor wavelets concern of frequencies and orientations, where the filters used in the wavelet Gabor are composed of two components, real and imaginary components that represent orthogonal directors.
𝐺𝑟 = exp(−𝑥 ′2+𝛾2𝑦′2
2𝜎2 ) cos(2𝜋 𝑥′
𝜆 + 𝜓 ) ()
𝐺𝑖 = exp(-x '2+γ2y'2
2σ2 ) sin (2𝜋 𝑥′
𝜆 + 𝜓 ) ()
Where
𝐺
𝑟 is Gabor real component and𝐺
𝑖 is Gabor imaginer component with𝜆
is wavelength waves,𝛾
is spatial aspect ratio,𝜎
is standard deviation, and𝜓
is wave phase. Where𝑥
′ and𝑦
′ denoted as the equation 4 and 5.𝑥′= 𝑥 cos 𝜃 + 𝑦 sin 𝜃 ()
𝑦′= − 𝑥 sin 𝜃 + 𝑦 cos 𝜃 ()
By taking the magnitude of the real component and imaginer Gabor filter it will generate a feature vector. 𝑋 = [𝑥1, . . . , 𝑥𝑀𝑁]. Where M and N represent the length of the width of 𝐼𝐷. Feature Vector obtained from Gabor then used as input for the clustering process using Fuzzy C Means Clustering.
Optimize Difference image using Fuzzy C Means Clustering
At this stage, the feature vector is processed three processes. The first process is to divide the feature vector into two clusters representing potential areas as change region (𝜔𝑐) and unchanged (𝜔𝑢), but the number of clusters used as many as 5 clusters. The
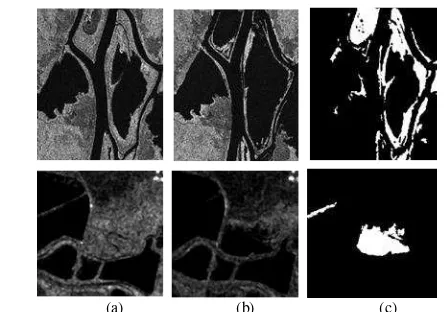
(a) (b) (c)
Figure 1. Dataset Images. The upper part is the Ottawa dataset and the bottom is San Francisco. (a) Ottawa before flood and San Francisco on August 2003 (b) Ottawa after flood and San Francisco on May 2004 (c) Ground truth
(a) (b) (c) (d) (e) (f) (g)
second process as the same as in the first process, but the number of clusters used is 5 clusters
(𝜔1, 𝜔2,𝜔3, 𝜔4,𝜔5). While the third process is to divide the five clusters into 3 clusters that represent the change area (𝜔𝑐), intermediate change (𝜔𝑖) and unchanged (𝜔𝑢). Based on the value of a certain objective function. In the Fuzzy C Means algorithm the clustering process is done by minimizing the objective function value during the iteration.
𝐶𝑀_𝐹 = 𝑎𝑟𝑔𝑚𝑖𝑛 𝑐 ∑ ∑𝑖=1𝑀𝑁 𝑐𝑗=1𝑤𝑖𝑗𝑚|𝑥𝑖− 𝑐𝑗|2 ()
Where 𝐶𝑀_𝐹 is change map fuzzy with c is cluster, x is feature vector [𝑥1, . . . , 𝑥𝑀𝑁], m is fuzzifier, m ϵ R with m >=1. Where 𝑤𝑖𝑗 (Membership Value) denoted as the equation 7.
𝑤𝑖𝑗= 1
∑ (|𝑥𝑖−𝑐𝑗|
|𝑥𝑖−𝑐𝑘|) 2 𝑡−1 𝑐
𝑘=1
()
CM_F is a fuzzy change map consisting of three class labels, namely change, intermediate, and unchanged. CM_F is then transformed orthogonally using Principe Component Analysis (PCA) to obtain a new feature vector. The process of PCA transformation in CM_F also consists of three processes including 1). Make h x h non-overlapping block from difference image; 2) Creating an eigenvector space using PCA on the h x h non-overlapping block already created; 3) Create a feature vector of CM_F by projecting h x h non-overlapping block into Eigen vector space. The process of obtaining an eigenvector on PCA uses the Singular Value Decomposition (SVD) principle of the feature vector input, to produce a feature vector
output resulting from a different image projection that has been restored into its original dimension.
𝑇 = 𝑋 . 𝑊 ()
Where T is Feature Vector Output, X is Feature Vector Input, and W Eigenvector. Using SVD method, X value can be written as the equation 9.
𝑋 = 𝑈 . 𝛴 . 𝑊
𝑇 (9)Where U is the orthogonal unit vectors and
𝛴
is the Rectangular diagonal matrix of positive numbers. So the value of T can be rewritten as the equation 10.𝑇 = 𝑈 . 𝛴
(10)The result of the vector T feature is then used for the clustering process. Clustering process aims to determine the change and unchanged region and then produce a change map (CM).
Binary Masking using K-Means clustering
Basically, the k-means clustering principle is the same as fuzzy c means clustering. Both methods use distance and centroid as cluster boundary and majority vote as new raster determination.
𝐶𝑀 = 𝑠𝑎𝑟𝑔𝑚𝑖𝑛 ∑ ∑𝑘𝑖=1 𝑇𝜖𝑆|𝑇 − 𝜇|2 (11) Where
𝐶𝑀
is Change Maps, k is numbers of cluster, s is a set of clusters from input data and𝜇
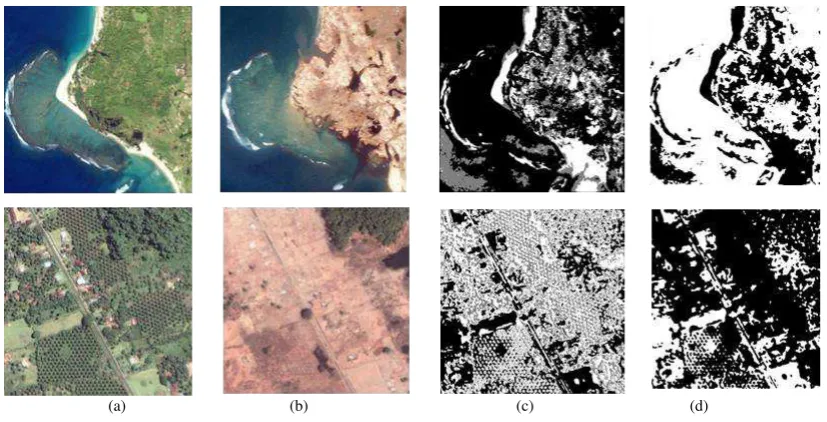
𝑖 is a centroid.(a) (b) (c) (d)
Figure 3. Visualization of research results on the proposed method using the Aceh Tsunami image dataset (https://earthobservatory.nasa.gov). The upper part is the Lhoknga area and the lower part is the Gleebruk area. (a) Images before
3. Results and Analysis
The experimental results of this study consist of two parts. Performance measurement test and Implemen-tation of the proposed method.
Performance test of the proposed method
The first section we will discuss the performance test of the proposed method using baseline dataset obtained from previous research [3]. The results of the proposed methods are compared with pre-existing methods such as PCA-k-Means [1], MRF-FCM [9], Gabor-TLC [10], and D_MRF-MRF-FCM [11]. The parameters used for measuring the performance of proposed algorithm are Miss Alarm (MA), False Alarm (FA), Overall Error (OE), and Accuracy (ACC). MA is the total number of pixels of change region that is not successfully detected as a change region, FA is the total number of pixels in the unchanged region detected as pixels in the change region, OE is the sum of FA and MA, while the ACC is the ratio between OE and the total pixels then minus 1 and multiplied by 100%.
Based on the results of the performance obtained in Table 3, it is known that the proposed method is one of the promising methods for performing the change detection. So, it`s can be processed to be applied to various applications that can solve some real-life problems. One of them is disaster recovery planning. Compared to the previous research, the proposed method has a good quality in Accuracy, False Alarm, and Overall Error. We also have provided other calculation to measure the performance of the proposed method. False alarm rate (PFA), Missed detection rate (PMD), percentage correct classification (PCC), and Kappa coefficient (KC) can be used for the indicators to measure the effectiveness of different methods [3].
In the reference ground-truth map, the actual numbers of pixels belonging to the unchanged and changed classes are denoted by NU and NC, respectively. Then, PFA is FA/NC × 100% and
PMD is MD/NC × 100%, in which MD refers the number of changed pixels are detected as unchanged. The PCC is (NU + NC − FA −MD) / (NU + NC) × 100%. The KC is a statistic which measures
inter-TABLE 3
COMPARISON RESULT OF CHANGE DETECTION METHOD
Method San Francisco Dataset
MA FA OE ACC PFA PMD PCC KC
PCA-k-means [1] 72 2034 2107 96.78 2.66 0.53 96.78 83.68
MRF-FCM [9] 199 1518 1717 97.38 2.48 4.08 97.38 82.69
Gabor-TLC [10] 193 1016 1209 98.15 1.62 4.14 98.15 87.45
D_MRF-FCM [11] 185 702 887 98.64 1.11 4.10 98.64 90.48 Proposed Method 158 627 785 98.80 0.15 13.15 98.80 87.45
Method Ottawa Dataset
MA FA OE ACC PFA PMD PCC KC
PCA-k-means [1] 1843 1803 3646 95.50 1.11 9.78 95.50 90.45
MRF-FCM [9] 1118 1896 3014 96.28 1.90 4.6 96.28 91.27
Gabor-TLC [10] 1391 1540 2931 96.38 0.37 12.85 96.38 90.81
D_MRF-FCM [11] 1815 257 2072 97.44 1.16 4.55 97.44 93.58
Proposed Method 779 1275 1946 97.67 1.64 5.93 97.67 93.66
TABLE 4
COMPARISON RESULT OF PROPOSED METHOD WITH DEEP LEARNING BASED
Method Ottawa Dataset
MA FA OE ACC Time PFA PMD PCC KC GD/OE
PCA-Nets[3] 732 1074 1806 98.22 3828.17 0.85 6.93 98.22 93.06 7.98 Proposed Method 779 1275 1946 97.67 28.51 1.64 5.93 97.67 93.66 6.42
Method San Francisco Dataset
MA FA OE ACC Time PFA PMD PCC KC GD/OE
PCA-Nets [3] 291 406 697 98.94 2274.69 0.48 8.67 98.94 91.90 6.14 Proposed Method 158 627 785 98.80 9.42 1.64 5.93 97.67 93.66 6.14
TABLE 5
COMPARISON RESULT BETWEEN LHOKNGA AND GLEEBRUK
Dataset Parameter
SSIM Change Unchanged Total
Lhoknga 0.38 160.658 336.367 497.025
rater agreement for qualitative (categorical) items
.
It is generally thought to be a more robust measure than simple percent agreement calculation,as κ considers the possibility of the agreement occurring by chance [10]. Table 3 shows the result of the proposed method compared to the others. For the San Francisco dataset, the result shows 0.15, 13.15, 98.80, and 87.45 for PFA, PMD, PCC, and KC respectively. Otherwise, for the Ottawa dataset, the result shows 1.64, 5.93, 97.67, and 93.66 for PFA, PMD, PCC, and KC respectively.
Table 4 shows PCA-Net proposed by Feng Gao et al performance better results than the proposed method. But in computing time, PCA-Net is not very effective. To perform a change detection analysis process that requires real-time results, especially in disaster recovery planning based on the experiments that have been run the time required for running PCA-Net is around 2274.69 to 3828.17 seconds. While on the proposed method, the running time required only about 9.42 to 28.51 seconds. The ratio of computational time between PCA-Net and the proposed method is very much different. By using multistage clustering, the result of change detection is near the performance of PCA-Net, even the proposed method is very efficient in terms of its algorithm complexity. PCA-Net composed of three steps: the first two-stage are PCA filter convolutions and the last stage is hashing and histogram generation. PCA filter convolutions composed of several layers. PCA-Net consist of training and testing phase. The sample of change and unchanged images were generated from the images. Those needs more time to classify the change and unchanged area.
In Figure 3, it shows the visualization for each method used in this research. There are two regions which indicated changed and unchanged areas from multi-temporal images. Several methods are still not optimal for performing changes map in the different image. There are still too many speckle noise in conventional method for Ottawa and San Francisco dataset. The best method for reducing the speckle noise is based on deep learning technique. The visualization of the image also proves that the values contained in table 3 and 4 correspond to the visualization results shown in Figure 2.
Implementation of Proposed Method on Aceh Tsunami Dataset
This section we will discuss the implementation of the proposed method using new datasets. The research consists of preprocessing datasets, dividing the regions into three clusters, binary masking in the
intermediate change area into two clusters, thus testing the image quality based on structure, luminance, and contrast. Preprocessing on the dataset is done by cropping in the region of interest. This cropping process is an important part of this research. The number of pixels on both data sets should be the same so the results can be compared. The characteristics of the dataset are made differently, this is intended to differentiate the changing and unchanged regions.
The dataset used is from remote sensing images located in Lhoknga, Aceh Province taken on January 10, 2003 (before the tsunami) and 29 December 2004 (3 days after the tsunami), another dataset is in Gleebruk, Aceh Province taken on 12 April 2004 (before the tsunami) and on 2 January 2005 (some after the tsunami). The input images used in this research based on the result of preprocessing data with the size of 705 x 705 pixels, so the total pixel used is 497,025 pixels. The characteristics of Lhoknga area used are residential areas on the seafront, while the Gleebruk area is a middle residential area.
The next step is to calculate the value of similarity index measurement (SSIM) in each input dataset. The SSIM used in this study is the method proposed by Z. Wang for image quality assessment [15]. The SSIM value in the range of 0 - 1. The closer the two-image resemblance, the SSIM value is close to 1, whereas if the two comparable images have a slight resemblance, the value of SSIM is shown to be close to 0. SIM value is obtained by using equation 12. with weak denominator with is the dynamic range of the pixel-values and 𝑘1 is 0.01; 𝑘2 is 0.03 by default.
The value of SSIM then used as a baseline in analyzing the result of change detection by using the proposed method. The relationship between the SSIM value and research of change detection is certain closely related. The closer the resemblance of the two image inputs, the region undergoing the change after the tsunami disaster will be less, whereas if the value of SSIM approaches 0, then it indicates a larger area change in the image.
change detection using Gabor - Fuzzy C Means and PCA – K Means clustering.
Fuzzy C Means used to find the cluster of change, intermediate and unchanged area. Intermediate change area probably can be used for disaster recovery planning. For examples such as finding safety area for mitigation process, selected area for emergency reconstruction building, or effective food distribution and first aid personnel on the victim etc.
Table 5 shows the comparison between Lhoknga and Gleebruk datasets using the proposed method. In the dataset located in Lhoknga, the total of all pixels, there has been a change is about 160.658 pixels. While on the Gleebruk location the total pixels that change reached 357.332 pixels. From both area, we suggest to the disaster recovery team to concern more in Gleebruk area which has more damage than Lhoknga, although we consider there are other factors may be influence.
Based on the structural similarity index measurement (SSIM) on both image inputs, it is known that in the Gleebruk area, the similarity values show the result is very small, even to the point of 0.10. This is because the image before and after the tsunami has increasingly changed. Whereas in the Lhoknga dataset, the result of SSIM value is still in the range of 0.38. It shows there is still similarity between the image before and after the tsunami. SSIM uses a comparison of structure, luminance, and contrast on two images.
4. Conclusion
The Multistage clustering method proposed in this article has succeeded in detecting a region's changes in multi-temporal images with satisfactory performance results. The accuracy achieved using this method is about 98.80%. It was better than another result and close to deep learning-based method, with more efficient time complexity. The proposed method has also been implemented in Tsunami dataset that ever happened in Indonesia precisely located in Lhoknga and Gleebruk, Aceh Province. The future work of this research will implement the deep learning technique such as the convolutional neural network to find the change and unchanged region form multi-temporal images.
References
[1] Turgay Celik: Unsupervised Change Detection in Satellite Images Using Principal Component Analysis and k-Means Clustering: IEEE GEOSCIENCE AND REMOTE SENSING LETTERS: VOL. 6, NO. 4, OCTOBER 2009 [2] Amir Yavariabdi and Huseyin Kusetogullari : Change
Detection in Multispectral Landsat Images Using
Multiobjective Evolutionary Algorithm, IEEE Geoscience and Remote Sensing Letters (Volume: 14, Issue: 3, March 2017 )
[3] Feng Gao, Junyu Dong, Bo Li, and Qizhi Xu: Automatic Change Detection in Synthetic Aperture Radar Images Based on PCANet : IEEE GEOSCIENCE AND REMOTE SENSING LETTERS : VOL. 13, NO. 12, DECEMBER 2016
[4] R. J. Radke, S. Andra, O. Al-Kofahi, and B. Roysam, : Image change detection algorithms : A systematic survey : IEEE Trans. Image Process.,Vol. 14, no. 3, pp. 294–307, Mar. 2005.
[5] Huseyin Kusetogullari dan Amir Yavariabdi : Self-Adaptive Hybrid PSO-GA Method for Change Detection Under Varying Contrast Conditions in Satellite Images : SAI Computing Conference, July 13-15, 2016, London, UK
[6] Turgay Celik : Change Detection in Satellite Images Using a Genetic Algorithm Approach : IEEE GEOSCIENCE AND REMOTE SENSING LETTERS : VOL. 7, NO. 2, APRIL 2010
[7] D. Renza, E. Martinez, and A. Arquero : A new approach to change detection in multispectral images by means of ERGAS index : IEEE Geosci. Remote Sens. Lett., vol. 10, no. 1, pp. 76–80, Jan. 2013.
[8] G. Moser and S. B. Serpico : Generalized minimum-error thresholding for unsupervised change detection from SAR amplitude imagery : IEEE Trans. Geosci. Remote Sens : vol. 44, no. 10, pp. 2972–2982, Oct. 2006.
[9] M. Gong, L. Su, M. Jia, and W. Chen, : Fuzzy clustering with a modified MRF energy function for change detection in synthetic aperture radar images, : IEEE Trans. Fuzzy Syst. : vol. 22, no. 1, pp. 98–109, Feb. 2014. [10] H.-C. Li, T. Celik, N. Longbotham, and W. J. Emery :
Gabor feature based unsupervised change detection of multitemporal SAR images based on two-level clustering : IEEE Geosci. Remote Sens. Lett. : vol. 12, no. 12, pp. 2458–2462, Dec. 2015.
[11] M. Gong, J. Zhao, J. Liu, Q. Miao, and L. Jiao, : Change detection in synthetic aperture radar images based on deep neural networks : IEEE Trans. Neural Netw. : vol. 27, no. 1, pp. 125–138, Jan. 2016.
[12] A. Ghosh, B. N. Subudhi, and L. Bruzzone : Integration of Gibbs Markov random field and Hopfield-type neural networks for unsupervised change detection in remotely sensed multitemporal images : IEEE Trans. Image Process : vol. 22, no. 8, pp. 3087–3096, Aug. 2013 [13] Teimouri, M, M.R. Delavar, S. Kolyaie, S.H. Chavoshi,
and H. Kiavarz Moghaddam : A SDSS based earthquake damage assessment for emergency response: Case study in BAM : The International Archives of the Photogrammetry, Remote Sensing, and Spatial Information Science. Vol XXXVIII. Part B8. Beijing 2008
[14] http://dibi.bnpb.go.id/
[15] Z. Wang, A. C. Bovik, H. R. Sheikh, and E. P. Simoncelli, "Image quality assessment: From error visibility to structural similarity," IEEE Transactios on Image Processing, vol. 13, no. 4, pp. 600-612, Apr. 2004 [16] J. Inglada and G. Mercier, “A new statistical similarity
measure for change detection in multitemporal SAR images and its extension to multiscale change analysis,” IEEE Trans. Geosci. Remote Sens., vol. 45, no. 5, pp. 1432–1445, May 2007.