Masri: The Role of Governance In The Relationships of Familiy Company With Real…
Jurnal Akuntansi/Volume XXII, No. 01, Januari 2018: 51-67 51
The Role of Corporate Governance In The Relationships of Family
Company With Real Earnings Management
Indah Masri
Faculty of Economics and Bussiness University of Pancasila indahmasri@univpancasila.ac.id
Abstract: The purpose of this research was to determine the effect of family ownership on real earnings management with corporate governance as a moderation variable in this relationship. This research is also looking at the role of accrual earnings management as a substitute in the relationship accrual earnings management with real earnings management in a family company. This study uses data 61 manufacturing companies on the Indonesia Stock Exchange in the period 2010 to 2013. The research results according to which hypothesized that family firms tend to negatively affect with real earnings management. The role of corporate governance as strengthening internal oversight negative effect on family companies with real earnings management. The results also proved the existence of a relationship of substitution for family firms tend to be doing accrual earnings management than real earnings management. This is because on the one hand the motivation of control as a strong incentive to do accrual earnings management in the family company, while on the other hand, the family companies tend to dislike real earnings management for their negative performance impact.
Keywords: Accrual Earnings Management, Corporate Governance, Family Firm, Real Earnings Management,
BACKGROUND
Almost every major public companies in Asia, especially in Indonesia are owned by families. Like other companies in general, earnings management practices are also mostly done by family companies. Previous research has examined the influence of family firms on earnings management and the results showing varied. Research conducted by Wang (2006) found evidence that family firms can improve the quality of earnings. Wang (2006) consistently proves that family ownership is associated with lower abnormal accruals, greater earnings response coefficient, and less earnings persistent from temporary loss components, but also shows a non-linear relationship between family ownership and earnings quality.
Masri: The Role of Governance In The Relationships of Familiy Company With Real…
Jurnal Akuntansi/Volume XXII, No. 01, Januari 2018: 51-67 52
impetus for AEM in family companies, while on the other hand family companies tend to not like REM because of the negative performance impact. The results of research Achleitner et al. (2014) support the hypothesis he discloses, where his studies used different tests to see the effect of family ownership on AEM and REM.
Corporate governance as a form of internal control can reduce the practice of earnings management within a company. Young et al. (2008) states that in developing countries, external factors, more often than not, are corrupt or ineffective, and thus more emphasis is placed on internal control mechanisms. This study attempts to add Achleitner's et al.(2014) research by looking at the effect of family ownership with real earnings management (Roychowdhury, 2006) where its proxy is the sum of Ab_CFO, Ab_Prod, and Ab_DisExp. In addition, this study adds the role of Corporate Governance which is internal control in this relationship. This study aims to examine how the influence of family firms on real earnings management and the role of corporate governance variables in this relationship.
This research can give some contribution that is: 1) Real Earnings Management (REM) proxy used in this research is different from Achleitner’s et al. (2014) research that is by summing the three proxies of real earnings management proposed by Roychowdhury (2006). 2) Adding the role of corporate governance in relation to family ownership and real earnings management, especially for internal control. 3) Adding the Accrual Earnings Management (AEM) variable in the research model to prove a substitution relationship that the family firms that do accrual earnings management tend not to do real earnings management.
THEORETICAL REVIEW
Family Firms and Earnings Management. Previous research on a family firm based on two theories, which is agency theory and stewardship theory (Davids, Schoorman, & Donaldson, 1997). Stewardship theory argues that family executives as servants are not as agents and their interests are in tune with other shareholders. In this case, can be seen in research conducted by Wang (2006) that examines the relationship founding family with the quality of earnings, the founding family has an incentive to improve the quality of earnings, by showing a negative effect with abnormal accrual. While Agency theory argues that family ownership may lead to conflict because of opportunities with concentrated ownership to take over minority shareholder revenues. Previous studies that support agency theory are Chaney, Faccio, & Parsley, (2011); Fan & Wong (2002); Chi et al. (2015) which suggests that family-focused firms in Asia can reduce the quality of financial reporting, in the sense of an incentive to effectively control accounting reporting policies and limit information content for the purpose of their interest
Masri: The Role of Governance In The Relationships of Familiy Company With Real…
Jurnal Akuntansi/Volume XXII, No. 01, Januari 2018: 51-67 53
strong impetus for doing accrual earnings management in the family company. Family firms tend to dislike real earnings management because of the negative performance impact. Based on research Achleitner et al. (2014) this study tries to prove again that family companies tend to negatively affect earnings management in real, then the hypothesis developed is:
H1: Family firms tend to negatively affect real earning management
The Trade-off between Real Earning Management and Accrual Earning Management. Roychowdhury (2006) finds evidence that companies use some real manipulation activity to avoid losses in financial statements. Some of the real manipulation activities proved in Roychowdhury's (2006) study are such as abnormal CFO, abnormal production, and abnormal discretionary expenditure. Instead, Zang (2012) tests whether managers use real manipulation and accrual-based activities in earnings management as substitutions. The results of Zang's (2012) study show that managers use trade-offs for both earnings management methods based on their relative costs. Becker et al. (1998) and Chung et al. (2005) indicate that high audit quality tends to limit the discretionary accruals performed by management. Based on research results Roychowdury (2006), Zang (2012), Becker et al. (1998) and Chung et al. (2005) indicate a substitution relationship of accrual earnings management and real earnings management. Especially for family companies (Achleitner et al., 2014), that family companies prefer accrual earnings management rather than real earnings management. So it can be concluded for family companies that do accrual earnings management tends not to do real earnings management. Hence the developed hypothesis is:
H2: There is no substitution relationship between accrual earnings management and real earnings management in non-family companies
H3: There is a substitution relationship between accrual earnings management and real earnings management in family companies
Corporate Governance in Family Companies. The substitution relationship of accrual earnings management to real earnings management indicated by the limitations to accrual earnings management due to the auditor or regulator examination, the company will move to do real earnings management. Graham et al. (2005) in the results of his research states that auditors and regulators are more likely to supervise manipulation on an accrual rather than a real basis. The role of corporate governance in terms of internal controls will reduce the manipulative and opportunistic profit management practices that may harm shareholders. Based on the relationship, the hypothesis developed is:
H4: In the non-family companies, corporate governance will negatively affect Real Earnings Management
Masri: The Role of Governance In The Relationships of Familiy Company With Real…
Jurnal Akuntansi/Volume XXII, No. 01, Januari 2018: 51-67 54
skills and no relationship with shareholders. The higher the proportion board of independence is expected to increase internal control of the company.
While the busy board of commissioner according to Cashman et al. (2012) in the results of his research shows a negative relationship between performance with the busy board of commissioners. The busier the commissioner the lower the variability of the company's performance. In this study because of the need for internal control over earnings management by family companies, then using the opposite measurement from research Cashman et al. (2012), that is less busy board of commissioners will make better the company's performance, so it can conduct intense supervision and reduce the company to perform earnings management that its manipulative and opportunistic.
Audit committee which is an internal supervisory board within the company. McMullen (1996) in his research found that firms with established audit committees were more likely to have reliable financial reporting (ie, the absence of errors, irregularities, or illegal acts). This study uses audit committee measurements from Woidtke and Yeh (2013) namely financial expert and legal expert. Based on several proxies of corporate governance on internal supervision, the hypothesis developed to see the effect of moderation on the family companies is:
H5: In family companies, moderation of corporate governance will strengthen the family's negative influence on real earnings management
Family companies prefer to do accrual earnings management and do less real earnings management than non-family companies (Achleitner et al., 2014), and the role of corporate governance as internal controls will further strengthen the negative relationship between family firms with real earnings management. Based on that it can be hypothesized.
H6: Corporate governance moderation for family companies that do accrual earnings management will further strengthen the negative impact on real earnings management rather than non-family companies
Research Framework. Based on the development of hypotheses in this study on the relationship between family companies and real earnings management, as well as the role of corporate governance in this relationship, the research framework developed in this study is as follows:
I. METHODOLOGY
METDOD
H2 Accrual Earning Management
Family Companies H3 H6 H1 Real Earning Management H5
H4 Internal Corporate governance: Board of
Independence, Busy Board of Commisioner, Finance Expert Committee Audit, Legal
Masri: The Role of Governance In The Relationships of Familiy Company With Real…
Jurnal Akuntansi/Volume XXII, No. 01, Januari 2018: 51-67 55
Types and Data Sources. The type of data used is secondary data from the annual financial statements and annual report of the company in 2010 sd. 2013 issued by the Indonesia Stock Exchange on www.idx.co.id and datastream
Population and Sample. Manufacturing companies listed on BEI for the period 2010-2013, with the exception of: (1) Eliminate observations with negative sales figures or where the total asset value is zero or lost; (2) Exclude financial institutions and utility industries because these industries have different accounting rules, operating characteristics, and debt financing rules; (3) Remove sample whose data is not available for variable measurement
Variable Measurement. Dependent Variables. This study uses the Real Eaning Management (REM) proxy developed by Roychowdhury (2006), which estimates the normal level of business activity that is reflected in the cash flow from operations, production costs, and discretionary expenditures. The residual of each model is used as a proxy for REM. Consistent with some previous research (Cohen & Zarowin, 2010; Zang, 2012; Ge & Kim, 2014), this study uses a model to construct REM measurements consisting of 3 models:
1. To estimate the normal level of operating cash flow
CFOt/Assetst-1 = α0 1/Assetst-1 + α1 Salest/Assetst-1 + α2 ΔSalest/Assetst-1+εt --- (1)
Where CFO is cash flow from operating activities; Assets are total assets; Sales are net sales; and ΔSales is the year-end sales rate change compared to the number of initial sales of the year
2. To estimate the normal rate of production costs
Prodt/Assetst-1=α0 1/Assetst-1 + α1 Salest/Assetst-1 + α2 ΔSalest/Assetst-1+
α3ΔSalest1/Assetst-1 + εt --- (2)
Where Prod is the sum of Cost of Goods Sold (COGS) and inventory changes 3. To estimate the normal level of discretionary cost.
DisExpt/Assetst-1 = α0 1/Assetst-1 + α1 Salest-1/Assetst-1 + εt --- (3)
Where DisExp is discretionary cost measured by the sum of advertising costs, R & D costs, sales costs, and general and administrative costs.
Masri: The Role of Governance In The Relationships of Familiy Company With Real…
Jurnal Akuntansi/Volume XXII, No. 01, Januari 2018: 51-67 56
Independent Variables. Independent variable in this research is family companies, here is two measurement for family companies which one of them used as sensitivity analysis test, as follows:
1. The definition of a family company that used in this study follows the concept of the family company by its founders used in the literature of Anderson and Reeb (2003, 2003b), Villalonga and Amit (2006), the company is classified as a family company when the founders or their family members either through blood relationship or marriage function as a director in the management and / or supervisory board or acting as a blockholder, either individually or as a group. Using dummy variable is 1 if the family company and 0 otherwise.
2. Measurement of family ownership based on that done by La Porta et al. (1999) and Claesens et al. (2000), which is also used by Arifin (2003) to define family ownership ie companies or individuals whose shareholdings are 5% (whose names are included in the financial statements), not owned by governments, financial institutions, public companies and the public ownership (individuals whose ownership is not required are listed in the financial statements). Wang (2006) states that family ownership variables are used to measure the founder of family ownership based on the percentage of common stock held by family members, with a greater value indicating greater family interest in the company.
Moderator Variables. Accrual Earnings Management. This study measures abnormal accruals that show Accrual Earning Management using measurements developed by Kothari et al. (2005) which is a modification of the Jones model (Dechow et al., 1995), as follows:
ACCit = b0it + b1it (1/Assetit-1) + b2it( ΔRevit–ΔARit ) + b3it GPPEit + b4it ROAit+ εit
Where:
ACCit : Total accruals scaled with total assets last year for firm i in year t Assetit-1 : Total assets last year for firm i in year t
ΔRevit : Changes in revenues that were scaled with total assets last year for firm i in year
t
ΔARit : Changes in receivables that were scaled with total assets last year for firm i in
year t
GPPEit : Gross property plant and equipment that were scaled with total assets last year
for firm i in year t
ROAit : Profit before taxable that was scaled with total assets last year for firm i in year
t
The above model is regressional cross-sectional by adding dummy industry and dummy year as control variables. Residuals of the above equation (εit) are used as proxies to measure accrual earning management which indicates the existence of accrual management discretion.
Corporate Governance. There are several mechanisms corporate governance for internal control, ie:
Masri: The Role of Governance In The Relationships of Familiy Company With Real…
Jurnal Akuntansi/Volume XXII, No. 01, Januari 2018: 51-67 57
and Fama and Jensen (1983); Chi et al. (2015) suggest that outside directors have an incentive to effectively monitor management actions to maintain their value of capital and reputation.
2. The Busy board of commissioner is a dummy variable equal to zero if more than 50% board of commissioners holds three jobs elsewhere, and 1 if otherwise. According to Cashman et al. (2012), the results of his research showed a negative relationship between performance with the busy board of commissioners, the busy board of commissioner then the lower variability of the company's performance. In this research because of the need of internal control over earnings management done by family company, hence using the opposite measurement from research of Cashman et al. (2005), that is less busy board of commissioner hence the better the company performance, so can do intense supervision and reduce companies to conduct earnings management that its manipulative and opportunistic.
3. McMullen (1996) found that firms with established audit committees were more likely to have reliable financial reporting (ie, the absence of errors, irregularities, or illegal acts), this study employed the Audit committee of Woidtke and Yeh (2013) ie financial expert and legal expert: (a) Financial expert Committee Audit is the ratio of the audit committee whose educational background is finance and accounting to the total members of the audit committee; (b) Legal expert Committee Audit is the ratio of the audit committee whose educational background is in the field of law and administration to the total members of the audit committee.
Control Variables. Based on previous research Cheng and Warfield (2005), Wang (2006), Achleitner (2014), and Chi et al. (2015) then the control variables used are as follows:
a. Size = Natural logarithm of total assets showing the size of the company. Research conducted by Gu et al. (2005) and Aini et al. (2006), suggests that assets can affect earnings management, the larger the size of firms the more likely it is for firms to make earnings management. In contrast, in a study conducted by Wang (2006) shows that size has a negative relationship with earnings management.
b. Lev = Total liabilities divided by total assets. These control variables are included because firms with high levels of leverage can’t obtain relief and are thus forced to renegotiate or restructure their debt that may avoid earnings management (Prencipe & Bar-Yosef, 2011) and Chi et al (2015). Supporting research conducted by Jensen (1986) suggests that debt creation will reduce the opportunistic behavior of managers. Conversely, on the other hand, research conducted by Beatty and Weber (2003) found that the company would be inclined to do accrual increase profits to avoid the company of the possibility of debt covenant violations. Thus leverage can be positively or negatively related to earnings management.
c. Growth is the growth rate of the company seen from changes in sales. Cheng and Warfield (2005) and Wang (2006) found that the higher the growth rate, the higher the abnormal accrual, the more positive the relationship between growth and earnings management
Masri: The Role of Governance In The Relationships of Familiy Company With Real…
Jurnal Akuntansi/Volume XXII, No. 01, Januari 2018: 51-67 58
Research Methods and Hypothesis Formulation. There are three research models used in this study as follows:
1. The research model for testing H1, H2, and H4 as follows
Where ß1 = Hypothesis 1, ß2 = Hypothesis 2, ß3-6 = Hypothesis 4
2. The research model by adding moderation of Accrual Earnings Management and Corporate Governance separately with family ownership to test H3 and H5, as follows:
Where ß7 = Hypothesis 3 and ß8-11 = Hypothesis 5
3. The research model by adding moderation of Accrual Earnings Management and Corporate Governance together with family ownership to test H6, as follows:
Where ß7-10 = Hypothesis 6 Where:
REM = Real earning management, using Roychowdhury (2006) measurements. Fam = Proxies for family ownership, using two proxies, FamFirm (dummy variable on the founder of family ownership in the board of commissioners and board of directors), and FamOwn (shareholding rate in the family company).
AEM = Accrual earning management as measured by the residual model of Khotari et al.(2005).
Indir = Proportion board of independent commissioners to total commissioners Busyboard = Dummy variable, ie 1, if the board of commissioners is not busy and 0
otherwise
FinCom_aud = The proportion of audit committees are experts in finance and educational background in accounting and finance
LegCom_Aud = The proportion of audit committees who are experts in law and educational background in the field of law.
Size = Natural logarithm of the total assets Lev = Total Liabilities divided by total assets Growth = Growth rate of sales
Loss = Dummy variable, ie 1 if net income negative and 0 otherwise.
Analysis Technique. The analytical techniques used in this study are quantitative descriptive analysis techniques and regression analysis of pool panel balance data to
REMit = ß0 + ß1Fam + ß2 AEM + ß3 Indir + ß4 BusyBoard +ß5 FinCom_Aud + ß6 LegalCom_Aud +
ß7 Size + ß8Leverage + ß9Growth + ß10Loss + ßYear +εit
REMit = ß0 + ß1Fam + ß2 AEM + ß3 Indir + ß4 BusyBoard +ß5 FinCom_Aud + ß6 LegalCom_Aud +
ß7Fam*AEM + ß8 Fam*Indir + ß9 Fam*BusyBoard +ß10 Fam*FinCom_Aud + ß11
Fam*LegalCom_Aud + ß12 Size + ß13Leverage + ß14Growth + ß15Loss + ßYear +εit
REMit = ß0 + ß1Fam + ß2 AEM + ß3 Indir + ß4 BusyBoard +ß5 FinCom_Aud + ß6 LegalCom_Aud +
ß7 Fam*AEM* Indir + ß8 Fam*AEM*BusyBoard +ß9 Fam* AEM*FinCom_Aud + ß10
Fam*AEM*LegalCom_Aud + ß11 Size + ß12Leverage + ß13Growth + ß14Loss + ßYear
Masri: The Role of Governance In The Relationships of Familiy Company With Real…
Jurnal Akuntansi/Volume XXII, No. 01, Januari 2018: 51-67 59
examine the effect of family ownership on Real Earnings Management and Corporate Governance moderation role as internal supervision.
Step Analysis. The analysis is done by using Eviews 6 and SPSS 22. The analysis step is as follows: (1) Conduct a descriptive statistical test. To provide an overview of the spread of data such as mean, median, maximum, minimum and standard deviation, and analyze the correlation of each variable; (2) Conducting hypothesis testing. To see the effect of family ownership on Real Earnings Management and Corporate Governance moderation role as internal supervision
THE RESULTS OF STATISTICAL TESTS
Overview and Sample Research. The sample in this study are all manufacturing companies listed on the Indonesia Stock Exchange period 2010 to 2013. Financial data and Annual reports obtained from the website BEI, www.idx.co.id. It also uses the company's financial statements available from datastream. Until the end of the 2013 period, there are 141 manufacturing companies registered in Indonesia. Based on the required data criteria, and outlier data released from the sample, the final sample in this study is 61 companies (244 companies per year) for the period 2010 to 2013.
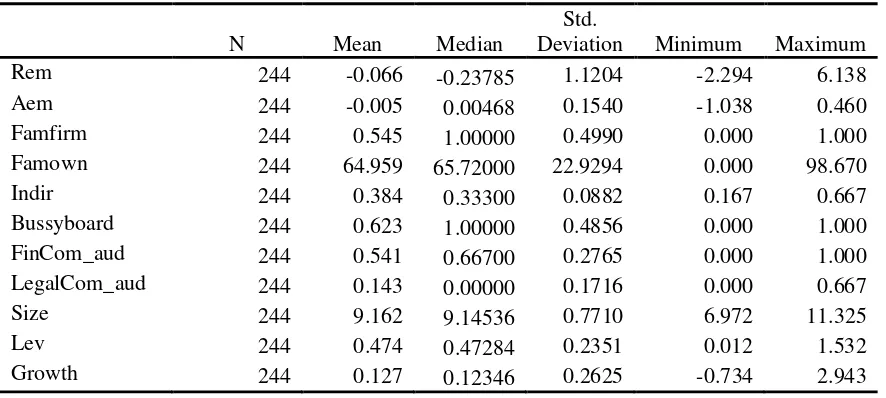
Descriptive Statistical Analysis and Correlation Test. Descriptive statistics in this study are intended to facilitate the observation through calculation of average value, median value, standard deviation, minimum value, and maximum value. Descriptive statistics of the variables used in this study are presented in table 1, which explains the mean, median, maximum, minimum and standard deviation values. The minimum value describes the lowest value of a variable. The average value represents the range of data obtained from the sum of all data and divides by the amount of data. Median shows the middle value. The maximum value describes the highest value of a variable. The standard deviation is the deviation of the meaned value squared for a variable.
Table 1. Descriptive Statistics
N Mean Median
Std.
Deviation Minimum Maximum
Rem 244 -0.066 -0.23785 1.1204 -2.294 6.138
Aem 244 -0.005 0.00468 0.1540 -1.038 0.460
Famfirm 244 0.545 1.00000 0.4990 0.000 1.000
Famown 244 64.959 65.72000 22.9294 0.000 98.670
Indir 244 0.384 0.33300 0.0882 0.167 0.667
Bussyboard 244 0.623 1.00000 0.4856 0.000 1.000
FinCom_aud 244 0.541 0.66700 0.2765 0.000 1.000
LegalCom_aud 244 0.143 0.00000 0.1716 0.000 0.667
Size 244 9.162 9.14536 0.7710 6.972 11.325
Lev 244 0.474 0.47284 0.2351 0.012 1.532
Masri: The Role of Governance In The Relationships of Familiy Company With Real…
Jurnal Akuntansi/Volume XXII, No. 01, Januari 2018: 51-67 60
Loss 244 0.168 0.00000 0.3747 0.000 1.000
Valid N
(listwise) 244
Source: Processed Data SPSS 22
From the average value of real earnings management variables show less than the median, which means that the company in this research sample is not so much doing real earning management. Likewise for the accrual earnings management variable whose average value is much smaller and negative than the median value, which means that the earnings management that many do in this research sample is income decreasing. For family ownership of family firm proxies, measured by the founding family who served as the board of commissioners and the board of directors of the company, shows the average value of 54%, which means more than half of the sample of this study is a family company. Similarly, for the proportion of family ownership that is the level of ownership of shares in the family company shows the average value is 64% level of ownership of shares in family companies.
Corporate Governance variable for internal control, Indir variable which is the proportion of independent board of commissioner against total commissioner, its average value is 38%, this is because of OJK regulation concerning proportion of minimum from independent commissioner is 30%, although from value there is still a minimum proportion of 16% which means less than the prevailing government regulation, therefore there needs to be more strict supervision from the government in this case OJK. For other Corporate Governance variables, the busy board shows the average value of 62% of the research sample is the non-busy commissioner board. Corporate Governance variables on financial expert committee audit and legal expert committee audit show that the proportion of financial expert is a greater proportion than legal expert.
Masri: The Role of Governance In The Relationships of Familiy Company With Real…
Jurnal Akuntansi/Volume XXII, No. 01, Januari 2018: 51-67 61
Bussyboard 0.030 -0.055 0.036 -0.195** -0.024 1 -0.065 0.014
FinCom_aud -0.094 -0.149* -0.010 -0.035 -0.017 -0.065 1 0.019
LegalCom_aud -0.225** -0.040 -0.220** -0.184** -0.060 0.014 0.019 1
**. Correlation is significant at the 0.01 level tailed).; *. Correlation is significant at the 0.05 level (2-tailed).
Source: Processed Data SPSS 22 (June 2015)
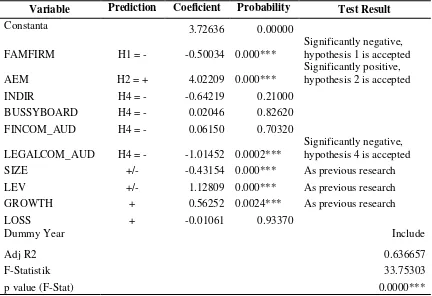
Hypothesis Testing Research. Model 1
Table 3. Test results for model 1 Method: Pool Panel Balance
REMit = ß0 + ß1Fam + ß2 AEM + ß3 Indir + ß4 Bussy Board +ß5 FinCom_Aud + ß6 LegalCom_Aud + ß7 Size + ß8Leverage + ß9Growth + ß10Loss + ßYear + εit
Variable Prediction Coeficient Probability Test Result
Constanta 3.72636 0.00000
FAMFIRM H1 = - -0.50034 0.000***
Significantly negative, hypothesis 1 is accepted
AEM H2 = + 4.02209 0.000***
Significantly positive, hypothesis 2 is accepted
INDIR H4 = - -0.64219 0.21000
BUSSYBOARD H4 = - 0.02046 0.82620 FINCOM_AUD H4 = - 0.06150 0.70320
LEGALCOM_AUD H4 = - -1.01452 0.0002***
Significantly negative, hypothesis 4 is accepted SIZE +/- -0.43154 0.000*** As previous research
LEV +/- 1.12809 0.000*** As previous research
GROWTH + 0.56252 0.0024*** As previous research
LOSS + -0.01061 0.93370
Dummy Year Include
Adj R2 0.636657
F-Statistik 33.75303
p value (F-Stat) 0.0000***
In eviews, p-value from t-statistics for one-way hypotheses is divided into two. The numbers in parentheses are p-values of t-statistics and f-statistics where *** significant 1%, ** significant 5%, and * significant 10%
Masri: The Role of Governance In The Relationships of Familiy Company With Real…
Jurnal Akuntansi/Volume XXII, No. 01, Januari 2018: 51-67 62
and REM, where the results show a positive and significant direction. While for corporate governance variable of internal control which proved significant is legal expert committee audit, that is with the higher portion of legal expert committee audit then the level of internal control will be better and prevent the company to do earnings management in real. For significant control variables and in accordance with the previous research are siz e, lev, and growth.
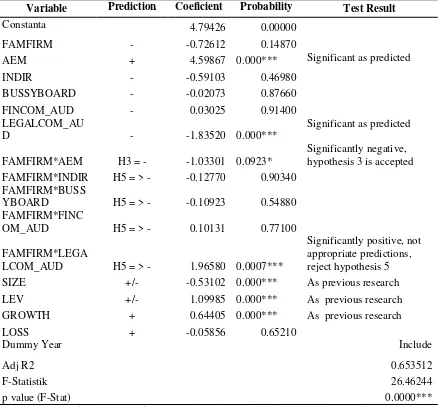
Model 2
Table 4. Test results for model 2 Method: Pool Panel Balance
REMit = ß0 + ß1Fam + ß2 AEM + ß3 Indir + ß4 Bussy Board +ß5 FinCom_Aud + ß6 LegalCom_Aud + ß7Fam*AEM + ß8 Fam*Indir + ß9 Fam*Bussy Board +ß10 Fam*FinCom_Aud + ß11 Fam*LegalCom_Aud + ß12 Size + ß13Leverage + ß14Growth + ß15Loss + ßYear +εit
Variable Prediction Coeficient Probability Test Result
Constanta 4.79426 0.00000
FAMFIRM - -0.72612 0.14870
AEM + 4.59867 0.000*** Significant as predicted
INDIR - -0.59103 0.46980
BUSSYBOARD - -0.02073 0.87660
FINCOM_AUD - 0.03025 0.91400
LEGALCOM_AU
D - -1.83520 0.000***
Significant as predicted
FAMFIRM*AEM H3 = - -1.03301 0.0923*
Significantly negative, hypothesis 3 is accepted
FAMFIRM*INDIR H5 = > - -0.12770 0.90340 FAMFIRM*BUSS
YBOARD H5 = > - -0.10923 0.54880 FAMFIRM*FINC
OM_AUD H5 = > - 0.10131 0.77100
FAMFIRM*LEGA
LCOM_AUD H5 = > - 1.96580 0.0007***
Significantly positive, not appropriate predictions, reject hypothesis 5
SIZE +/- -0.53102 0.000*** As previous research
LEV +/- 1.09985 0.000*** As previous research
GROWTH + 0.64405 0.000*** As previous research
LOSS + -0.05856 0.65210
Dummy Year Include
Adj R2 0.653512
F-Statistik 26.46244
p value (F-Stat) 0.0000***
Masri: The Role of Governance In The Relationships of Familiy Company With Real…
Jurnal Akuntansi/Volume XXII, No. 01, Januari 2018: 51-67 63
Table 4 shows the regression result from model 2 over the moderation variables between family firms with Accrual Earnings Management and Corporate Governance that have significant F-Statistic p-value at 1% level and adjusted R Square 65%, meaning independent variables tested together significantly affect the dependent variable. This model is for testing H3 and H5. The results of the test show that hypothesis 3 is accepted, proved to have a negative effect on the 10% level, as evidenced by the substitution relationship between Accrual Earnings Management to Real Earnings Management in the family company. The results of this study indicate that the family companies that do Accrual Earnings Management will increasingly not do Real Earnings Management. While to test hypothesis 5 that proved significant positive at level 1% is legal expert audit committee, that is a family company with big portion of legal expert audit committee which should act as an internal supervisor so it is increasingly looking for a gap to be able to do earnings management in real.The results of this study indicate in non-family companies, Corporate Governance variables on legal expert committee audit will negatively affect real earnings management. In contrast, the family firms over the legal expert committee audit variables will have a positive effect on real earnings management. These results indicate that with increasing legal expert committee audit on family companies it will seek a gap to be able to do real earnings management. For the control variable received and the same significant influence with model 1 that is size, leverage, and growth, with the direction according to previous research.
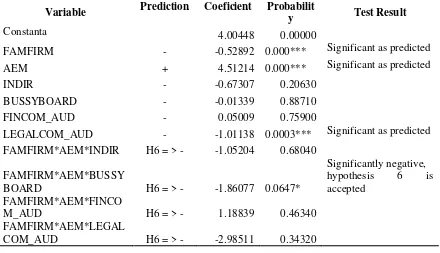
Model 3
Table 5. Test results for model 3 Method: Pool Panel Balance
REMit = ß0 + ß1Fam + ß2 AEM + ß3 Indir + ß4 Bussy Board +ß5 FinCom_Aud + ß6 LegalCom_Aud + ß7Fam*AEM + ß8 Fam*Indir + ß9 Fam*Bussy Board +ß10 Fam*FinCom_Aud + ß11 Fam*LegalCom_Aud + ß12 Size + ß13Leverage + ß14Growth + ß15Loss + ßYear +εit
Variable Prediction Coeficient Probabilit
y Test Result
Constanta 4.00448 0.00000
FAMFIRM - -0.52892 0.000*** Significant as predicted
AEM + 4.51214 0.000*** Significant as predicted
INDIR - -0.67307 0.20630
BUSSYBOARD - -0.01339 0.88710
FINCOM_AUD - 0.05009 0.75900
LEGALCOM_AUD - -1.01138 0.0003*** Significant as predicted FAMFIRM*AEM*INDIR H6 = > - -1.05204 0.68040
FAMFIRM*AEM*BUSSY
BOARD H6 = > - -1.86077 0.0647*
Significantly negative, hypothesis 6 is accepted
FAMFIRM*AEM*FINCO
M_AUD H6 = > - 1.18839 0.46340
FAMFIRM*AEM*LEGAL
Masri: The Role of Governance In The Relationships of Familiy Company With Real…
Jurnal Akuntansi/Volume XXII, No. 01, Januari 2018: 51-67 64
SIZE +/- -0.46403 0.000*** As previous research
LEV +/- 1.14517 0.000*** As previous research
GROWTH + 0.67071 0.000*** As previous research
LOSS + 0.06129 0.63760
Dummy Year Include
Adj R2 0.642189
F-Statistik 26.65471
p value (F-Stat) 0.0000***
In eviews, p-value from t-statistics for one-way hypotheses is divided into two. The numbers in parentheses are p-values of t-statistics and f-statistics where *** significant 1%, ** significant 5%, and * significant 10%
The results from table 5 are a regression of model 3 showing significant p-value and F-Statistics at 1% level, and R Square level of 64%. The results from table 5 show hypothesis 6 proved to have a significant effect in accordance with the prediction. The busy board is negatively significant at 10% level, which means that the less busy board of commissioners the higher the supervision is made, so for the family companies that do Accrual Earnings Management will further strengthen the negative effect on Real Earnings Management than non-family companies. For other hypothesis is proven and can be accepted in this model is the hypothesis 1, 2 and 4 were consistent hypotheses and predictions in accordance with the direction of models 1 and 2. Likewise for the control variable is size, leverage, and growth, with the direction in accordance with the previous research.
Test Sensitivity analysis. The sensitivity analysis test in this study used the proxy percentage of share ownership in the family company, the result is shown in the appendix. Sensitivity test results show consistent results for hypotheses 2, 3, and 6. While for hypothesis 1 is not proven in all three models. And for hypotheses 4 and 5 show mixed results on Corporate Governance variables. In model 1, hypothesis 4 is accepted for Corporate Governance variables on independent commissioners and legal expert audit committees with the negative direction in accordance with the hypothesis. In contrast to model 2 significant corporate governance variables on hypothesis 4 is the audit committee's finance expert indicates a positive direction, which means that the greater the proportion of audit committees that the expert in the financial sector encourages the company to earn real earnings management in non-family companies. This shows that in non-family companies with more financial expert in the audit committee will be more inclined to do real earnings management. These results indicate the lack of internal control.
Masri: The Role of Governance In The Relationships of Familiy Company With Real…
Jurnal Akuntansi/Volume XXII, No. 01, Januari 2018: 51-67 65
DISCUSSION
Conclusion. This study examines the effect of family ownership on Real Earnings Management with Corporate Governance variables on internal control as a moderating variable in the relationship. In addition, this study examines the role of Accrual Earnings Management on substitution with Real Earnings Management. This study uses 61 manufacturing companies data from 2010 to 2013, the total sample being 244 companies - year. The results are in accordance with the hypothesized, that family firms tend to negatively affect real earning management, supporting Achleitner (2014) research. This can be due to one side of the motivation of control as a strong impetus to Accrual Earnings Managment in the family company, while on the other hand family companies tend to dislike Real Earnings Management because of the negative performance impact.
In this study it is also evident that Accrual Earnings Management acts as a substitute for Real Earnings Management in a family company rather than a non-family company, supporting the results of research conducted by Achleitner (2014). The role of Corporate Governance as an internal control proves to negatively affect real earnings management in non-family enterprises, and can further strengthen the negative influence of family relationships with real earnings management. Although there are some opposite results to predictive directions, the more legal experts on audit committees in family firms tend to perform real earnings management. And the results of sensitivity analysis show that in non-family companies more and more financial experts on the audit committee will be more likely to do real earning management. The role of Corporate Governance on the substitution of Accrual Earnings Management and Real Earnings Management in family firms also shows the strengthening of negative relationships.
Limitations and suggestions Research. In this research, the measurement of Corporate Governance proxy still shows mixed results, this can be due to Corporate Governance data measured based on the analysis content, so it can cause bias, and annual report data disclosed in the sample company in Indonesia is not complete. In addition, in this study has not considered endogeneity factor on Corporate Governance variables, perhaps for future research, it can be done.
REFERENCES
Aini, A., Takiah, M.I., Pourjalali, H., and Teruya, J. (2006) “Earnings Management in
Malaysia: A Study on Effects of Accounting Choices”. Malaysian Accounting
Review, 5(1), 185-207.
Anderson, R. C. and Reeb, D. M. (2003) “Founding-Family Ownership and Firm
Performance: Evidence from the S&P 500”. The Journal of Finance, 58(3), 1301–
1328.
Anderson, R. C., And M. Reeb (2003b) "Who Monitors the Family?". Working paper,
American University and University of Alabama.
Anderson, R. C., & Reeb, D. M. (2004) “Board composition: Balancing family influence
Masri: The Role of Governance In The Relationships of Familiy Company With Real…
Jurnal Akuntansi/Volume XXII, No. 01, Januari 2018: 51-67 66
Achleitner, Ann-Kristin and Guenther, Nina and Kaserer, Christoph and Saciliano, Gianfranco, (2014). “Real Earnings Management and Accrual-Based Earnings Management in Family Firms”. European Accounting Review Forthcoming. Available at SSRN: http://ssrn.com/abstract=2383741
Arifin, Z. (2003). “Masalah Agensi dan Mekanisme Kontrol pada Perusahaan dengan Struktur Kepemilikan Terkonsentrasi yang Dikontrol Keluarga: Bukti dari Perusahaan Publik di Indonesia”. Unpublished Dissertation, FEUI Graduate Program in Management.
Barton, J., & Simko, P. J. (2002). “The balance sheet as an earnings management
constraint”. TheAccounting Review, p. 77, 1–27.
Beasley, M. (1996). “An empirical analysis of the relation between the board of director
composition and financial statement fraud”. The Accounting Review, 71, 443–465.
Beatty, A. and Weber, J. (2003). “The Effects of Debt Contracting on Voluntary
Accounting Method Changes” The Accounting Review, 78(1), 119–142.
Becker, C.L., Defond, M.L., Jiambalvo, J., and Subramanyam, K.R. (1998) “The Effect of Audit Quality on Earnings Management”. Contemporary Accounting Research, 15(1), 1-24.
Cashman, George D., Gillan, Stuart L., Jun, Chulhee., (2012) “Going overboard? On busy
directors and firm value”. Journal of Banking & Finance, 36, 3248-3259.
Chaney, P. K., Faccio, M., & Parsley, D. (2011). “The quality of accounting information
in politically connected firms”. Journal of Accounting and Economics, 51, 58–76.
Chen, S. S., & Huang, Y. S. (2014). “Corporate governance in emerging markets: An
introduction”. International Review of Economics and Finance, 32, 1–2.
Cheng, Q. And . D. Warfield., (2005). “Equity Incentives and Earnings Management”. The Accounting Review, 80, 441-476.
Chi, Ching Wen., Hung, Ken., Cheng, Hui Wen., Lieu, Pang Tien. (2015). “Family firms and earnings management in Taiwan: Influence of corporate governance”.
International Review of Economics and Finance, 36, 88–98.
Chung, R., Firth, M., and Jeong, B.K. (2005). “Earnings Management, Surplus Free Cash
Flow, and External Monitoring”. Journal of Business Research, 58, 766– 776.
Claessens, S., Djankov, S., Fan, J. P. H., & Lang, L. H. P. (2000) “The separation of
ownership and control in East Asia Corporation”. Journal of Finance Economics 58,
81-112
Cohen, D. A., & Zarowin, P. (2010). “Accrual-based and real earnings management activities around seasoned equity offerings”. Journal of Accounting and Economics, 50, 2–19.
Davids, J. H., Schoorman, F. D., & Donaldson, L. (1997). “Toward a stewardship theory
of management”. Academy of Management Review, 22, 20–47.
Dechow, P., Sloan, R., & Sweeney, A., (1995). Detecting earnings management. The Accounting Review 70, 193-225.
Fama, E. (1980). “Agency problems and the theory of the firm”. Journal of Political Economy, 88, 288–307.
Masri: The Role of Governance In The Relationships of Familiy Company With Real…
Jurnal Akuntansi/Volume XXII, No. 01, Januari 2018: 51-67 67
Fan, J., & Wong, T. J. (2002). “Corporate ownership structure and the informativeness of
accounting earnings in East Asia”. Journal of Accounting and Economics, 33, 401–
425.
Ge. W dan Kim, J.B (2014). “Real Earning Management and The Cost of New Corporate Bonds”. Journal of Business Research, 67: 641-647.
Graham, J., Harvey, R. and Rajgopal, S. (2005). “The Economic Implications of Corporate Financial Reporting. The Accounting Review, 80 (4), 1101-24.
Gu, Z., Lee, C.W.J. and Rosett, J.G. (2005). “What Determines the Variability of
Accounting Accruals?”. Review of Quantitative Finance and Accounting, 24, 313–
334.
Jensen, M.C.(1986). “Agency Costs of Free Cash Flow, Corporate Finance, and
Takeovers”. American Economics Review, 76(2), 323-329.
Kothari, S.P., Leone, A.J. and Wasley, C.E. (2005). “Performance Matched Discretionary
Accrual Measures”. Journal of Accounting and Economics, 39, 163–197.
La Porta, R., Lopez-de-Silanes, F., & Shleifer, A. (1999) “Ownership around the World”.
The Journal of Finance, Vol. 54, No. 2, pp. 471-517.
McMullen, D.A., (1996). "Audit committee performance: an investigation of the
consequences associated with audit committees”. Auditing: A Journal of Practice &
Theory 15, 87–103
Prencipe, A., & Bar-Yosef, S. (2011). “Corporate governance and earning management in family-controlled companies”. Journal of Accounting, Auditing, and Finance, 26, 199–227.
Roychowdhury, S. (2006). “Earnings Management through Real Activities Manipulation”. Journal of Accounting and Economics, 42 (3), 335-370.
Villalonga, B. and Amit, R. (2006) “How do family ownership, control and management
affect firm value?”, Journal of Financial Economics, 80(2), 385–417.
Wang, D. (2006). “Founding Family Ownership and Earnings Quality”, Journal of Accounting Research, 44(3), 619–656.
Woidtke, Tracie., Yeh, Yin-Hua., (2013).“The role of the audit committee and the
informativeness of accounting earnings in East Asia”. Pasific-Basin Finance
Journal 23, 1-24
Xu, Z. Randall & Yang, Yi. (2013). “Effect of Accounting Flexibility on Earning
Management Through Stock Repurchases”. International Business Research, 6 (10),
ISSN 1913-9004, E-ISSN 1913-9012. Published by Canadian Center of Science and Education
Young, M. N., Peng, M.W., Ahlstrom, D., Bruton, G. D., & Jiang, Y. (2008). “Corporate governance in emerging economies: A review of the principal–principal
perspective”. Technological Forecasting and Social Change, 75, 1388–1395.
Masri: The Role of Governance In The Relationships of Familiy Company With Real…
Jurnal Akuntansi/Volume XXII, No. 01, Januari 2018: 51-67 68
APPENDIX 1
Test results for model 1: Sensitivity Analysis Method: Pool Panel Balance
REMit = ß0 + ß1Fam + ß2 AEM + ß3 Indir + ß4 Bussy Board +ß5 FinCom_Aud + ß6 LegalCom_Aud +
ß7Size + ß8Leverage + ß9Growth + ß10Loss + ßYear +εit
Variable Prediction Coeficient Probability Test Result
Constanta 3.04174 0.00000
FAMOWN H1 = - 0.00147 0.48830
AEM H2 = + 4.29203 0.000***
Significantly positive, hypothesis 2 is accepted
INDIR H4 = - -1.07288 0.0461**
Significantly negative, hypothesis 4 is accepted
BUSSYBOARD H4 = - 0.02184 0.82960
FINCOM_AUD H4 = - 0.09644 0.57340
LEGALCOM_AUD H4 = - -0.69864 0.014**
Significantly negative, hypothesis 4 is accepted
SIZE +/- -0.38375 0.000*** As previous research
LEV +/- 1.01229 0.000*** As previous research
GROWTH + 0.68308 0.0005*** As previous research
LOSS + 0.08448 0.52860
Dummy Year Include
Adj R2 0.591363
F-Statistik 28.05076
p value (F-Stat) 0.0000***
In eviews, p-value from t-statistics for one-way hypotheses is divided into two. The numbers in parentheses are p-values of t-statistics and f-statistics where *** significant 1%, ** significant 5%, and * significant 10%
APPENDIX 2
Test results for model 2: Sensitivity Analysis Method: Pool Panel Balance
REMit = ß0 + ß1Fam + ß2 AEM + ß3 Indir + ß4 Bussy Board +ß5 FinCom_Aud + ß6 LegalCom_Aud +
ß7Fam*AEM + ß8 Fam*Indir + ß9 Fam*Bussy Board +ß10 Fam*FinCom_Aud + ß11
Fam*LegalCom_Aud + ß12 Size + ß13Leverage + ß14Growth + ß15Loss + ßYear +εit
Variable Prediction Coeficient Probability Test Result
Constanta 2.56508 0.01040
FAMOWN - -0.00614 0.55690
AEM + 6.29993 0.000*** Significant as predicted
Masri: The Role of Governance In The Relationships of Familiy Company With Real…
Jurnal Akuntansi/Volume XXII, No. 01, Januari 2018: 51-67 69
BUSSYBOARD - 0.33042 0.31800
FINCOM_AUD - 2.16074 0.0001***
Significantly positive, not as predicted
LEGALCOM_AUD - -1.26446 0.13530
FAMOWN*AEM H3 = - -0.03229 0.0172**
Significantly negative, hypothesis 3 is accepted
FAMOWN*INDIR H5 = > - 0.07560 0.0001***
Significantly positive, not as predicted
FAMOWN*BUSSYBOARD H5 = > - -0.00453 0.31940
FAMOWN*FINCOM_AUD H5 = > - -0.03499 0.000***
Significantly negative, hypothesis 5 is accepted
FAMOWN*LEGALCOM_AUD H5 = > - 0.00993 0.43290
SIZE +/- -0.32289 0.000*** As previous research
LEV +/- 0.89922 0.0001*** As previous research
GROWTH + 0.60955 0.0009*** As previous research
LOSS + 0.13720 0.28750
Dummy Year Include
Adj R2 0.65293
F-Statistik 26.3974
p value (F-Stat) 0.0000***
In eviews, p-value from t-statistics for one-way hypotheses is divided into two. The numbers in parentheses are p-values of t-statistics and f-statistics where *** significant 1%, ** significant 5%, and * significant 10%
APPENDIX 3
Test results for model 3: Sensitivity Analysis Method: Pool Panel Balance
REMit = ß0 + ß1Fam + ß2 AEM + ß3 Indir + ß4 Bussy Board +ß5 FinCom_Aud + ß6 LegalCom_Aud +
ß7Fam*AEM + ß8 Fam*Indir + ß9 Fam*Bussy Board +ß10 Fam*FinCom_Aud + ß11
Fam*LegalCom_Aud + ß12 Size + ß13Leverage + ß14Growth + ß15Loss + ßYear +εit
Masri: The Role of Governance In The Relationships of Familiy Company With Real…
Jurnal Akuntansi/Volume XXII, No. 01, Januari 2018: 51-67 70
Constanta 2.82656 0.00000
FAMOWN - -0.00032 0.88050
AEM + 6.24323 0.000*** Significant as predicted
INDIR - -1.20325 0.0233** Significant as predicted
BUSSYBOARD - -0.04793 0.63740
FINCOM_AUD - 0.08655 0.61790
LEGALCOM_AUD - -0.71384 0.0123** Significant as predicted
FAMOWN*AEM*INDIR H6 = > - 0.01019 0.77310
FAMOWN*AEM*BUSSYBOARD H6 = > - -0.00585 0.51590
FAMOWN*AEM*FINCOM_AUD H6 = > - -0.05252 0.001***
Significantly negative, hypothesis 6 is accepted
FAMOWN*AEM*LEGALCOM_AUD H6 = > - 0.00348 0.90800
SIZE +/- -0.33223 0.000*** As previous research
LEV +/- 0.89851 0.0002*** As previous research
GROWTH + 0.66291 0.0008*** As previous research
LOSS + 0.07863 0.55190
Dummy Year Include
Adj R2 0.610633
F-Statistik 23.41705
p value (F-Stat) 0.0000***