Mohammed M. Alani
Hissam Tawfi k
Mohammed Saeed
Obinna Anya
Editors
Applications of
Big Data
Analytics
Mohammed Saeed • Obinna Anya
Editors
Applications of Big Data
Analytics
Trends, Issues, and Challenges
Mohammed M. Alani
Al Khawarizmi International College Abu Dhabi, UAE
Mohammed Saeed
University of Modern Sciences Dubai, UAE
Hissam Tawfik
Leeds Beckett University Leeds, UK
Obinna Anya IBM Research San Jose, CA, USA
ISBN 978-3-319-76471-9 ISBN 978-3-319-76472-6 (eBook) https://doi.org/10.1007/978-3-319-76472-6
Library of Congress Control Number: 2018943141
© Springer International Publishing AG, part of Springer Nature 2018
This work is subject to copyright. All rights are reserved by the Publisher, whether the whole or part of the material is concerned, specifically the rights of translation, reprinting, reuse of illustrations, recitation, broadcasting, reproduction on microfilms or in any other physical way, and transmission or information storage and retrieval, electronic adaptation, computer software, or by similar or dissimilar methodology now known or hereafter developed.
The use of general descriptive names, registered names, trademarks, service marks, etc. in this publication does not imply, even in the absence of a specific statement, that such names are exempt from the relevant protective laws and regulations and therefore free for general use.
The publisher, the authors and the editors are safe to assume that the advice and information in this book are believed to be true and accurate at the date of publication. Neither the publisher nor the authors or the editors give a warranty, express or implied, with respect to the material contained herein or for any errors or omissions that may have been made. The publisher remains neutral with regard to jurisdictional claims in published maps and institutional affiliations.
Printed on acid-free paper
This Springer imprint is published by the registered company Springer International Publishing AG part of Springer Nature.
Big Data comes in high volume, velocity, and veracity, and from myriad sources, including log files, social media, apps, IoT, text, video, image, GPS, RFID, and smart cards. The process of storing and analyzing such data exceeds the capabilities of traditional database management systems and methods, and has given rise to a wide range of new technologies, platforms, and services—referred to as Big Data Analytics. Although the potential value of Big Data is enormous, the process and applications of Big Data Analytics have raised significant concerns and challenges across scientific, social science, and business communities.
This book presents the current progress on challenges related to applications of Big Data Analytics by focusing on practical issues and concerns, such as the practical applications of predictive and prescriptive analytics especially in the health and disaster management domains, system design, reliability, energy efficiency considerations, and data management and visualization. The book is the state-of-the-art reference discussing progress made and problems encountered in applications of Big Data Analytics, as well as prompting future directions on the theories, methods, standards, and strategies necessary to improve the process and practice of Big Data Analytics.
The book comprises 10 self-contained and refereed chapters written by leading international researchers. The chapters are research-informed and written in a way that highlights the practical experience of the contributors, while remaining accessible and understandable to various audiences. The chapters provide readers with detailed analysis of existing trends for storing and analyzing Big Data, as well as the technical, scientific, and organizational challenges inherent in current approaches and systems through demonstrating and discussing real-world examples across a wide range of application areas, including healthcare, education, and disaster management. In addition, the book discusses, typically from an application-oriented perspective, advances in data science, including techniques for Big Data collection, searching, analysis, and knowledge discovery.
The book is intended for researchers, academics, data scientists, and business professionals as a valuable resource and reference for the planning, designing, and implementation of Big Data Analytics projects.
Organization of the Book
The chapters of the book are ordered such that chapters focusing on the same or similar application domain or challenge appear consecutively. Each chapter examines a particular Big Data Analytics application focusing on the trends, issues, and relevant technical challenges.
Chapter1discusses how recent innovations in mobile technologies and advance-ments in network communication domain have resulted in the emergence of smart system applications, in support of the wide range and coverage provision, low costs, and high mobility. 5G mobile network standards represent a promising cellular technology to provision the future of smart systems data traffic. Over the last few years, smart devices, such as smartphones, smart machines, and intelligent vehicles communication, have seen exponential growth over mobile networks, which resulted in the need to increase the capacity due to generating higher data rates. These mobile networks are expected to face “Big Data” related challenges, such as explosion in data traffic, storage of big data, and the future of smart devices with various Quality of Service (QoS) requirements. The chapter includes a theoretical and conceptual background on the data traffic models over different mobile network generations and the overall implications of the data size on the network carrier.
Chapter 2 explores the challenges, opportunities, and methods, required to leverage the potentiality of employing Big Data into the assessing and predicting the risk of flooding. Among the various natural calamities, flood is considered one of the most frequently occurring and catastrophic natural hazards. During flooding, crisis response teams need to take relatively quick decisions based on huge amount of incomplete and, sometimes, inaccurate information mainly coming from three major sources: people, machines, and organizations. Big Data technologies can play a major role in monitoring and determining potential risk areas of flooding in real time. This could be achieved by analyzing and processing sensor data streams coming from various sources as well as data collected from other sources such as Twitter, Facebook, satellites, and also from disaster organizations of a country by using Big Data technologies.
all two-hidden layer architectures, the speed of the proposed methodology is faster than that of exhaustive training. Additionally, the optimized two-hidden-layer MLP of the proposed methodology has a similar performance to exhausting training. In essence, this chapter is an example of an engineering application of predictive data analytics for which “well-tuned” neural networks are used as the primary tool.
Chapter4discusses a Big Data Analytics application for disaster management leveraging IoT and Big data. In this chapter, the authors propose the use of drones or Unmanned Aerial Vehicles (UAVs), in a disaster situation as access points to form an ad hoc mesh multi-UAV network that provides communication services to ground nodes. Since the UAVs are the first components to arrive at a given disaster site, finding the best positions of the UAVs is both important and non-trivial. The deployment of the UAV network and its adaption or fine-tuning to the scenario is divided into two phases. The first phase is the initial deployment, where UAVs are placed using partial knowledge of the disaster scenario. The second phase addresses the adaptation to changing conditions where UAVs move according to a local search algorithm to find positions that provide better coverage of victims. The suggested approach was evaluated under different conditions of scenarios. The number of UAVs have demonstrated a high degree of coverage of “victims.”
From a Big Data Analytics perspective, the goal of the application is to determine optimum or near-optimum solutions in a potentially very large and complex search space. This is due to the high dimensionality and huge increase of parameters and combinatorics, with the increase in the number of UAVs and size and resolution of the disaster terrain. Therefore, this is considered an application of data analytics, namely prescriptive or decision analytics using computational intelligence techniques.
Chapter 5 proposes a novel health data analytics application based on deep learning for sleep apnea detection and quantification using statistical features of ECG signals. Sleep apnea is a serious sleep disorder phenomena that occurs when a person’s breathing is interrupted during sleep. The most common diagnostic technique that is used to deal with sleep apnea is polysomnography (PSG), which is done at special sleeping labs. This technique is expensive and uncomfortable. The proposed method in this chapter has been developed for sleep apnea detection using machine learning and classification including deep learning. The simulation results obtained show that the newly proposed approach provides significant advantages compared to state-of-the-art methods, especially due to its noninvasive and low-cost nature.
This chapter demonstrates a novel Resource Allocation Scheme (RAS) and algorithm along with a new 5G network slicing technique based on classification and measuring the data traffic to satisfy QoS for smart systems such as smart healthcare application in a smart city environment. The chapter proposes the RAS for efficient utilization of the 5G radio resources for smart devices communication.
Chapter7reports on an application of Big Data analytics in education. The past decade witnessed a very significant rise in the use of electronic devices in education at all educational levels and stages. Although the use of computer networks is an inherent feature of online learning, the traditional schools and universities are also making extensive use of network-connected electronic devices such as mobile phones, tablets, and computers. Data mining and Big Data analytics can help educationalists to analyze enormous volume of data generated from the active usage of devices connected through a large network. In the context of education, these techniques are specifically referred to as Educational Data Mining (EDM) and Learning Analytics (LA). This chapter discusses major EDM and LA techniques used in handling big data in commercial and other activities and provides a detailed account of how these techniques are used to analyze the learning process of students, assessing their performance and providing them with detailed feedback in real time. The technologies can also assist in planning administrative strategies to provide quality services to all stakeholders of an educational institution. In order to meet these analytical requirements, researchers have developed easy-to-use data mining and visualization tools. The chapter discusses, through relevant case studies, some implementation of EDM and LA techniques in universities in different countries.
Chapter 8 attempts to address some of the challenges associated with Big Data management tools. It introduces a scalable MapReduce graph partitioning approach for high-degree vertices using master/slave partitioning. This partitioning makes Pregel-like systems in graph processing, scalable and insensitive to the effects of high-degree vertices while guaranteeing perfect balancing properties of communication and computation during all the stages of big graphs processing. A cost model and performance analysis are given to show the effectiveness and the scalability of authors’ graph partitioning approach in large-scale systems.
Chapter9presents a multivariate and dynamic data representation model for the visualization of large amount of healthcare data, both historical and real-time for better population monitoring as well as for personalized health applications. Due to increased life expectancy and an aging population, a general view and understanding of people health are more urgently needed than before to help reducing expenditure in healthcare. The chapter proposes a multivariate and dynamic data representation model for the visualization of large amounts of healthcare data, both historical and real time.
chapter concludes with reliability similarity for comparable software based on the use of metrics for prediction of new software reliability. The reliability prediction presented in this chapter aims at allowing developers to operate resources and processes of verification and refactoring potentially increasing software reliability and cutting development cost.
Abu Dhabi, UAE Mohammed M. Alani
Leeds, UK Hissam Tawfik
Dubai, UAE Mohammed Saeed
1 Big Data Environment for Smart Healthcare Applications
Over 5G Mobile Network. . . 1 Mohammed Dighriri, Gyu Myoung Lee, and Thar Baker
2 Challenges and Opportunities of Using Big Data for Assessing
Flood Risks. . . 31 Ahmed Afif Monrat, Raihan Ul Islam, Mohammad Shahadat Hossain,
and Karl Andersson
3 A Neural Networks Design Methodology for Detecting Loss
of Coolant Accidents in Nuclear Power Plants. . . 43 David Tian, Jiamei Deng, Gopika Vinod, T. V. Santhosh,
and Hissam Tawfik
4 Evolutionary Deployment and Hill Climbing-Based
Movements of Multi-UAV Networks in Disaster Scenarios. . . 63 D. G. Reina, T. Camp, A. Munjal, S. L. Toral, and H. Tawfik
5 Detection of Obstructive Sleep Apnea Using Deep
Neural Network. . . 97 Mashail Alsalamah, Saad Amin, and Vasile Palade
6 A Study of Data Classification and Selection Techniques
to Diagnose Headache Patients. . . 121 Ahmed J. Aljaaf, Conor Mallucci, Dhiya Al-Jumeily, Abir Hussain,
Mohamed Alloghani, and Jamila Mustafina
7 Applications of Educational Data Mining and Learning
Analytics Tools in Handling Big Data in Higher Education. . . 135 Santosh Ray and Mohammed Saeed
8 Handling Pregel’s Limits in Big Graph Processing in the
Presence of High-Degree Vertices. . . 161 Mohamad Al Hajj Hassan and Mostafa Bamha
9 Nature-Inspired Radar Charts as an Innovative Big Data
Analysis Tool. . . 177 J. Artur Serrano, Hamzeh Awad, and Ronny Broekx
10 Search of Similar Programs Using Code Metrics and Big
Data-Based Assessment of Software Reliability. . . 185 Svitlana Yaremchuck, Vyacheslav Kharchenko,
and Anatoliy Gorbenko
Big Data Environment for Smart
Healthcare Applications Over 5G Mobile
Network
Mohammed Dighriri, Gyu Myoung Lee, and Thar Baker
1.1
Introduction
Due to the fast growth of wireless network technologies (e.g. 5G) and ever-increasing demand for services with high quality of service (QoS) request [1], the managing of network resources becomes a permanently more challenging step that requires being correctly designed in order to advance network performance. It is also expected that the smart devices data traffic will rise quickly due to the growing use of the smart devices (e.g. smartphones, traffic control and blood pressure sensor) in numerous applications. The applications’ areas of smart devices contain, for example, smart office, smart traffic monitoring, smart alerting system, smart healthcare system and logistics system [2, 3]. Furthermore, smart devices communication offers ubiquitous connectivity between smart devices that allows the interconnection of devices, for instance, laptops, smart sensors, computers, etc., to perform several automatic operations in various smart device applications. In this situation, network slicing [4] is getting an always-increasing importance as an effective approach to introducing flexibility in the management of network resources. A slice is a gathering of network resources, selected in order to satisfy the demands (e.g. in terms of QoS) of the service(s) to be delivered by the slice [5,6]. The aim of slicing is to introduce flexibility and higher utilization of network resources by offering only the network resources necessary to fulfil the requirements of the slices enabled in the system.
An assisting aspect of network slicing is the virtualization of network resources, which allows network operators to share the common physical resources in a flexible, dynamic manner in order to utilize the existing resources in a more effective
M. Dighriri () · G. M. Lee · T. Baker
Department of Computer Science, Liverpool John Moores University, Liverpool, UK e-mail:[email protected];[email protected];[email protected]
© Springer International Publishing AG, part of Springer Nature 2018 M. M. Alani et al. (eds.),Applications of Big Data Analytics,
https://doi.org/10.1007/978-3-319-76472-6_1
approach [7]. In our proposal, 5G radio resources are efficiently utilized as the smallest unit of a physical resource blocks (PRBs) in a relay node by allocating the data traffic of several devices as separate slices based on QoS for each application. Virtualization of network resources is presently investigated in literature particularly by concentrating on the virtualization of network functionalities [7–9]. Due to the various QoS demands and the limitation of network resources, competently allocate network resources between service slices and user equipment (UEs) are a major issue [11,12].
1.1.1
Smart Devices
Smart devices convey small- and large-sized data with diverse QoS requirements. For instance, smart healthcare devices transmit small-sized data but are delay sensitive. The physical resource block is the smallest radio resource, which is allocated to a single device for data transmission in 4G or 5G. In the smart device applications with devices transmit small-sized data, the capacity of the PRB is not fully utilized. This results in significant degradation of the system performance. This chapter proposes a RAS for efficient utilization of the 5G radio resources for smart devices communication. In the proposed scheme, 5G radio resources are efficiently utilized by aggregating the data of several smart devices. The resources are shared by the smart devices to improve the spectral efficiency of the system.
1.1.2
Future Challenges
Fig. 1.1 Physical Resource Block (PRB)
If one PRB is allocated to a single smart device for data transmission of just a few bytes, then it might cause severe wastage of radio resources; also, the different types of data traffic should be considered in 5G slices approach. Therefore, the full radio resources utilization and data traffic classification should be a brilliant solution data traffic explosion and the fairness of services in the near future.
1.2
Background
1.2.1
5G Enabling Technologies
1.2.2
Infrastructure-Based RNs
The RNs are categorized into fixed and mobile RNs depending upon the infras-tructure. RNs are used in distinct scenarios to improve data rates, coverage and to facilitate UEs indoor and outdoor movements. The RNs can provision UEs movements from indoor to outdoor. In addition, UEs experience satisfactory coverage through mounted RNs such as at the top of a bus or a train. The further classifications of the infrastructure-based RNs are given below [15].
1.2.2.1 Fixed Relay Nodes
Fixed RNs are mainly used to advance the coverage for those UEs, which are not close to the regular donor eNB (DeNB), or base station usually exists at the corner of the cells. Furthermore, the coverage holes due to shadowing are also improved. Fixed RNs can extend the cell coverage for the users outside the coverage of the regular base stations, as shown in Fig. 1.2, the functionalities of fixed RNs. The fixed RNs contain comparatively small antennas as compared to the antennas at the base stations. The RNs antennas are normally positioned at the top of a building, tower, poles, etc.
1.2.2.2 Mobile Relay Nodes
According to [16], 3GPP has considered mobile RNs to provide satisfactory services to the users in fast moving trains. However, in the recent literature, it has been shown that the mobile RNs can also professionally improve the services in public vehicles,
Fig. 1.3 Mobile RN
for instance, buses and trams. The purpose of mobile RNs is to offer coverage within a moving environment. The mobile RNs are positioned on the vehicle, train, etc. and create a communication path between the mobile UEs and the base station. The RNs communicate with the base station through the mobile relay link (backhaul) whereas using access link with the mobile UEs. Due to the vehicle restrictions and other safety measures, antenna size of the mobile RNs is kept small; the functionalities of mobile RNs are shown in Fig.1.3.
1.2.3
5G Network Slicing
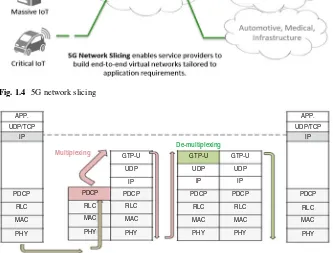
5G as a new generation of the mobile network is being actively discussed in the world of technology; network slicing surely is one of the most deliberated technolo-gies nowadays. Mobile network operators such as China Mobile and SK Telecom and merchants such as Nokia and Ericsson are all knowing it as a model network architecture for the coming 5G period [17]. This novel technology allows operators slice one physical network among numerous, virtual, end-to-end (E2E) networks, each rationally isolated counting device, access, transport and core networks such as separating a hard disk drive (HDD) into C and D drives and devoted for diverse kind of services with different features and QoS requirements. Every network slice and committed resources, for example, resources within network functions virtualization (NFV), software-defined networking (SDN), cloud computing, network bandwidth, QoS and so on, are certain as seen in Fig.1.4[18,19].
1.2.3.1 Data Traffic Aggregation Model
Fig. 1.4 5G network slicing
Fig. 1.5 Smart devices data packets flow diagram
performs header compression, retransmission and delivery of PDCP Session Data Units (SDUs), duplicate detection, etc. In the proposed model, PDCP layer is used for the aggregation of the smart devices data in the uplink. The main reason for selecting PDCP for aggregation in the uplink is to aggregate data with a minimum number of the additional headers as shown in Fig.1.5.
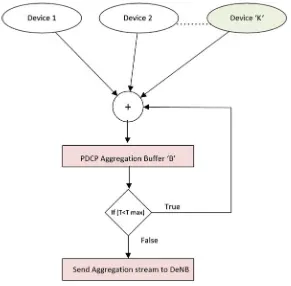
Fig. 1.6 Smart devices data aggregation algorithm
One single aggregation buffer B at the RN is considered to aggregate smart devices data traffic. This buffer aggregates data from different smart devices ensuring QoS for both the 5G and smart devices data traffic. In this implementation, RN is used for smart devices and base station for 5G data traffic. In order to reach the maximum performance improvements in spectral efficiency, packet propagation delay and cell throughput, we consider scenarios in which all the smart devices communicate with the base station through a RN. The smart devices data aggregation algorithm is shown in Fig.1.6and described as follows:
• Data fromKsmart devices are considered for aggregation.
• The essential parameter for smart devices data aggregation is the maximum delay timeTmaxfor the packet at the RN.
The data packets from a device having the highest priority face the smallest delay. Therefore, we initiate theTmax value as the inter-send time of the smart devices data with the highest priority. For example, in the simulation setup for distinct smart device applications, the inter-send time of the smart devices traffic model is 1 s, which is the maximum time a packet is delayed at the RN. Thus, the value of the Tmaxis initiated as 1 s, which means that the data packets received from the distinct smart devices are delayed for 1 s at the RN.
The value ofTmax is adaptive, i.e. the algorithm updates the value ofTmaxif RN receives packets from a device, which has higher priority than the priorities of all the other devices in the queue of the RN. The data from all the smart devices are buffered at the RN. The individual IP headers of all the smart devices are kept intact. The data packets are buffered until time delay approachesTmax. In order to compare the performance of data aggregation model in narrowband and broadband smart devices application scenarios, the aggregation scale for smart device is kept 1 (unaggregated), 5, 10, 15 and 20 in both cases. The aggregation scale represents the number of devices, which are aggregated. For example, in a scenario with 180 smart devices, the aggregation scale of 5, 10, 15 and 20 means that the data from the group of 5, 10, 15 and 20 devices is aggregated at the RN, respectively.
The aggregated data is sent to the base station through theUninterface where the data is de-multiplexed. The individual IP streams are then sent to the respective application server by the base station.
The smart device packets flow from the smart devices to the aGW through RN.K smart device transmits data packets to the RN, which are collected at the PHY layer of the RN. The packets are transported to the PDCP layer of the RN on the uplink. The IP packets are packed according to their quality control identifier (QCI) values in the aggregation buffer. The aggregation buffer collects packets from several smart devices. The data packets are placed in the aggregation buffer according to the packet arrival from the different devices. The detailed structure of the aggregated data Model is depicted in Fig.1.5,where only the layer two protocols are presented to illustrate the aggregation of the smart devices data. The RN PHY layer receives the data packets in the form of distinct transport block size (TBS). The TBS is shown from 1 toK, which shows the TBS transmitted by the smart devices at the RN. The data packets arrive at the RLC through MAC layer. The RLC headers are removed, and the remaining protocol data unit (PDU) is transported to the PDCP. The received PDUs at the PDCP layer comprised of the individual IP headers of each smart devices and pack into single PDCP buffer.
1.2.4
Resource Allocation Scheme (RAS)
for each service (application) layer. Therefore, we will clarify the main 5G network architecture layers, which are physical/MAC layers, network layers, open transport protocol (OTA) layers and service layers.
In this case, more study is needed on the virtualization of radio resources in order to perform the resource allocation scheme (RAS) for network slices. Certainly, the main aspect to be considered is the way radio resources are allocated to dissimilar slices in order to achieve the requirements of such slices. The duty relevant to (RAS) becomes more challenging with network slicing, as it introduces a two-tier priority in the system. The first tier refers to the priority of different slices, i.e. inter-slice priority, as each slice has its own priority defined according to the agreements between the network provider and the slice owner. The second tier refers to the priority between the users of the same slice, i.e. intra-slice priority. Once looking at the solutions exploited over existing 4G systems to cope with radio resources, it obviously emerges that 4G networks are able to maximize the QoS of the served users and, however, are not capable of performing the resource allocation in slicing environments [13]. This limitation is due to the fact that RAS in 4G systems is performed by assigning the priorities to the requested services via the UE. This method thus fails when considering that in 5G systems different UEs may belong to different slices with different priorities, and thus such UEs should be managed by considering the priority of the slice they belong to plus the priority of the service they need.
In this chapter, we propose a novel RAS; as shown in Fig.1.7, it exploits a two-tier priority levels. Our proposal relies on the idea that network slices communicate to an admission control entity with the desired QoS level. The RAS, based on the priority of the slice, decides about serving the slice. Finally, according to the
and intra-slice priority, the virtual network allocates the physical radio resources to the UEs of the admitted slices. According to the decision of the RAS, the resource allocation mission is performed with the purpose to maximize the quality of experience (QoE) of the users inside each slice, by considering the inter-slice priority. In this chapter, the QoE is measured by considering the effective throughput experienced by the users, normalized according to their maximum demanded data rate. With this target, the resources allocated to a slice with low priority could be reduced, if needed, down to the minimum amount capable of meeting the basic QoS requirements to admit new slice(s) with higher priority. Therefore, doing our proposal dynamically changes a number of network resources allocated to network slices.
According to the packets load without affecting the QoE of the users and while improving the network utilization. To summarize, the main contributions of this chapter could be listed as follows:
• A novel RAS with two-tier priority level has been proposed in our virtualized 5G system model.
• The proposed RAS dynamically sets the resources allocated to allow slices according to the current traffic load and based on efficiently utilizing the smallest untie of PRB by aggregating the data of several devices.
• Inter-slice and intra-slice priority order have been considered into account for assigning the QoE maximization problem of resource allocation task. Since priority orders for QoE purpose can advance the satisfactory level of UEs and network utilization.
1.3
Resource Allocation Scheme Environment
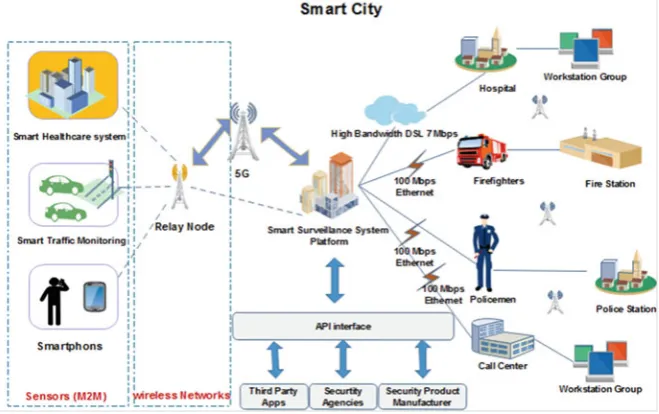
Fig. 1.8 Smart systems in smart city use case
1.3.1
Related Works
In a literature review, numerous solutions for efficiently enhancing virtualization of network resources have been considered to improve the QoE of UEs and network resource utilization [9]. A competent wireless network virtualization for LTE systems has been suggested in [10], which proposes a slicing structure to efficiently allocate physical resource blocks to diverse service providers (SPs) in order to maximize the utilization of resources. The approach is dynamic and flexible for addressing arbitrary fairness requirements of different SPs. Correspondingly, [20] proposed a framework for wireless resource virtualization in LTE system to allow allocation of radio resources among mobile network operators. An iterative algorithm has been proposed to solve the Binary Integer Programming (BIP) with less computational overhead. However, above considered schemes do not take the priority among different slices, besides the priority among the users within the same slice.
In [21], a scheme for allocating downlink network resources has been proposed. The scheme decides to accept a novel service only if the provisioning of this new service does not affect the throughput of the services in the cell. Consequently, this work does not take into consideration the dynamic modification of the QoE experienced by mobile users in order to increase network capacity and resource utilization.
Centralized joint power and RAS for prioritized multi-tier cellular networks have been proposed in [21]. The scheme has been developed to admit users with higher-priority requirement to maximize the number of users. In this case, the higher-priority is only considered at the user level, and, thus, this work fails in guaranteeing differentiation in case users belong to slices with different priorities.
1.3.2
System Models
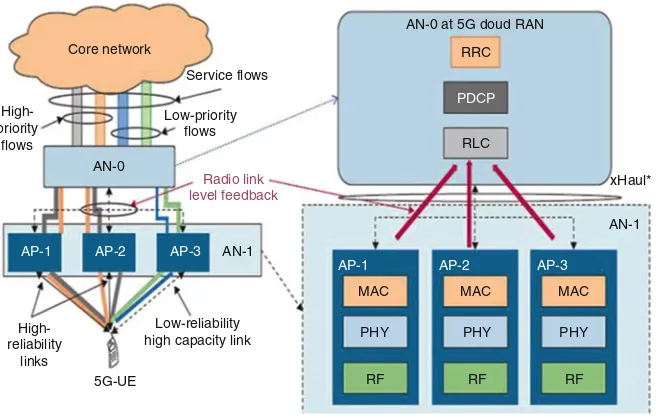
As depicted in Fig.1.9, our model consists of four main elements: the service slice layer, the virtual network layer, the physical resources and the RAS.
1.3.2.1 Service Slices
The service slices offer different services (e.g. smartphones, smart traffic monitoring and smart healthcare system) which need resources to be served. We designate with S= {1, 2, 3...S}the set of slices in the virtual network. Each sliceshas a set of UEs, such a set is symbolized byUs= {1, 2...Us}. Each slicesperforms a request to the RAS in terms of QoS restraints. In this chapter, we model such a request with
RSminsandRSmax, which denote the minimum and maximum data rates associated
with the slices, respectively. Each slicesis characterized by a priority,s, where such priorities are defined with the constraint that
s∈S
ps = 1. Similarly, each
useru belonging to the slice s, i.e. us, is characterized by a priorityµus, where
us∈U s
µus=1.
1.3.2.2 Virtual Network
The virtual network layer delivers an abstraction of the physical network resources. According to the decisions of the admission control, the virtual network slices the resources of the network to accommodate different slices. The virtual network receives the requests of different slices in terms of UEs to be served for each slice and executes the subsequent allocation of physical resources according to the inter-and intra-slice priority while considering the QoE of UEs.
With this aim, (1.10), we can define:
qus= s. The overall s; QoEusis the data rate of the of users, belonging to slice s can be computed as:
E [Q]= 1
T Qt (1.6)
whereTis the overall number of considered scheduling frames.
1.3.2.3 Physical Resources
The physical resources denote the radio resources available in the virtual network. For the purpose of simplicity, we refer to the downlink channel of one macro-cell. The total available bandwidth is indicated by B MHz. The set M = {1, 2...M}represents the available subchannels, where the bandwidth of the generic subchannelmisbm=MB. The total transmit powerPTOTis uniformly allocated to each subchannel, i.e.pm=MB.
When PM is assigning the physical resources, we consider the channel conditions of the UEs. We assume that channel condition is determined by transmission path loss and shadowing components [22]. The path loss and the shadowing fading path loss are assumed to be a Gaussian random variable with zero mean andσ standard deviation equal to 8dB[22]. So, the path loss is based on the distance value dus between a generic UE and the macro-cell, which is given in Eq.1.7.
P L(dus)=128.1+37.6 log 10(dus)+log 10(Xus) (1.7)
where UEXusis the log-normal shadow fading path loss of UE [22]. We also assume that the macro-cell receives perfect channel gain information from all UEs belong to different service slices, wherehm,usis the subchannel gain for the UEuwithin slicesand can be defined ashm,us=10−PL(dus)/10 [22]. The data rate of the UE with a slices, denoted with rus, can be defined in Eq.1.8[23].
rus= m∈M
αm, usbm
1+pm|hm, us|2 N0bm
(1.8)
whereN0 is the noise spectral density andαm,usis the situation of the UEuswhich has been described in Eq.1.9.
αm, us =1
0 if sub−channelmis assigned tousotherwise (1.9)
1.3.3
Two-Tier Scheme and Resource Allocation
1.3.3.1 Services Allocation
The 5G mobile network terminal offers exceptional QoS through a diversity of networks. Nowadays, the mobile Internet users choose manually the wireless port of different Internet service providers (ISP) without having the opportunity to exploit the QoS history to choose the suitable mobile network linking for a provided service. In the future, the 5G phones will offer a chance for QoS analysis and storage of measured data traffic in the mobile network terminal. There are diverse QoS parameters (e.g. bandwidth, delay, jitter and reliability), which will support in future of 5G mobile running in the mobile terminal. System processes will offer the best appropriate wireless connection based on needed QoS automatically. Therefore, we will consider various types of priorities as service allocation as shown in Figs.1.10 and1.11[23]. These priority types based on different QoS requirement by various users and services.
Smartphones
Smartphones and tablets are recent technologies that are represented as popular data traffic. Although smartphones are expected to continue as the key personal device and have more development in terms of performance and ability, the number of personal devices growth was driven by such devices as wearable or sensors to reach millions in 2020. In these devices, the content type of mobile streaming is video; the total of the flow packets is regularly numerous megabytes or even tens of megabytes; it is many of packets; the transmission way is usually continual transmission; the priority is generally low due to the video requires broad bandwidth and is likely to be blocked in congestion [1].
Core network
Fig. 1.11 Services allocation priorities architectural review
Smart Healthcare System
The smart healthcare system as sensitive data traffic is a promising model, which has currently achieved extensive attention in research and industry. A sensor body area network (BAN) is generally positioned nearby the patient to gather information about the numerous health parameters, for instance, blood pressure, pulse rate and temperature. Moreover, the patients are also monitored repeatedly by placing smart device sensors on the body of the patient when they are outside the hospitals or home. For handling critical situations, alarms are triggered to send messages to the related physicians for urgent treatment [4]. In a smart healthcare system scenario, in order to monitor the patients frequently outside the medical centres (e.g. hospitals), the patients are equipped with smart devices that monitor various health parameters.
Smart Traffic Monitoring
information from devices positioned to monitor emergency situations is transmitted to other networked vehicles within the communication range. To prevent any more accidents, the connection between the vehicles and the servers should be very fast for the detection of emergency messages and delivery of alerting messages. Since the reply time of the warning messages is very small, collision avoidance services request a high level of QoS (i.e. low latency), which can be supported by the 5G cellular networks. According to [1], the alerting messages are small size and must only be sent in serious circumstances for effective using of the communication network bandwidth. Traffic and infrastructure management play an important role in monitoring the issue of traffic congestion.
1.3.3.2 Service Slices Strategy
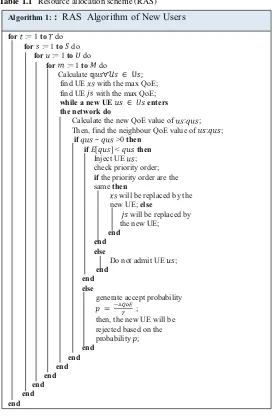
A RAS based on priority has been designed in algorithm (Table1.1.) This scheme can be used to cope with the entrances of new slices or users and provides a global optimization of the resources allocated to service slices. For the purpose of simplicity, algorithm 1 denotes to the RAS of novel UEs belonging to the same slice. The steps of our proposed RAS can be applied for admission control of new slices, by simply adjusting the parameters under consideration. When the new UE arrives at the network, by considering the QoE of the users in the same slice, we can derive an acceptance probability of the novel user in the virtual network by considering the constraints in terms of intra-slice priority as well as the QoE of served UEs. In our RAS, new UEs are accepted if the existing resources are sufficient to guarantee to satisfy at least the demand on the minimum data rate. The set of accepted users is thus offered as input to the resource allocation process.
1.3.3.3 Resource Allocation
The overall problem under consideration during the resource allocation step is the maximization of the QoE of UEs, by simultaneously considering the inter- and intra-slice priority. This problem can be formulated as in Eq.1.10.
Table 1.1 Resource allocation scheme (RAS) find UE with the max QoE;
while a new UE ∈ enters the network do
Calculate the new QoE value of : ; Then, find the neighbour QoE value of : ;
if − >0then ifE[ ] < then
Inject UE ; check priority order;
ifthe priority order are the same then
then, the new UE will be rejected based on the
Algorithm 1:: RAS Algorithm of New Users
RSmin≤rus≤RSmax, (1.11b)
than 1; as a consequence, the higher the priority of a slice, the lower the value ofρs. This happens similarly for the users, i.e. the higher the priority of a user; the lower is the valueUus. The resource allocation procedure is performed by considering the physical resources available in the network as well as the channel conditions of the UEs.
1.4
Simulation Approach
The Optimized Network Engineering Tool (OPNET) is simulation used to assess the performance of the proposed scheme. Several scenarios are simulated to evaluate the impact of smart devices data traffic on regular 4G and 5G mobile networks data traffic. The simulated 4G and 5G data traffic classes include File Transfer Protocol (FTP), Voice over IP (VoIP) and video users. The scenarios are categorized into first scenario aggregation PRBs with RAS, second scenario aggregation PRBs without RAS and third scenario without both aggregation PRBs and RAS. The results show the significant impact of smart devices data traffic on low-priority data traffic. The end-to-end network performance has been improved by allocated data of several smart devices, which is determined by simulating several scenarios. Considerable performance improvement is achieved in terms of average cell throughput, FTP average upload response time, FTP average packet end-to-end delay and radio resource utilization [24].
1.4.1
Simulation Setup
The LTE-A node protocols, which we have developed to work with the 5G mobile network. The remote server supports email, VoIP, FTP and video applications in the form of smart systems. The remote server and the Access Gateway (aGW) are interconnected with an Ethernet link with an average delay of 20 ms. The aGW node protocols include Internet Protocol (IP) and Ethernet. The aGW and Enb nodes (eNB1, eNB2 ...) communicate through IP edge cloud (1, 2, 3 and 4). QoS parameters at the transport network (TN) guarantees QoS parameterization and traffic difference. The user mobility in a cell is matched by the mobility model by updating the location of the user at every sampling interval. The user mobility information is stored on the global server (global UE server). The channel model parameters for the air interface contain path loss, slow-fading and fast-fading models. The simulation modelling mostly focuses on the user plane to perform end-to-end performance evaluations. An inclusive explanation of the LTE-A simulation model and details about the protocol stacks can be found in [24].
Table 1.2 Simulation parameters
PRBs for RN 3 PRBs are allocated to RN by DeNB to evaluate PRB utilization
Type of RN Fixed
RN 1 Support by 4 antennas, 10 MHz TDD RN2 Support by 3 antennas, 5 MHz TDD RN3 Support by 2 antennas, 3 MHz TDD TBS capacity 1608 bits against MCS 16 and PRBs 5
Available service rateTBS—overhead(bits/TTI) 1608(TBS)– 352(overhead)=1256bits/TTI Simulated scenarios Aggregation with RAS
Aggregation without RAS Without Aggregation and RAS Terminal speed 120 km/h
Mobility model Random Way Point (RWP) Frequency reuse factor 1
System bandwidth 5 MHz
Path loss 128.1+37.6log10(R). R in fan
Slow fading Log-normal shadowing, correlation 1, deviation 8 Db Fast fading Jakes-like method
UE buffer size ∞
RN PDCP buffer size ∞
Power control Fractional PC,α.=0.6,Po= −58 dBm Applications Email, VoIP, Video and FTP
1.4.2
QoS of Radio Bearers
provides almost same services to the packets which are linked to individual or same bearer. For establishing a communication path between UE and PDN, UE attempt to generate a bearer by default. Such bearers are called default bearers. The other bearers are named as dedicated bearers which are established to the PDNs. Establishing more than one bearer is possible. This is because one user demands several services, and each service demands specific bearer. For example, if a bearer is established, it is possible to generate more bearers in the presence of an existing bearer.
Moreover, the QoS value of an existing and newly created bearer is possible to vary. The bearer can be classified into Guaranteed Bit Rate (GBT) and Non-Guaranteed Bit Rate (Non-GBR).
• The GBR bearer has a minimum bandwidth which is allocated by the network for various services such as voice and video communication, regardless of that are used or not. Due to dedicated system bandwidth, the GBR bearer does not undergo any packet loss due to congestion and are free from latency.
• Non-GBR bearer is not allocated a specified bandwidth by the network. These bearers are used for best-effort services such as web browsing, email, etc. These bearers might undergo packet loss due to congestion.
• Quality control identifier (QCI) describes how the network treats the received IP packets. The QCI value is differentiated according to the priority of the bearer, bearer delay budget and bearer packet loss rate. 3GPP has defined several QCI values in LTE which are summarized in Table1.3.
1.4.3
Radio Resource Allocation Algorithm
Packet scheduling is the distribution of radio resources between the radio bearers in a cell by the eNB. In 3GPP LTE standards, this task is performed by the MAC scheduler in the eNB. The allocation of the downlink and uplink radio resources by
Table 1.3 LTE QCI values [6]
QCI Resource Delay Priority Error Service type 1 GBR Non GBR 100 ms 2 10−2 Conversational (VoIP)
2 150 ms 4 10−3 Conversational (Video)
3 50 ms 3 10−3 Real time gaming
4 300 ms 5 10−6 Non conversational voice
5 100 ms 1 10−6 IMS signalling
6 300 ms 6 10−6 Video Buffered streaming
7 100 ms 7 10−3 TCP based (email. HTTP, FTP)
8 300 ms 8 10−6 Voice, video and interactive gaming
the eNB to the UEs depends upon the data present in the buffers of the eNB and the UEs, respectively. If the data for a particular UE is present in the buffer of the eNB, then the eNB allocates radio resources to the UE for downlink transmission if eNB has enough available radio resources, and the QoS requirements of the other UEs located in the coverage area of the eNB are fulfilled. Similarly, in uplink transmission, the UEs transmit Buffer Status Report (BSR) information to the eNB for granting radio resources if there is data present in the buffer of the UEs. UE BSR information also identifies the types of traffic in the UE buffer. The eNB allocates radio resources for downlink and uplink according to the radio bearers QoS requirements of the UE. Time Domain-Maximum Throughput (TD-MT) scheduler provides the radio resources to the UEs close to eNB and bears good channel conditions. The users at the cell-edge may not get radio resources. The TD-MT scheduler provides maximum throughput at the cost of fairness [25], which can be expressed simply as in Eq.1.12:
PkT D=rk(t) (1.12)
1.5
Simulation Scenarios
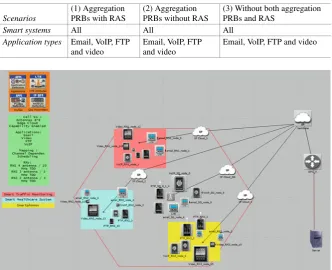
Table 1.4 Simulation scenarios
Scenarios
(1) Aggregation PRBs with RAS
(2) Aggregation PRBs without RAS
(3) Without both aggregation PRBs and RAS
Smart systems All All All
Application types Email, VoIP, FTP and video
Email, VoIP, FTP and video
Email, VoIP, FTP and video
Fig. 1.12 OPNET 5G project
1.5.1
OPNET 5G Model Description
In OPNET simulation there is a scenario for LTE-A project editor with some of the most important entities of the simulation model. Whereas, the node’s model of the DeNB and RNs implementation has been modified to 5G mobile network requirements, such as a number of antennas, edge cloud, small cells and high level of bandwidth as Fig.1.12 depictsthat more description of these entities is given below:
• Applications: Different applications such as VoIP, video, FTP and email are defined and configured in the applications.
• Profile: Various traffic models are defined in profiles. Moreover, the other operating parameters such as simulation length, start time, etc. are also defined in profiles to support applications requirement.
• Mobility: Mobility models of various users are defined. Moreover, channel conditions such as pathloss, fading, etc. are also defined in mobility.
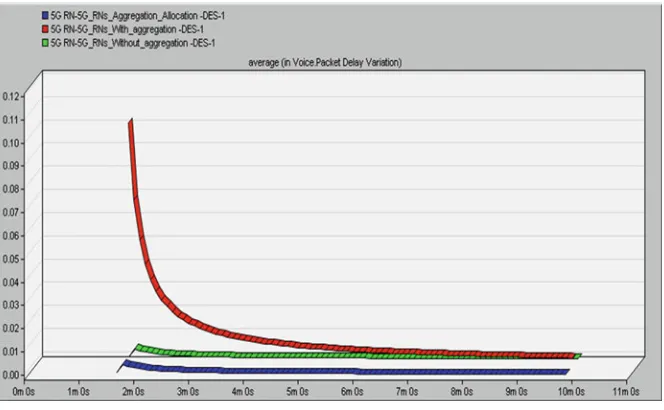
Fig. 1.13 VoIP average packets delay variation (s)
• IP Cloud:In form of edge clouds routes user data packets between eNBs, RNs and servers. It also serves as a peer-to-peer connector between transport network and servers.
• Ethernet connectors (E1, E2, E3 and E4):Are connectors in the linked network. • eNB:eNB models the functionalities of eNB in E-UTRAN.
• UE:UEs represents different users in with various applications.
1.5.2
Experimental Results
The average air interface packet for VoIP users are shown in Fig. 1.13. The results display that the VoIP users have the diverse packets delay variation in all three scenarios even when allocated together with GBR bearers. The cause is the proportional varieties distinguishing of priority, which is characterized by RAS algorithm in “Sc1”. Meanwhile, the VoIP bearer has a relatively low level of packets delay accrued data rate; it tends to get higher priority feature and will permanently be scheduled first.
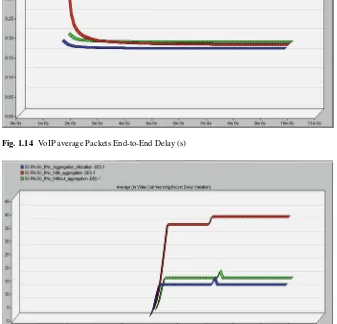
The VoIP average end-to-end delay is shown in Fig.1.14. It can be seen that “Sc1” and “Sc3” scenarios have somewhat better end-to-end delay compared to “Sc2” scenario; this is because of the fact that the “Sc1” allocate the VoIP bearers to a higher MAC QoS class by allocating this PRBs to VoIP users in this scenario.
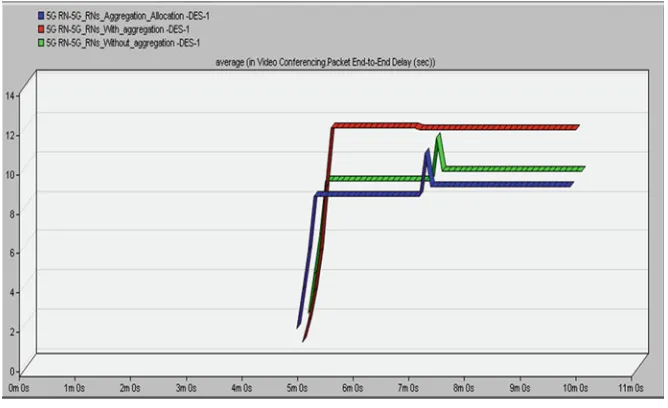
Fig. 1.14 VoIP average Packets End-to-End Delay (s)
Fig. 1.15 Video average packets delay variation (s)
into the GBR MAC classes. In the “Sc3” the video bearers share the same non-GBR MAC QoS class with email, FTP and VoIP bearers since the accumulated data rate of the video. Bearers are expressively high (∼350 kbps); they do not become served all the time.
Fig. 1.16 Video average packets end-to-end delay (s)
Fig. 1.17 Email average download response time (s)
Fig. 1.18 FTP average download response time (s)
Lastly, the FTP bearer results are seen in Fig. 1.18. As already predictable, the FTP bearer performance is decreased when going from fully mixed scenario “Sc3” to fully separate one “Sc1,” where the average file download time becomes improved. This is due to the FTP bearer that is allocated to the lowest MAC QoS class and is supported with low priority as compared to the other applications. However, offering the FTP bearer lower priority is realistic since FTP is not the real-time application and in real life, the FTP users are acceptable to wait a couple of more seconds for their files to be downloaded, while the same cannot be accepted when it comes to real-time applications such as video or VoIP.
1.6
Conclusion
In the implementation, the RNs and 5G cells used to aggregate PRBs and allocate these radio resources in different priorities in form of slicing for smart devices. That has enhanced the performance in terms of cell throughput and E2E delay of 5G data traffic for different scenarios. Further, this research proposed three scenarios for classifying and measuring QoS requirement, based on priority differentiation of the diverse smart system QoS requirements such as smart traffic monitoring, smart healthcare system and smartphones.
In future works, we will reveal more results and analysis of the proposed data traffic slicing model in different data traffic scenarios such as sensitive, popular and heavy traffics and in diverse classes which include FTP, VoIP and video users. The proposed models can be offered as opportunities for the future researchers in terms of resolving data traffic explosion and fairness of services area.
References
1. Andrews, J. G., Buzzi, S., Choi, W., Hanly, S. V., Lozano, A., Soong, A. C. K., & Zhang, J. C. (2014). What Will 5G Be?IEEE Journal on Selected Areas in Communications, 32(6), 1065–1082.
2. Chen, M., Wan, J., & Li, F. (2012). Machine-to-machine communications: Architectures, standards, and applications. KSII Transactions on Internet and Information Systems, 6(2), 480–497.
3. Chen, K. C., & Lien, S. Y. (2014). Machine-to-machine communications: Technologies and challenges.Ad Hoc Networks, 18, 3–23.
4. Einsiedler, H. J., Gavras, A., Sellstedt, P., Aguiar, R., Trivisonno, R., & Lavaux, D. (2015). System design for 5G converged networks. In2015 European Conference on Networks and Communications, EuCNC 2015(pp. 391–396). Piscataway: IEEE.
5. Panwar, N., Sharma, S., & Singh, A. K. (2016). A survey on 5G: The next generation of mobile communication.Physics Communication, 18, 64–84.
6. Dighriri, M., Lee, G. M., Baker, T., & Moores, L. J. (2015). Measuring and classification of smart systems data traffic over 5G mobile networks. In B. Akhgar, M. Dastbaz, & H. Arabnia (Eds.),Technology for smart futures. Cham: Springer.
7. Zaki, Y., Zhao, L., Goerg, C., & Timm-Giel, A. LTE wireless virtualization and spectrum management. In2010 3rd Joint IFIP Wireless and Mobile Networking Conference, WMNC 2010(p. 2010). Piscataway: IEEE.
8. Liang, C., Yu, F. R., & Zhang, X. (2015). Information-centric network function virtualization over 5g mobile wireless networks.IEEE Network, 29(3), 68–74.
9. Zhu, K., & Hossain, E. (2016). Virtualization of 5G cellular networks as a hierarchical combinatorial auction.IEEE Transactions on Mobile Computing, 15(10), 2640–2654. 10. Costa-Perez, X., Swetina, J., Mahindra, R., & Rangarajan, S. (2013). Radio access network
virtualization for future mobile carrier networks. IEEE Communications Magazine, 51(7), 27–35.
11. Rahman, M. M., Despins, C., & Affes, S. HetNet Cloud: Leveraging SDN & cloud computing for wireless access virtualization. In 2015 IEEE International Conference on Ubiquitous Wireless Broadband, ICUWB 2015(p. 2015). Piscataway: IEEE.
13. Lee, Y. L., Chuah, T. C., Loo, J., & Vinel, A. (2014). Recent advances in radio resource management for heterogeneous LTE/LTE-A networks. IEEE Communication Surveys and Tutorials, 16(4), 2142–2180.
14. Abdalla, I., & Venkatesan, S. Remote subscription management of M2M terminals in 4G cellular wireless networks. InProceedings – Conference on Local Computer Networks, LCN, 2012(pp. 877–885). Piscataway: IEEE.
15. Niyato, D., Hossain, E., Kim, D. I. K. D. I., & Han, Z. H. Z. (2009). Relay-centric radio resource management and network planning in IEEE 802.16 j mobile multihop relay networks. IEEE Transactions Wireless Communications, 8(12), 6115–6125.
16. Sui, Y., Vihriala, J., Papadogiannis, A., Sternad, M., Yang, W., & Svensson, T. (2013). Moving cells: A promising solution to boost performance for vehicular users.IEEE Communications Magazine, 51(6), 62–68.
17. Annunziato, A. (2015). 5G vision: NGMN – 5G initiative. IEEE Vehicular Technology Conference,2015, (pp. 1–5). Boston; IEEE.
18. Iwamura, M. (2015). NGMN view on 5G architecture.IEEE Vehicular Technology Conference, 2015, (pp. 1–5). Boston; IEEE.
19. Alfoudi, A. S. D., Lee, G. M., & Dighriri, M. (2017). Seamless LTE-WiFi architecture for offloading the overloaded LTE with efficient UE authentication. InProceedings – 2016 9th International Conference on Developments in eSystems Engineering, DeSE 2016(pp. 118– 122). Piscataway: IEEE.
20. Kalil, M., Shami, A., & Ye, Y. (2014). Wireless resources virtualization in LTE systems. In Proceedings – IEEE INFOCOM(pp. 363–368). Piscataway: IEEE.
21. Muppala, S., Chen, G., & Zhou, X. (2014). Multi-tier service differentiation by coordinated learning-based resource provisioning and admission control. Journal of Parallel and Dis-tributed Computing, 74(5), 2351–2364.
22. Hasan, M., Hossain, E., & Kim, D. I. (2014). Resource allocation under channel uncertainties for relay-aided device-to-device communication underlaying LTE-A cellular networks.IEEE Transactions on Wireless Communications, 13(4), 2322–2338.
23. Abu-Ali, N., Taha, A. E. M., Salah, M., & Hassanein, H. (2014). Uplink scheduling in LTE and LTE-advanced: Tutorial, survey and evaluation framework.IEEE Communication Surveys and Tutorials, 16(3), 1239–1265.
24. Zirong, G., & Huaxin, Z. (2009). Simulation and analysis of weighted fair queueing algorithms in OPNET. In Proceedings – 2009 International Conference on Computer Modeling and Simulation, ICCMS 2009(pp. 114–118). Piscataway: IEEE.
25. Zhu, K. & Hossain, E., 2016. Virtualization of 5G cellular networks as a hierarchical combi-natorial auction.IEEE Transactions on Mobile Computing, 15(10), 2640–2654. Available at:
Challenges and Opportunities of Using
Big Data for Assessing Flood Risks
Ahmed Afif Monrat, Raihan Ul Islam, Mohammad Shahadat Hossain, and Karl Andersson
2.1
Introduction
We never feel safe when calamity strikes, starting from the decimation of Hurricanes Katrina and Sandy to the Pacific earthquake, which moved from the main island of Japan, affected severely an atomic power plant in 2011 [1]. Hence, the devastation of both natural and human-caused disasters can appear to be both limitless and eccentric. Continuously, geological, hydrological, biological, and climatic variables are causing natural disasters resulting in catastrophic events that have disastrous consequences on environments and human social orders. Hazards can be categorized as geophysical and biological. Examples of geophysical hazards are earthquake and cyclone, while infestation and epidemic are the examples of biological hazards [2] (Fig.2.1).
Among these various natural calamities, flood is considered one of the most catastrophic natural hazards, because its severity is very difficult to measure as different known and uncertain attributes are associated with it. Flood is not only responsible for the loss of human lives, but it also causes damage to the properties such as electric power transmission/generation lines, roads, transports, and crops. It is also responsible for severe water contamination and health hazards. Therefore, the assessment of the risk of flooding before its occurrence is crucial. This allows precautionary measures to be taken by warning the people living in the
flood-A. flood-A. Monrat · R. U. Islam · K. Andersson ()
Department of Computer Science, Electrical and Space Engineering, Luleå University of Technology, Skellefteå, Sweden
e-mail:[email protected]
M. S. Hossain
Department of Computer Science and Engineering, University of Chittagong, Chittagong, Bangladesh
© Springer International Publishing AG, part of Springer Nature 2018 M. M. Alani et al. (eds.),Applications of Big Data Analytics,
https://doi.org/10.1007/978-3-319-76472-6_2
Fig. 2.1 Flood-affected area of Chittagong, Bangladesh in 2017. (Source: http:// bangladeshchronicle.net/2017/06/ctg-people-suffer-for-mora-fallout[3])
prone areas. Eventually, the people can be prepared themselves in advance to tackle the risk of flooding in an area. In this context, Big Data could play an important role in supporting the assessment of flood risks due to its capability to visualize, analyze, and predict the risks effectively. Its analytical methods are so robust that it can handle extremely large data chunks and is capable of processing complex mathematical computation to reveal patterns, trends, and associations in order to extract the values from the dataset to facilitate assessment or prediction more accurately [4]. Therefore, this book chapter presents the challenges and opportunities of Big Data in assessing the risk of flooding. This will be delineated by taking account of proposed system architecture as well as in the light of the existing research works on flood risk assessment.
2.2
Impact of Flood as a Natural Disaster
Fig. 2.2 Flood fatality statistics in the USA by the US Natural Hazard Statistics
the aftereffect can create health hazards and water contamination [7]. In the most recent decade of the twentieth century, flood is responsible for killing more than 100,000 people and influenced almost 1.4 billion individuals around the globe [9]. It is assessed that the yearly cost to the world economy because of flooding is around 50–60 billion US dollars [10]. As per an examination by the United Nations (UN), approximately 22,800 lives are affected significantly by flood in a year and caused an estimated damage of US$ 136 billion to the Asian economy [10]. The damages suffered by the developing nations are five times higher per unit of GDP than those of developed nations [10]. More than 1200 people have died across India, Bangladesh, and Nepal and shut 1.8 million children out of school as a result of flooding in 2017 according to the reports of the guardian [11]. It is not possible to avoid flood risk entirely. However, different measures can be taken to prevent and mitigate the loss of flood; structural measures such as building dams or river dikes as well as nonstructural measures like flood forecasting, dissemination of flood warning, public participation, awareness, and institutional arrangement should be taken [8]. In order to reduce the damage due to flood, it is mandatory to monitor and evaluate the factors concerning floods to implement a system that can assess the risk of flood with highest accuracy. All sorts of information regarding floods such as weather forecasting, relevant data generating from different sensors, regional risk factors, and twitter feeds need to be taken into consideration for generating better risk assessment (Fig.2.2).
2.3
Big Data for Flood Risk Management
environment for them, regardless of the gravity of this disaster. Therefore, Big Data has so much to promise in disaster management that is associated with flood. Big Data can deal with enormous volume of data which are coming from different sources in various formats [13]. Unlike traditional data processing approach, Big Data has the computing resources to process large and complex data in order to make better decision and provide valuable insight by assessing the patterns, trends, and association of data. All sorts of business organizations are using Big Data to improve their strategies and operations for discovering patterns and market trends to increase revenues, for instance, e-commerce service providers like Amazon or Alibaba are using Big Data analytics platform to monitor and study the behavior pattern of their consumers to find out new opportunities for customer satisfaction which ended up bringing more revenues for the company. Similarly, crisis response teams from different countries have turned their interest on Big Data in order to use its potential to come up with better prediction model for disaster like earthquakes, wildfires, storms, or floods [14]. The reason behind that is data are coming from different sources such as human, organizations, and machines while dealing with a natural disaster. By evaluating the data coming from social medias (Facebook or Twitter), sensors, satellite image, and disaster management organizations through API, many crises can be predicted before they occur which will give adequate time for evacuation of people and other crucial preparations. Moreover, Big Data is known for making unorganized sets of information into something comprehensive and meaningful. During a disaster, it becomes the most challenging task for the emergency response team to take appropriate measures within quick successions based on the inaccurate and incomplete information coming from various sources. For an example, crisis management team was struggling to reach people who needed help immediately during 2011 when Japan was struck by earthquake and tsunami [15]. Precisely under this kind of circumstances, Big Data can offer all sorts of aids for managing the disaster well.
2.3.1
How Can Big Data Help?
response accordingly. To improve the agricultural interventions in developing nations, different sensors can be used in the field to reveal the quality of air and soil. By raising awareness among citizens, Big Data helps to build strong communities that can manage their natural system, strengthen infrastructure, and take effective decisions for a better future.
2.4
Opportunities of Big Data in Flood Risk Assessment
This segment will explain the scope of Big Data, which can bring new opportunities to improve the way flood risk managements are planned and executed. With Big Data, records of previous flood incidents such as fatality, the amount of damaged properties, rainfall during that period, infrastructures of the areas including coastal areas as well as cities, and drainage system can be analyzed properly [18]. It can also pick out the specific mobility support or resources that are needed by the inhabitants of a flood-affected area. Hence, identifying population hotspot gets easier with Big Data in order to provide real-time alarm and warnings to the residents when a disaster approaches (Fig.2.3).
It helps to study future reactions of the people who are living in a specific zone and suffered tremendously by flood [19]. By using geographical image mapping technique, it is possible to map the risk zones in real time of a city or area, and viewers can observe the assessment through web services [20]. For instance, data scientist can extract detail information from local mobile network companies about how people reacted and responded to an emergency situation like flood. Moreover, Big Data makes a sort of spatial information framework in order to build the foundation which will make policies, protocols, and the trade of information as an ongoing priority. Such sharing of information makes new best-case situations to help both responders and survivors.
2.5
Challenges of Predicting Flood Risks
Despite of getting very promising results, Big Data needs to deal with some barriers, uncertainties, and risks associated with the assessment because of human and organizational capacity gaps along with the lack of access to internet and IT infrastructure especially in the developing countries. While implementing and scaling new approaches, Big Data is open to new risks due to specific technological, political, and economical obstacles [21]. For instance, the privacy and security of cell phone’s data can be hampered by factors ranging from the large chunks of datasets due to uncertainty issues. Another example can be the analyses of social media data that works fine in developed countries; however, it may not be reliable in developing countries due to much thinner and more skewed base users. While leveraging Big Data to build resilience in complex and volatile environments, it is needed to be mindful about some factors such as constraints on data access and completeness; analytical challenges to actionability and replicability, for example, finding out the approaches to mitigate verification technique and sample bias correction methods; human and technology capacity gaps; and ethical and political risks [22]. Moreover, Big Data needs to comply with its major four Vs, that is, volume, velocity, variety, and veracity, as large amount of data needs to be processed that is coming from different sources in various formats with a high rate which can be unreliable and associated with lots of uncertainties [23]. During flood risk assessment, Big Data has to deal with various constraints in different phases like data acquisition, information extraction, data integration and analysis, data life cycle management, crowdsourcing, and disaster response recovery [24].
2.6
System Architecture Implementing Big Data
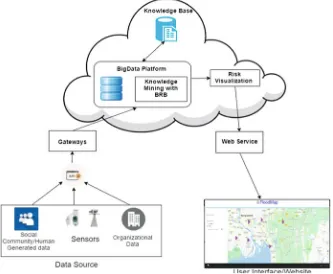
We can consider the system architecture in Fig. 2.4 to assess flood risk using Big Data. The system has three major parts: a data source, a Hadoop/Spark distributed server, and a web interface. The data source will provide data to the server which will perform computation regarding flood risks by using Big Data analytics platform, such as Apache Hadoop or Apache Spark, with a machine-learning approach called belief rule base (BRB), and finally through a web service, it will visualize the risk in a user interface.
Fig. 2.4 System architecture
nodes. Then these data will be analyzed using BRB inference engine to get rid of the uncertainties associated with the data as well as to produce the risk assessment. The users can view the final assessment in a website for specific region. In addition, clients can also monitor the factors like water level, rainfall, and moisture of soil. The system will produce real-time assessment by computing stream of data coming from different sources. Therefore, crisis management teams, authorities, and people will be able to take proper precautions before flood occurs.
2.6.1
Framework of the Assessment Model
A large number of predictive models are available for early prediction, real-time forecast of rainfall and water level in river stage, and flood risk assessment [25, 31]. Apparently, most of those models applied artificial neural network, support vector machine, dynamic Bayesian network, or a hybrid of these techniques. However, assessing flood risks or any kind of disaster before it occurs is quite complex and unreliable. Usually, expert systems are considered as suitable to handle problems of this nature rather than algorithmic approach. Expert systems have two major components: the knowledge base and inference engine. Knowledge base has the ability to solve a problem providing its underlying set of facts, rules, and assumptions, whereas inference engine helps the knowledge base to extract new information applying logical rules. Knowledge base can be constructed by using proportional logic (PL), first-order logic (FOL), or fuzzy logic (FL), yet these are not well equipped to capture uncertainty like ignorance, incompleteness, vagueness, and ambiguity with certain assurance [26].
Therefore, a recently developed belief rule-based inference methodology using the evidential reasoning (RIMER) approach is considered to develop the system architecture [27]. This methodology can address all sorts of uncertainties. The knowledge base is constructed with belief rule-based expert system (BRBES), while evidential reasoning (ER) works as an inference mechanism in this methodology [28]. Here, a rule base is constructed with belief degrees associated in all the possible consequences of a rule. The inference is implemented using the evidential reasoning approach that can handle different types and degrees of uncertainty associated with the flood risk assessment factors. Moreover, it is quite efficient to process large stream of sampled data that are coming from Hadoop distributed file system (Fig.2.5).