Journal of Life Sciences
Volume 8, Number 6, June 2014 (Serial Number 74)
David Publishing Company www.davidpublishing.com
Publication Information
Journal of Life Sciences is published monthly in hard copy (ISSN 1934-7391) and online (ISSN 1934-7405) by David Publishing Company located at 240 Nagle Avenue #15C, New York, NY 10034, USA.
Aims and Scope
Journal of Life Sciences, a monthly professional academic journal, covers all sorts of researches on molecular biology, microbiology, botany, zoology, genetics, bioengineering, ecology, cytology, biochemistry, and biophysics, as well as other issues related to life sciences.
Editorial Board Members
Dr. Stefan Hershberger (USA), Dr. Suiyun Chen (China), Prof. Dr. Fadel Djamel (Algeria), Dr. Francisco Torrens (Spain), Dr. Filipa João (Portugal), Dr. Masahiro Yoshida (Japan), Dr. Reyhan Erdogan (Turkey), Dr. Grzegorz Żurek (Poland), Dr. Ali Izadpanah (Canada), Dr. Barbara Wiewióra (Poland), Dr. Amanda de Moraes Narcizo (Brasil), Dr. Marinus Frederik Willem te Pas (The Netherlands), Dr. Anthony Luke Byrne (Australia), Dr. Xingjun Li (China), Dr. Stefania Staibano (Italy), Prof. Dr. Ismail Salih Kakey (Iraq), Hamed Khalilvandi-Behroozyar (Iran).
Manuscripts and correspondence are invited for publication. You can submit your papers via Web Submission, or E-mail to [email protected] or [email protected]. Submission guidelines and Web Submission system are available online at http://www.davidpublishing.com.
Editorial Office
240 Nagle Avenue #15C, New York, NY 10034, USA
Tel: 1-323-9847526, 1-302-5977046; Fax: 1-323-9847374, 1-323-9080457 E-mail: [email protected], [email protected]
Copyright©2014 by David Publishing Company and individual contributors. All rights reserved. David Publishing Company holds the exclusive copyright of all the contents of this journal. In accordance with the international convention, no part of this journal may be reproduced or transmitted by any media or publishing organs (including various websites) without the written permission of the copyright holder. Otherwise, any conduct would be considered as the violation of the copyright. The contents of this journal are available for any citation. However, all the citations should be clearly indicated with the title of this journal, serial number and the name of the author.
Abstracted / Indexed in
Database of EBSCO, Massachusetts, USA Chemical Abstracts Service (CAS), USA
Database of Cambridge Science Abstracts (CSA), USA Database of Hein Online, New York, USA
Ulrich’s Periodicals Directory, USA Universe Digital Library S/B, Proquest
Chinese Database of CEPS, American Federal Computer Library center (OCLC), USA China National Knowledge Infrastructure, CNKI, China
Chinese Scientific Journals Database, VIP Corporation, Chongqing, China Index Copernicus, Index Copernicus International S.A., Poland
Google Scholar (scholar.google.com)
Subscription Information
Price (per year): Print $420, Online $300, Print and Online $560.
David Publishing Company
240 Nagle Avenue #15C, New York, NY 10034, USA
Tel: 1-323-9847526, 1-302-5977046; Fax: 1-323-9847374, 1-323-9080457 E-mail: [email protected]
David Publishing Company www.davidpublishing.com
DAV ID P UBL ISH IN G
J LS
Journal of Life Sciences
Volume 8, Number 6, June 2014 (Serial Number 74)
Contents
Physiology and Biochemistry
481 The Changes of Water Quality in Space and Time in the Mekong River, Bassac River and
Adjacent Waterways
Luu Duc Dien, Ma Tu Lan and Nguyen Dinh Hung
489 Analysis Method for Pesticide Residues in Biological Matrices: Gas Chromatography-mass
Spectrometry
François Xavier Nshimiyimana, Abdellah El Abidi, Mohamed Fekhaoui, Bouchaib Benbakhta, Nezha
Barakate, Hind Hami and Abdelmajid Soulaymani
496 Contribution to the Bio-ecological Study of Date Palm Entomofauna in the Region of Saoura
(South Algeria)
Ali Boulanouar, Mohammed Anouar Khelil, Ahmed Makhlouf and Larbi Benlarbi
504 Applying Natural Fertiliers to Herbaceous Crops
Disciglio G., Frabboni L., Tarantino A. and Tarantino E.
Botany and Zoology
511 Propagation of Grevillea banksii Affects the Dynamic of Mycorrhizal Fungi Communities
Associated with Native Tree Species of Madagascar
Martial Doret Andrianandrasana, Rondro Harinisainana Baohanta, Herizo Randriambanona, Marson Raherimandimby, Damase Khasa, Robin Duponnois and Heriniaina Ramanankierana
517 Pheomelanin Formation and Low Tyrosinase Activity in Fading Body Color Variant BdlR Strain
Oryzias latipes
Nobuhiko Asada, Aoi Kedamori, Yumiko Kusano and Tetsuro Takeuchi
522 Time Course of Changes in Trabecular Bone Microstructure in Rats with Spinal Cord Injury
Mohamed Shokry, El-Sayed Berbish and Iman Shaheed
Interdisciplinary Researches
533 Perception of Agricultural Science /Home Economics as a Career among Senior Secondary School
Students in Abia State, Nigeria
Nathaniel Chika Ezebuiro, Kenneth Chikwado Ekwe, Ekwuruchi Ogbonna Mbanaso, Flora Ngozi
Nwakor, Godwin Ndubuisi Asumugha and Justin Enyinnaya Ewuziem
544 Flavonoïds from Euphorbia guyoniana Boissier & Reuter
Ouanissa Smara, Audrey Julia, Cécile Moral-Salmi, Claire Vigor, Joseph Vercauteren and Belgacem Legseir
552 Induced Immunity of Response to Some Allergens Towards Response of Other Skin Test Allergens
and Its Correlation with Immediate Hypersensitivity Reactions
Younus Jasim Abdullah
558 Granulomatous Inflammatory Reaction in Breast Silicone Implants
Journal of Life Sciences, ISSN 1934-7391, USA
The Changes of Water Quality in Space and Time in the
Mekong River, Bassac River and Adjacent Waterways
Luu Duc Dien, Ma Tu Lan and Nguyen Dinh Hung
Research Institute for Aquaculture No. 2, 116 Nguyen Dinh Chieu Street, District 1, Hochiminh City 70000, Vietnam
Received: February 18, 2014 / Accepted: June 18, 2014 / Published: June 30, 2014.
Abstract: Catfish (Pangasianodon hypophthalmus) farming along Mekong river and Bassac river depends heavily on water quality of the two rivers, whereas water quality of these rivers are affected by the waste of aquaculture activities, agricultural production, industrial and municipal waste. This report analyzes the monitoring data on Mekong river, Bassac river and adjacent waterways in the period of 2011-2012, focusing on parameters of organic pollution to assess the current quality of these two rivers. Based on the results, the water quality in the river-head was generally better than in the middle and at the end of the river, and the quality of water of the Mekong river was better than Bassac river. In terms of time, water quality in July was considered the best in all the basins. At adjacent natural rivers and canals, ammonia levels increased and exceeded the Vietnamese standard in April, and BOD values were also much higher compared to two major rivers. The results of the model also showed that the levels of pollution index of the Mekong and Bassac river were very low (1.33 and 1.47), and the values (Y) in the canals were higher (1.63-1.67) but still in permitted level. Therefore, the water quality of the Mekong and Bassac river in the period 2011-2012 was generally still quite good.
Key words: Bassac river, catfish, Mekong river, model, water quality.
1. Introduction
Catfish has been the object of intensive farming in freshwater fish ponds mainly in the Mekong Delta with an annual output of 1 million ton, bringing exports from 1.4-1.6 billion USD [1]. The most concerned issue of farmers and local governments has been the water quality in the rivers and canals in the region [2]. Water quality is also affected by upstream water quality, discharge of living and other economic activities in this area. Therefore, the current trend of rapid development, the strength of the economic sectors, in the near future, if the effluent monitoring and management of environmental impacts are not conducted properly, pollution will be unavoidable. Following this, the reverse of its impact on people’s production and life could cause the damage.
The paper focused on the analysis of survey data,
Corresponding author: Luu Duc Dien, research field: environmental engineering. E-mail: [email protected].
observation of two lines of Mekong and Bassac river and neighboring canals in the period of one year, based on water quality criteria, especially parameters indicated pollution (BOD, phosphate, nitrate, ammonia, coliform...) to assess the status of water quality on the Mekong and Bassac river in the context of fish farming developing. The results of this study were the scientific basis for assessing the current state of the environment and predict changes in the future and helping managers to find appropriate solutions for sustainable catfish planning for provinces along the Mekong and Bassac river.
2. Materials and Methods
2.1 Time and Place of Sampling and Analysis Criteria
Survey time: from April 2011 to January 2012, made four 3-month frequencies survey/time.
Sampling location: taking water samples in 40 points (30 points on the main line and 10 measurement points in the channel/main rivers
D
flowing into the Mekong and Bassac river). Each tributaries and the canal/ditch into the Mekong and Bassac river were divided into five areas from upstream to downstream (Table 1).
Analysis: 16 parameters [Salinity, temperature, pH, dissolved oxygen (DO), total suspended solids (TSS), biochemical oxygen demand (BOD), chlorophyll a, ammonia (N-NH4), nitrate (N-NO3), total nitrogen
(TN), total phosphorus (TP), phosphate (P-PO4),
chloride, coliform, total iron, aluminum metal] in the cross section and over time.
Water samples were collected by using bathometer, 0.5-1.0 m water deep. Water samples were then fixed and stored following standard procedures and transported to the laboratory to be analyzed less than 24 h from the time of sample collection [3].
2.2 Methods of Assessing the Current State of the Water Environment
Although 16 water quality parameters were analyzed, only the typical indicators selected for inclusion in the
assessment model in this report. Specifically, the model was applied to 10 parameters having limited value, including chloride, pH, TSS, total iron, DO, BOD, nitrate, phosphate, ammonia and coliform.
With the overall objective assessment of water quality monitoring parameters, methods of ecological risk assessment was applied to calculate. Overall water quality was calculated according to the formula:
Y = Wi * Xi [4-7]. Where, Y was the level of water
pollution index, Xi was the level of water pollution
monitoring parameters i, and Wi was the ratio of the
number of observation i.
Determine the level of water pollution (X): The limit values monitoring of the parameters used in this paper were referenced at Vietnamese standard 08:2008/MNRE (column A2). To calculate the level of water pollution (X), the value of monitoring
parameter at 75% of the limit value, then X had a
value of 1; from 75%-100% of the limit value of X
was 2; limit value, the value of X equaled to 3
(Table 2).
Table 1 Water quality assessment partition by region.
Area Mekong river Symbol Bassac river Symbol
1. Upstream River: ST1, ST2, ST3, ST4 Canal: KST1 ST_V1 KST1 River : SH1, SH2, SH3 Canal: KSH1 SH_V1 KSH1 3. Middle of the river River: ST9, ST10, ST11
Canal: KST3 4. Lower part of the river River: ST12, ST13
Canal: KST4 5. Downstream River: ST14, ST15
Canal: KST5 Table 2 The value of monitoring parameters and indicators of water pollution X.
No. Parameter Unit Limit values Freshwater fish
Table 3 The group parameters, and the weight W of each monitoring parameter.
No. Parameter Parameter’s group weight coefficient W
1 chloride Normal and iron alum 1 1/17
2 TSS Normal and iron alum 1 1/17
3 pH Normal and iron alum 1 1/17
4 Total iron Normal and iron alum 1 1/17
5 DO Pollution 2 2/17
6 BOD Pollution 2 2/17
7 N-NO3 Pollution 2 2/17
8 P-PO4 Pollution 2 2/17
9 Coliform Pollution 2 2/17
10 N-NH4 Highly toxic organic pollution 3 3/17
Sum 17 17/17
Table 4 Overall assessment of water based on the index value Y.
No. The level of water pollution index Y Overall assessment of water quality
1 1 < Y 1 + 2/3 No signs of pollution
2 1 + 2/3 < Y 1 + 4/3 Signs of pollution
3 1 + 4/3 < Y 3 Pollution alert
Determination of W for each monitoring parameter: estimated by the method of grouping parameters based on the criterion of the influence of groups of environmental parameters in aquaculture. The report defined the influence of each parameter into three levels of impact parameter corresponding to the three groups [8-10]. Table 3 showed the correlation between the parameter’s group and the weight W of each monitoring parameter.
Assess the level of water pollution index (Y): Y is continuous range of values from 1.00-3.00. The overall assessment of water quality at each location as well as the whole river was correlated with three about the value of Y (Table 4).
3. Results and Discussion
3.1 Assessing the Current Water Quality of Mekong and Bassac River
3.1.1 According to space
3.1.1.1 Mekong and Bassac river
The pH values of both basins properly ranged from 7.1 to 7.4 and relatively stable from upstream to downstream, as these are the two largest main freshwater rivers of the Mekong Delta, flow was high,
pH between basins changed insignificantly. BOD concentrations ranged appropriately from 3.6 to 4.6 mg/L on the Mekong and Bassac river, respectively, proportion to the DO values in the suitable range of 4.89-6.51 mg/L.
Results also showed that P-PO4 and N-NO3 levels in water were quite low, in the respectively range of 0.03-0.14 mg/L and 0.17-0.42 mg/L. This result was relatively equivalent to the water quality during 2005-2010 [10]. Although concentrations of N-NO3 were low, most TN values were higher than 4.0 mg/L. Based on some international standards (such as American standard: TN < 0.9 mg/L, Chinese standard: TN < 0.5-1.0 mg/L for freshwater fish farming), the TN content in the water were almost in excess of regulations for aquatic conservation purposes and potentially cause eutrophication [11].
The ratio of TN/TP in the Mekong and Bassac river in each survey area (Fig. 1) in the range of considerably narrows from 5.1 to 7.3 (Bassac) and 5.2-6.2 (Mekong). In general, the limiting factor eutrophication depended on space and time, in which the majority of P was the limiting factor.
The ratio of TN/TP in the Mekong and Bassac river
4.0
river was not so high (32-86 MPN/mL) while in the Bassac river the coliform levels were recorded (194-756 MPN/mL) exceeding many times compared to the permitted level (< 50 MPN/mL) in all basins. The high coliform density can be attributed to the concentration of boats, the poultry farming and grazing activities, the strong development of aquaculture activities, crowded residential areas, markets...
3.1.1.2 In the channel/adjacent canal linking to the Mekong and Bassac river
Total nitrogen and total phosphorus content on the channel/canal were as the same rate as in the main two lines (TN: 2.97-5.34 mg/L; TP: 0.24-1.47 mg/L). In terms of the ratio TN/TP in the Bassac river channel points, both N and P were limiting factors, whereas phosphorus was more dominant the limiting factor in the Mekong river channel points.
In the canal, level of microbial contamination was quite high because the presence of high coliform was several times higher than the permissible limits. In addition, total coliform of Bassac’s channels was higher than that in Mekong’s channels. For example, in KSH1 (Thanh My Tay An Giang), KSH4 (Nhon Nghia_Can Tho) levels of pollution were 20 times higher than the limits of Vietnamese standard. Meanwhile the highest pollution level in the Mekong channel was just 6 times higher than Vietnamese standard (My Duc Dong_Tien Giang). This implied the level of microbial contamination of the Bassac channels was quite alarming.
3.1.2 According to time
3.1.2.1 Mekong and Bassac river
pH values on the Mekong river were in the range of 7.0 to 7.5, and these were broader range 6.9-7.7 in the Bassac river. BOD contents of the Mekong and Bassac river fluctuated below 5.0 mg/L in the beginning months of the year and tended to increase towards the end of the rainy season, reaching the highest point 8.0 mg/L in October (Figs. 2 and 3). Therefore, at the end of the rainy season the amount of water increased due to heavy rain in September-October, and the pouring of water from upstream carried more silt, sediment creating a flow that contains many impurities and suitable for the development of microbial pathogens, resulted in the increasing of BOD.
BOD changes in the Bassac river
0.0
SH_V1 SH_V2 SH_V3 SH_V4 SH_V5
Fig. 2 The changes of BOD in the Bassac river based on time.
BOD changes in Mekong river
0.0
ST_V1 ST_V2 ST_V3 ST_V4 ST_V5
In contrast to the evolution of BOD, the variety of ammonia in the Mekong and Bassac river depended on each region and time. However, the concentration of ammonia in both rivers was maintained at lower levels as opposed to the limit of Vietnamese standard. In the upstream of the Bassac river flow, ammonia levels were high in April and gradually decreased to less than 0.02 mg/L in July, while the water downstream of the Bassac river tended to rise at the end of year (0.06 mg/L). In the Mekong river, highest ammonia fluctuated in January in the region between ending areas (ST_V4) and decreased in July.
Results recorded coliform density in Mekong river has much lower than that in Bassac river. The presence of total coliform in Mekong river was less variable in terms of time on the whole river, only the average range of 100-120 MPN/mL and the most polluted river downstream of Mekong river was 200 MPN/mL in January (Fig. 4). On the contrary, in the Bassac river, coliform levels fluctuated extremely differently in every phase of the survey. In the rainy season, coliform density of the Bassac river was 10 times higher than that of Mekong river, with the presence in the end source (SH_V5) 2100 MPN/mL in July (Fig. 5).
3.1.2.2 In the channel/adjacent canal linking to the Mekong and Bassac river
The rising of ammonia levels exceeded the threshold in Tan Phu Dong_Dong Thap (KST2) in April with
Change of Coliform in Mekong river
0
ST_V1 ST_V2 ST_V3 ST_V4 ST_V5
Fig. 4 The change of Coliform in Mekong river based on time.
the value of 0.58 mg/L (compared with the permited level of 0.2 mg/L). Moreover, at the end of the dry season average ammonia values were also recorded higher than the rainy season.
High bacteria concentrations recorded at the canals linking to Bassac river with the highest value of 4,600 MPN/mL in January in Thanh My Tay_An Giang (KSH1) and October in Nhon Nghia_Can Tho (KSH4) (Fig. 6), whereas the river flows into wages, the highest value was 1,100 MPN/mL in January in My Duc Dong Tien Giang (KST4) (Fig. 7).
3.2 Model Assessment of Water Pollution
3.2.1 Regarding to space
Water quality in Mekong and Bassac river was pretty good, represented by the value level of water
Change of Coliform in Bassac river
0
SH_V1 SH_V2 SH_V3 SH_V4 SH_V5
Fig. 5 The change of Coliform in Bassac river based on time.
Change of Coliform in canals (Bassac river)
0
KSH1 KSH2 KSH3 KSH4 KSH5
Change of Coliform in canals (Mekong river)
0
KST1 KST2 KST3 KST4 KST5
Fig. 7 The change of Coliform in canals linking to
Mekong river.
pollution index (Y) was very low during the survey period of one year (Fig. 8). In addition, the water quality in Mekong river was better than branches of the Bassac river. In the canal/ditch into the Mekong and Bassac river, the Y values were higher, and some Y values in the basin “signs of pollution” (as KSH1, KSH5; KST2, KST4) but generally indicators of organic pollution were in the appropriate range for freshwater aquaculture.
3.2.2 In tems of time
In Bassac river, source of water was relatively good except for a few basins (SH_V3 and SH_V5) in October, the Y value was 1.71. In Bassac’s channels, except in July, the rest have recognized the value of Y “signs of pollution” in a few areas. Among them, October was considered the highest pollution levels.
In Mekong river, all four time surveys recorded water quality in the Mekong river was very good. In Mekong’s channels, water quality was also quite similar to that in Bassac’s channel: “signs of pollution” in many basins (except in July).
3.3 General Discussions
Most of the water quality parameters in the Mekong and Bassac river such as chloride, pH, ammonia, total iron... were achieved Vietnamese standard 08:2008/MNRE applied to water to protect aquatic life. Although the concentrations of P-PO4 and N-NO3
often observed in low concentrations (< 0.90 mg/L for N-NO3, and < 0.20 mg/L for P-PO4), the value of TN was usually higher than 3.5 mg/L. Therefore, the concentration of TN in the Mekong and Bassac river were at potentially cause eutrophication, especially in the dry season [12]. However, when considering factors limit eutrophication in the Mekong and Bassac river and canals/ditches through the ratio of TN/TP, phosphorus can be seen as the major limiting factor.
BOD parameter in Mekong and Bassac river were almost in the allowed range except for October (recorded in the 8.0 mg/L). Hence, the BOD values of the Mekong and Bassac river reached good quality for aquaculture, but they tended to increase in the region and in the rivers/canals/ditches flowing into the Mekong and Bassac river where aquaculture development such as An Giang, Dong Thap, Can Tho province, especially in the last months of the rainy season. This can be due to the impact of the flood and one direction water flow from upstream, carrying high organic contents. The increasing of BOD and decreasing of DO levels, especially in the canals/ditches showed an increase in organic pollution due to the development of more productive activities (industry, agriculture, aquaculture...) over the year.
Contamination by pathogens (total coliform bacteria) was one of the most concerns about water quality because they can cause intestinal disease to humans and animals. Bacteria pollution often originated from municipal waste, urban and industrial wastes from human and animal waste into the canal/ditch and into the Mekong and Bassac river. Total coliform concentrations in the river exceeded the permitted level many times [6]. It proved that the water in the Bassac river and the channel/canal into the Mekong/Bassac river has been contaminated by coliform bacteria-a potential cause disease for aquatic animals in the basins.
Fig. 8 Water quality map of the areas along the Mekong and Bassac river according to space.
Bassac river was considered even better with Y value 1.40 (only for own Mekong and Bassac river) and 1.52 (including the canals/ditches into the Mekong and Bassac river). This was quite reasonable when the recorded values were lower for indicators: pH, total iron, DO, ammonia... Therefore, there are still many concerns about water pollution problems in Mekong and Bassac river and sometime had also recorded pollutant levels exceeded standard, especially in the channel/canal, but in overview picture water quality of the Mekong and Bassac river was quite good to
facilitate the planning of catfish (Pangasianodon
hypophthalmus) farming areas.
4. Conclusions
Upstream water quality was considered better than that between the source and downstream, and water quality in Mekong river in 2011-2012 was still considered better than the Bassac River. Following
river in the 2011-2012 period was still pretty good.
Acknowledgments
This research was financed by MARD (Ministry of Agriculture and Rural Development, Vietnam).
References
[1] Tung, N. T. 2008. Development planning, Production and consumption of fish in the Mekong Delta in 2010 and 2020 orientation. Scientific report, Research Institute for Aquaculture No. 2.
[2] Trung, N. D. 2004. “Water Quality Management in Aquaculture.” Agricultural Publishing House.
[3] Boyd, C. E., and Tucker, C. S. 1992. Water Quality and Pond Soil Analyses for Aquaculture Alabama: Auburn University.
[4] Smith, D. G. 1990. “A better water quality indexing system for rivers and streams.” Water Resources 24: 1237-1244.
[5] Vuong, D. Q. T., Truc, N. T., Tuan, T. T., Thuy, D. N., Bao, T. N., Tien, D. V., and Phuoc, L. H. 2012.
Construction of parameters, indicators and monitoring processes of the aquaculture environment. Scientific report, Research Institute for Aquaculture No. 2.
[6] Vietnamese standard 08:2008/MNRE. 2008. National technical regulation on surface water quality. The Ministry of Natural Resources and Environment,
Vietnam.
[7] Lang, T. T. 2008. Study to assess water quality index and partition the water quality of Bassac river. Scientific report, University of Natural Resources and Environment of Ho Chi Minh City.
[8] Bao, T. Q., Truc, N. T., Thuy, D. N., Tuan, T. T., Vuong, D.Q.T., Bao, T.N., Dien, L.D., and Phuoc, L.H. 2010.
Monitoring for aquaculture environment and epidemic in some areas of the provinces of the Mekong Delta and the southeast of Vietnam in 2010. Scientific report, Research Institute for Aquaculture No. 2.
[9] Tuan, T. T. 2010. Construction of warning simulator to model the environment and diseases for intensive shrimp and catfish farming. Scientific report, Research Institute for Aquaculture No. 2.
[10] Dien, L. D., Tuan, T. T., and Vuong, D.Q.T. 2012. “Assessment of the current water quality in the Mekong and Bassac river for catfish (Pangasius hypophthalmus)
farming.” Journal of Agriculture and Rural Development
(7): 68-76.
[11] Hop, N. V., Tung, T. Q., Long, T.H., Phong, N.H., Marconi M., Tuan, L.C., Hue, N.V., To, T.C., and Bang, T.H. 2008. Assessment of the quality of water and sediment in Tam Giang-Cau Hai, Integrated project management activities lagoon in Thua Thien Hue province, Vietnam. Scientific report, Hue University. [12] Chapman, D., ed. 1996. Water quality assessments: A
Journal of Life Sciences, ISSN 1934-7391, USA
Analysis Method for Pesticide Residues in Biological
Matrices: Gas Chromatography-mass Spectrometry
François Xavier Nshimiyimana1, Abdellah El Abidi2, Mohamed Fekhaoui3, Bouchaib Benbakhta2, Nezha
Barakate2, Hind Hami1 and Abdelmajid Soulaymani1
1. Genetics and Biometry Laboratory, Faculty of Sciences, University Ibn Tofail, BO. 133 Campus Universitaire, Kénitra 14000, Morocco
2. Hydrology and Toxicology Laboratory, National Institute of Hygiene, 27 Avenue Ibn Battouta, BO 769, Rabat 10000, Morocco 3. Ecotoxicology Laboratory, Scientific Institute of Rabat, Avenue Ibn Batouta, 1014, Rabat 10000, Morocco
Received: April 27, 2014 / Accepted: June 03, 2014 / Published: June 30, 2014.
Abstract: Pesticides have done a great service to human, but their use is not safe for public health. Apart from pesticides acute toxicity, their chronic toxicity can cause various problems for human health. The objective of this work was to validate a liquid-liquid extraction method, which allows a fairly reliable analysis of pesticides using gas chromatography-spectrometry mass (GC/MS) in toxicology laboratory at National Institute of hygiene, Rabat Morocco. The equipment required to perform these analyzes are the biological matrices (blood, gastric fluid), in which the authors have doped the Organophosphorus pesticides such as Chlorpyrifos, Dichlorvos and Organochlorine pesticide: dichlorodiphenyltrichloroethane (DDT) and Heptachlor. After extracting the mixture with toluene, the supernatant was collected after centrifugation and concentrated in a small volume of 1.5 mL and then analyzed in GC/MS. After analyzing, the authors found that the yields of each pesticide in samples are significant; respectively they represented 73.4% of Chlorpyrifos, 70.8% of Dichlorvos, 47.8% of DDT and 71.6% of Heptachlor. The blood has a strong link with the most pesticides, where it’s important to use the GC/MS to identify these products. The extraction with toluene was effective, especially to OP, but it’s also sensitive to OC.
Keys words: Validation methods, organochlorine pesticides, organophosphatus pesticides, health, GC/MS.
1. Introduction
Pesticides are defined as any substance or mixture of substances intended to protect the plants and animals against all king of harmful organisms. In a broad sense, they are intended to destroy, deter and render harmless these organisms [1]. The pesticides are classified in several groups depending on the species to fight (insecticides, herbicides, fungicides, rodenticides to mention only the main groups), or by chemical functions (organochlorines, organophosphates, carbamates, etc.). Pesticides have certainly promoted agricultural resources, but their use is not without danger to public health [2, 3]. Beside their acute
Corresponding author: Abdelmajid Soulaymani, Ph.D., professor, research fields: genetics, biometry and epidemiology. E-mail: [email protected].
toxicities (accidental or suicide), chronic toxicities (long term exposure) may be related to various human health issues such as infertility and cancer etc. [4]. Organochlorine and organophosphorus pesticides in particular are effective agents commonly pulverized to counter pests and both have been mostly applied in agriculture in the world. Due to their high chemical stability and lipid solubility, these groups of pesticides are environmental pollutants. As a consequence, these pesticides are often detected in the food chain exposed to animals and humans, such as in fish, wildlife, adipose tissue and breast milk [5, 6]. The reference method established in this study will allow them to evaluate human exposure to some pesticides.
The objective of this study was to develop a specific and simple method to detect the baseline of a
D
series of organochlorines and organophosphates in biological matrices. The method described here is a simple one requiring minimal preparation of the sample. The method is intended to provide exploratory and confirmatory data, although focused on the analysis blood. The pesticides used have been selected based on their occurrence, persistence, toxicity and human prevalence in biological matrices.
2. Materials and Methods
As pesticides or their residues are not directly assayable in biological matrices, except by few immunochemical methods according to Koivunen et al. [7]. It is necessary to perform the sample pretreatment and pre-concentrate the compounds. This is intended to identify chemical compounds from the complex biological matrix. Therefore, the various procedures have applied such as: solid phase extraction (SPE), solid phase micro extraction (SPME) and liquid-liquid extraction (LLE). The third method was used in their study. This method, they are essentially aimed to simplify and ensure the efficiency of the extraction. The liquid-liquid extraction (LLE) is based on a difference of solubility between the analytes and biological matrices relative to the solvent of extraction. In the case the samples are doped with a series of pesticides. The first step was an erythrocyte lysis and the precipitation of proteins during vortex agitation, was followed by centrifugation of the samples. Toluene was used as extraction reagent. The supernatant was then collected and concentrated in a small volume by evaporation under liquid nitrogen.
Therefore, equipment necessary to perform these analysis in order to highlight the pesticides problems to human health, are the biological matrices such as viscera blood, gastric fluid, urine or hair. The biological matrices (blood and gastric fluid) were used in their study. They were obtained at the Department of Toxicology, National Institute of Hygiene, Rabat, Morocco. Therefore, the authors doped to their samples (blood and gastric fluid), the series of
organophosphorus pesticides standards (chlorpyrifos and dichlorvos) and organochlorine pesticides standards (heptachlor and Dichlorodiphenyltrichloroethane: DDT). Firstly, 2 mL of blood was doped by 1 mL of pesticides (5 ppm each one) and 2 mL of toluen were added. The mixture was slowly vortexed for 2 min, and centrifuged at 5000 rpm for 15 min. The layer recovered of supernatant of each sample doped was evaporated and concentrated in small volume by liquid nitrogen [8].
The organochlorines (OC) are persistent pollutants from the environment, very often dosed simultaneously. Because of their resistance to degradation and their high solubility in organic solvents and lipids, these compounds accumulate in the tissues and biological fluids. They are, as the authors have said earlier responsible for adverse effects on human health [4].
3. GC/MS
The technique used for pesticides is often Gas Chromatography (GC) coupled to mass spectrometry (MS). Methods rather describe the dosage given a family of pesticides. The authors note that such a process is difficult to use, because these chemical compounds have the different physicochemical parameters such as volatility, pKa, thermostability, polarity, solubility in solvents, etc.. This complicates both the extraction and analysis. But there are still many compounds that can’t be analyzed directly by GC because of their low volatility, their high polarity and/or their thermal instability. GC-MS is now a complementary technical to quantify pesticides in the environment and in biological matrices [9].
4. Extraction
The analysis of samples transferred into the vials were carried out by gas chromatography (GC-QP2010
Shimadzu) coupled to mass spectrometer (MS
Fig. 1 Liquid–Liquid Extraction Procedure.
Table 1 Extraction of pesticides doped in biological matrices.
Pesticides names Pest. families RT Std area Sample area Qi (ppm) Qr (ppm) Yield (%)
Dichlorvos OP 9.8 476291 224825 5 3.54 70.8
Chloropyriphos OP 25 2602744 1273835 5 3.67 73.4
heptachlor OC 22.5 918270 438669 5 3.58 71.6
DDT OC 31.95 2271035 724233 5 2.39 47.8
RT: retention time, Std: standard area, Qi: doped concentration, Qr: concentration recovered, OP: organophosphate, OC: organochlorine, DDT: dochlorodiphenyltriethane.
mm internal diameter and 0.25 µ of film thickness. 1 µ of sample is injected in mode of splitless pulsed (20 psi for 60 s), with a purge flow of 50 mL/min for one minute, the injector temperature is 220 °C. The temperature program used for the analysis is as follows: 50 °C/min, 20 °C/min to 180 °C, 10 °C/min to 190 °C, 3 °C/min to 240 °C, followed by a temperature gradient to 300 °C at 10 °C/min, this temperature being maintained for 5 min. The carrier gas used is helium (8.4 psi Helium N55) to 1.7 mL/min (constant flow). The temperature of the interface between the GC and the mass spectrometer was maintained constant (200 °C). The ionization of the compounds was performed by electron impact at 70 eV. The ions separated by a quadrupole filter according to their mass/charge ratio (m/z). The detection performed by ion selection mode (SIM Selected Ion Monitoring) with the following parameters: dwell time = 80 ms, 1.16 cycles per second and the electron multiplier voltage 400 V. autotune. Generally,
the authors use mass spectrometry to better identify compounds that contain samples injected.
5. Results
After analyzing, the quantitative results have been presented [concentration recovered (Qr), and Yield (%) ] in (Table 1).
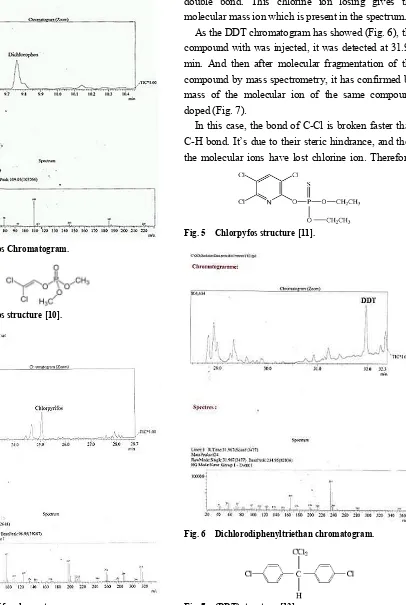
As the dichlorvos chromatogram has showed in Fig. 2, the compound that the authors injected, it was detected at 9.75 min. And then after molecular fragmentation of the compound by mass spectrometry, it has confirmed by mass of the molecular ion of the same compound doped in Fig. 3.
The molecule doped was detected at 25.092 min, as has shown on the chlorpyrifos chromatogram (Fig. 4). The mass of the molecular ion in the spectrum do not correspond with the molecular mass of the compound really doped (Fig. 5). Therefore, it means that the molecule has lost the chloride ion in position 3 of all molecules. It’s due from the sulfur approximity which
Sample doped + 2 mL of toluene (solvent extractants)
Final volume in the vial Centrifugation at 5000 rpm, 15 min, 4 °C
Recovery of the supernatant of each sample doped 2 min vortexing
Fig. 2 Dichlorvos Chromatogram.
Fig. 3 Dichlorvos structure [10].
Fig. 4 Chlorpyrifos chromatogram.
the number of electronegativity close to chlorine. But sulfur is much more stable with phosphorus by their double bond. This chlorine ion losing gives the molecular mass ion which is present in the spectrum.
As the DDT chromatogram has showed (Fig. 6), the compound with was injected, it was detected at 31.96 min. And then after molecular fragmentation of the compound by mass spectrometry, it has confirmed by mass of the molecular ion of the same compound doped (Fig. 7).
In this case, the bond of C-Cl is broken faster than C-H bond. It’s due to their steric hindrance, and then the molecular ions have lost chlorine ion. Therefore,
Fig. 5 Chlorpyfos structure [11].
Fig. 6 Dichlorodiphenyltriethan chromatogram.
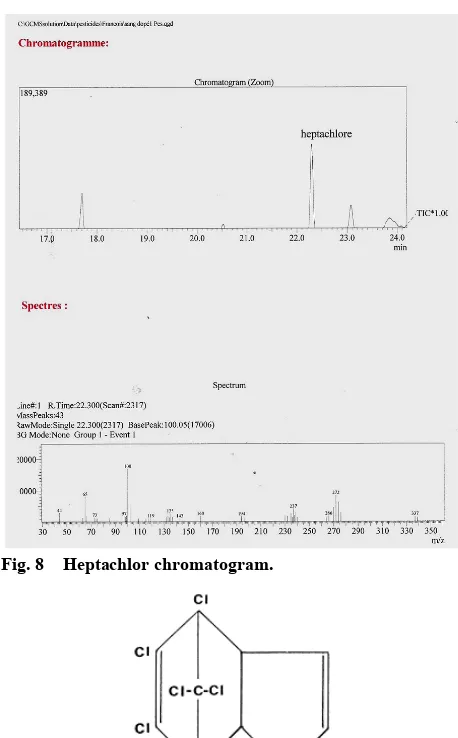
Fig. 8 Heptachlor chromatogram.
Fig. 9 Heptachlor Structure [13].
the molecular mass of the heptachlor compound doped is equal to the sum of the molecular mass ion in spectrum (Fig. 8),and the atomic mass of chloride ion lost.
6. Discussion
Generally, pesticides are a group of chemical compounds very different from one class to another with physico-chemical characteristics, which will require the development of varied assays and consequently highly diversified analytical equipment; this can also be a handicap for many laboratories [2]. As shown in the various studies, the pesticides are ubiquitous in environment. They are biologically active and therefore intentionally toxic to target
organisms but also to non-target organisms. The human is one of them. Because he is applicator of these substances but he also consumes the food contaminated by residues [14]. The risk of toxicity depends on the exposure mode, acute toxicity or chronic toxicity [15]. The human contamination by pesticides can be done in different ways: contamination by ingestion, skin contact or by breathing (inhalation). The risk associated with contamination by ingestion is much more dominant than any other type of contamination, followed by contamination by inhalation [16, 17].
Once in the body, pesticides accumulate in adipose tissue, never to dislodge. However, the toxicity varies according to the active substances they contain. Organochlorines for example, by their persistence in the environment pose a significant animals risk. Especially as humans accumulation is mainly in adipose tissue but also in the liver and muscles [16, 17]. Different studies [15, 18, 19] showed that human exposure to pesticides can manifest diseases long and short term. They also showed the degree of toxicity and effects in the human body. Despite this, it appears that the toxic dose in humans varies from one group to other groups of pesticides. Therefore, it is very difficult to establish a toxic dose “unique”. It is the same, hence the concentrations lethal blood or serum which justifies sometimes looking for a very low limit of quantification [2, 20].
measurement of the compound in the blood.
In general, according to a study published by Lacassie and Coll. [24], an assay of OP in blood and serum by GC-MS capillary column PTE5, ionization is produced by electron impact and SIM acquisition mode, revealing Limits of Detection (LOD) ranging from 5 to 25 ng/mL depending on the pesticide. Limits of quantification (LOQ) ranged from 10 to 50 ng/mL. The authors observed excellent response linearity from LOQ up to 1 mg/L [24].
In fact the work of Barr and Lopez and colleagues, they describe techniques for the determination of OC pesticides and their metabolites. In serum after extraction by SPE column DB-5MS [25] and SPME capillary column DB-XLB [26] after dosing by Chomatographie gas coupled to high resolution mass spectrometry (GC-HRMS) both, they show that the limits detections are the order of pg/mL. The pesticide most frequently observed is pp DDE, metabolite of pp DDT, the average grade of 2.1 ng/mL.
In order to highlight the adverse effects of pesticides on human health, in this study, the authors used samples of blood and gastric fluids which are often used in analyzes of human exposure. The blood has a strong link with the most toxic pesticides. It is also considered as the main compartment, where high concentrations of residues are likely to be expected. Therefore, because of the complexity of the blood, the quantification of these residues is a difficult task. It is important to use GC/MS to identify these products. The authors found that this extraction method used is much more sensitive to the OP for the OC [27].
7. Conclusions
The dosage of pesticides and their metabolites in the blood allows both the diagnosis of intoxication and the supervision of a professional or environmental exposure. Blood is much more complex, which explains the great difficulty of assaying multitudes chemical compounds that are dangerous to human health. Indeed, after treatment of the sample liquid
extraction (LLE) it’s very important to measure them by instrumental analysis that uses the methods of gas chromatography (GC) for volatile compounds or high pressure liquid chromatography (HPLC) coupled to the mass spectrometry (MS). These methods allow characterizing them.
Acknowledgments
The study was performed at National Institute of Hygiene (NIH) of Rabat, Morocco. The authors acknowledge the research team of NIH, particularly Ms. Mama Idamine for her kind Help for laboratory analysis. The authors also thank Dr. Elom Kouassive Aglago of the research in Nutrition and Food Sciences of Ibn Tofail University, Morocco, for his pertinent remarks.
References
[1] Nations, U. 2003. International Code of Conduct on the Distribution and Use of Pesticides (Revised Version)
adopted by the Hundred and Twenty-third Session of the FAO Council in November 2002.
[2] Anger, J., Kintz, P., Rennes, U. De, and Cedex, R. 2009. “Difficultés analytiques de la caractérisation des pesticides dans le sang, Analytical Difficulties in the Characterization of Pesticides in Blood.” Ann. Toxicol. Anal. 21 (3): 131-141.
[3] Aprea, C., Colosio, C., Mammone, T., Minoia, C., and Maroni, M. 2002. “Biological monitoring of pesticide exposure: A review of analytical methods.” Journal of Chromatography B. 769 (2): 191-219.
[4] Alavanja, M. C. R., Hoppin, J. A., and Kamel, F. 2004. “Health effects of chronic pesticide exposure: Cancer and neurotoxicity.” Annual Review of Public Health 25: 155-197.
[5] Liu, S., and Pleil, J. D. 2002. “Human blood and environmental media screening method for pesticides and polychlorinated biphenyl compounds using liquid extraction and gas chromatography.” Mass Spectrometry Analysis 769: 155-167.
[6] Liberda, E. N.,Tsuji, L. J. S., Martin, I. D., Cote, S., Ayotte, P., Dewailly, E., and Nieboer, E. 2014. “Plasma concentrations of persistent organic pollutants in the Cree of northern Quebec, Canada: results from the multi-community environment-and-health study.”
and Hammock, B. D., 2007. Monitoring human exposure to pesticides using immunoassay.
[8] Kudo, K., Nagamatsu, K., Umehara, T., Usumoto,Y., Sameshima, N., Tsuji, A. and Ikeda, N., 2012. “Rapid and reliable screening method for detection of 70 pesticides in whole blood by gas chromatography–mass spectrometry using a constructed calibration-locking database.” Legal Medicine 14 (2): 93-100.
[9] Hernández, F., Sancho, J. V., and Pozo, O. J. 2005. “Critical review of the application of liquid chromatography/mass spectrometry to the determination of pesticide residues in biological samples.” Analytical and Bioanalytical Chemistry 382 (4): 934-946.
[10] Wright A. S., Huston D. H., and Wooder M. F., 1979. "The chemical and biochemical reactivity of Dichlorvos.”
archives of Toxicology 42: 1-18.
[11] Han, X. L., Tian, F. F. , Ge, Y. S., Jiang, F. L., Lai, L., Li, D. W., Yu, Q. L., Wang, J., Lin, C., and Liu, Y. 2012. “Spectroscopic, structural and thermodynamic properties of chlorpyrifos bound to serum albumin: A comparative study between BSA and HAS.” Journal of Photochemistry and Photobiology B 109: 1-11.
[12] Abad, A., Manclu, J. J., Mojarrad, F., Mercader, J. V., Miranda, M. A., Primo, J., Guardiola, V., and Montoya, A. 1997. “Hapten Synthesis and Production of Monoclonal Antibodies to DDT and Related Compounds.” Journal of Agricultural and Food Chemistry pp. 3694-3702.
[13] Suwalsky, M., Benites, M., Villena, F., Aguilar, F., and Sotomayor, C. P. 1997. “The organochlorine pesticide heptachlor disrupts the structure of model and cell membranes.” BBA Biomembranes 1326 (1): 115-123. [14] Soleas, G. J., Yan, J., Hom, K., and Goldberg, D. M.
2000. “Multiresidue analysis of seventeen pesticides in wine by gas chromatography with mass-selective detection.” Journal of Chromatography A 882: 205-212. [15] Beaulieu, C. De, and Multigner, L. 2005. Effets retardés
des pesticides sur la santé humaine 4: 187-194.
[16] Wyk, E. van, Bouwman, H., Bank, H. van der, Verdoorn, G. H., and Hofmann, D. 2001. “Persistent organochlorine pesticides detected in blood and tissue samples of vultures from different localities in South Africa.”
Comparative Biochemistry and Physiology Part C: Toxicology & Pharmacology 129 (3): 243-264.
[17] Furst, P., Furst, C., and Wilmers, K. 1994. “Human Milk as a Bioindicator for Body Burden of PCDDs , PCDFs , Organo- chlorine Pesticides , and PCBs.” Environ. Health Perspect. 102: 187-193.
[18] Rezg, R., Mornagui, B., Kamoun, A., El-Fazaa, S., and Gharbi, N. 2007. “Effect of subchronic exposure to malathion on metabolic parameters in the rat.” Comptes
Rendus Biologies 330 (2): 143-147.
[19] Masri, W., Belwaer, I., Brahmi, N., Ghorbal, H., Hedhili, A., and Mouldi, A. 2011. “Incidence et caractéristiques des intoxications aux inhibiteurs de cholinestérases.” Revue Francophone des Laboratoires
429: 41-46.
[20] Wang, H. S., Chen, Z. J., Wei, W., Man, Y. B., Giesy, J. P., Du, J., Zhang, G., Wong, C. K. C., and Wong, M. H. 2013. “Concentrations of OCPs (organochlorine pesticides) in human blood plasma from Hong Kong: Markers of exposure and sources from fish.”
Environment International 54: 18-25.
[21] Cochran, R. C., Kishiyama, J., Aldous, C., Carr, W. C., and Pfeifer, K. F. 1995. “Chlorpyrifos: Hazard assessment based on a review of the effects of short-term and long-term exposure in animals and humans.” Food and Chemical Toxicology 33 (2): 165-172.
[22] Chaudhary, S., Vora, S. G. M. D. H., Modi, P., Chauhan, V., and Chotaliya, D. 2013. “An Epidemiological Study of Fatal Aluminium Phosphide Poisoning At Rajkot.”
IOSR Journal of Pharmacy pp. 17-23.
[23] Konradsen, F., Hoek, W. van der, Cole, D. C., Hutchinson, G., Daisley, H., Singh, S., and Eddleston, M. 2003. “Reducing acute poisoning in developing countries—options for restricting the availability of pesticides.” Toxicology 192 (2-3): 249-261.
[24] Lacassie, E., Gaulier, J. M., Marquet, P., Daguet, J. L., and Lachatre, G. 2001. “Multiresidue Determination Method for Organophosphorus Pesticides in Serum and Whole Blood by Gas Chromatography—Mass-selective Detection.” Journal of Chromatography B: Biomedical Sciences and Applications pp. 109-116.
[25] Barr, J. R., Maggio, V. L., Barr, D. B., Turner, W. E., Sjödin, A., Sandau, C. D., Pirkle, J. L., Needham, L. L., and Patterson, D. G. 2003. “New high-resolution mass spectrometric approach for the measurement of polychlorinated biphenyls and organochlorine pesticides in human serum.” Journal of Chromatography B 794 (1): 137-148.
[26] López, R., Goñi, F., Etxandia, A., and Millán, E. 2007. “Determination of organochlorine pesticides and polychlorinated biphenyls in human serum using headspace solid-phase microextraction and gas chromatography-electron capture detection.” Journal of Chromatography B-Analytical Technologies in the Biomedical and Life Sciences 846 (1-2): 298-305.
[27] Tarbah, F. A., Mahler, H., Temme, O., and Daldrup, T. 2001. “An Analytical Method for the Rapid Screening of Organophosphate Pesticides in Human Biological Samples and Foodstuffs.” Forensic Science International
Journal of Life Sciences, ISSN 1934-7391, USA
Contribution to the Bio-ecological Study of Date Palm
Entomofauna in the Region of Saoura (South Algeria)
Ali Boulanouar1, Mohammed Anouar Khelil1, Ahmed Makhloufi2 and Larbi Benlarbi2
1. Department of Ecology and Environments, University of Abou Bekr Belkaid Tlemcen, Tlemcen 13000, Algeria 2. Department of Sciences and Technology, University of Béchar, Béchar 08000, Algeria
Received: February 11, 2014 / Accepted: June 19, 2014 / Published: June 30, 2014.
Abstract: Saoura region is situated in the south west of Algeria characterized by a height density of date palm trees (Phoenix dactylifera), where the authors note several oases such as: Taghit, Igli, Béni Abbes… Despite this high density, the production of dates is still insufficient even for the local consumption, this is due to: Increasing salinity of water and soil in the old palm groves, the spread of many fungal diseases, where the most serious is the Bayoud (Fusaruim oxysporum), and finally insect pests, three of them remain the most serious: white scale locally named Semm (Parlatoria blanchardi), Boufaroua (Oligonychus afrasiaticus), and Doud called dates worm (Ectomyelois ceratoniae). By using different trapping techniques, an entomofauna inventory was realized in the region of Saoura, where 3238 individuals are collected, distributed in 13 orders, 72 families and more than 132 species. The inventory will allow us to classify insects according to their economic importance, determine their life cycle and know their adaptation to date palm. The dynamics of these populations will be studied through the spatial-temporal repartitions. In parallel this study aims to identify the natural enemies (auxiliaries and parasitoids) of date palm pests in order to improve the biological control and this in hopes to ameliorate the production.
Keywords: Phoenix dactylifera L., Saoura region, entomofauna inventory, white scale, auxiliaries, parasitoids.
1. Introduction
Date palm is one of the main riches of Saoura region, and that through its hot and dry climate, which allows the tree to grow and complete the ripening of its fruits. The exploitation of date palm is a major asset for the development of the Saharan areas, especially at the present time where Algeria gives much more importance to natural resources. As result, preservation, development and the rational exploitation of oases have become an urgent necessity. Therefore, to achieve these main objectives, the research in this field is a prerequisite.
Indeed, a well maintained palm can produce up to 100 kg of dates. However its growth, flowering and fruiting is closely linked to ecological factors, including the biotic and abiotic one.
Corresponding author: Boulanouar Ali, Ph.D., research fields: animal ecology and entomology. E-mail: [email protected].
Insects inhabit every terrestrial habitat on the planet and play a major role in the evolution and the maintenance of biotic communities. They are the primary pollinators of flowering plants; they are important consumers and recyclers of decaying organic matter; and they are integral components in the food webs of vertebrates and other invertebrates. For these reasons, and many others, the study of insects and their relatives is of increasing importance as society faces increased challenges to preserve and enhance environmental quality, reduce pesticide usage, increase crop productivity, control food costs, and increase trade in the global community [1].
The studies of relationships between insects and their host plants in the oases still face several difficulties:
The authors record few scientific works on
plant-insect relationships in the region.
D
The Saharan environment studies are scarce qualitatively and quantitatively. By using different equipment and collecting methods, an entomofauna inventory was realized in Saoura region. Among the numerous insects inventoried, someone has been a subject of a bio-ecological study; these species were selected according to their abundance, frequency and their harmful effect on palms. Because of the damage inflicted by pest species which attack date palm, increased knowledge of these organisms has the potential to save time and money. Correct identification of a newly detected pest is of utmost importance because the scientific name of an organism is the key to all known information about its morphology, its behavior and life history, and its potential threat to human welfare [2]. For these reasons, the list of inventoried insects compared to that made by P. Peyerimhoff since 1928 that exist at Beni Abbes museum, allow us to identify species newly emerged or completely disappeared.
Naturally the population of white scale is limited by certain number of parasites and predators such as Cybocephalus palmarum [3]. The disappearance of some natural enemies of white scale caused an ecological imbalance. In the absence of bio-control, the population of white scale intensifies the reproduction up to four generations per year [4]; the situation becomes worse particularly after the renewing of attacks and the invasion widen more.
2. Materials and Methods
2.1 Study Sites
The Saoura region situated in the southwest of Algeria roughly 1000 km far from the capital Algiers, just at the southeast Moroccan boarders, where it has recently become known as Béchar (Fig. 7). The greater part this region is uninhabitable sand dune fields (ergs), in particular the Great Western Erg and the Erg Er Raoui or dry plains (hamadas) are suitable for grazing but with
insufficient surface water to support agriculture, most settlement is therefore concentrated in oases along the Saoura valley where we can count more than 20 Oasis (Table 1) differ in terms of density and the diversity of flora and fauna.
2.2 Insects Collecting
The realization of the first collection took place in seven (07) oases of Saoura where the observations started at the beginning of January 2009, the sampling period took 3 years with a total of 240 field visits divided into 204 diurnal visits (from 9 to 11 am) and 36 nocturnal outing (from 8 to 10 pm).The operation has been through many steps as represented in (Fig. 1).
However for the accomplishment of the second collection, we estimated the different species of P. Peyerimhoff collection which was realized in 1928
and conserved at Beni Abbés museum. Finally we
compared both inventories to identify species newly emerged or completely disappeared, in order to know the consequences of the disappearance or the emergence of each one.
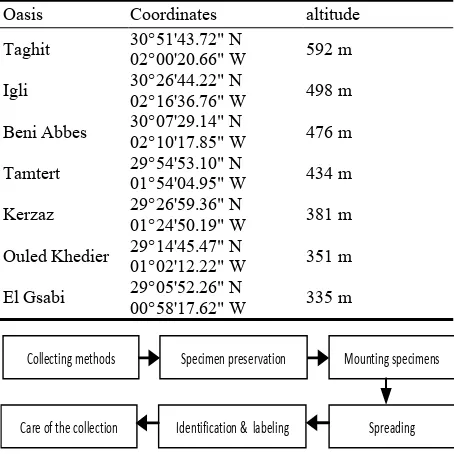
Table 1 Coordinates of the most important palm groves in Saoura.
Oasis Coordinates altitude Taghit 30°51'43.72" N
02°00'20.66" W 592 m Igli 30°26'44.22" N
02°16'36.76" W 498 m Beni Abbes 30°07'29.14" N
02°10'17.85" W 476 m Tamtert 29°54'53.10" N
01°54'04.95" W 434 m Kerzaz 29°26'59.36" N
01°24'50.19" W 381 m Ouled Khedier 29°14'45.47" N
01°02'12.22" W 351 m El Gsabi 29°05'52.26" N
00°58'17.62" W 335 m
Fig. 1 Different steps followed during the implementation of the inventory.
Collecting methods Specimen preservation Mounting specimens
Spreading
Identification & labeling
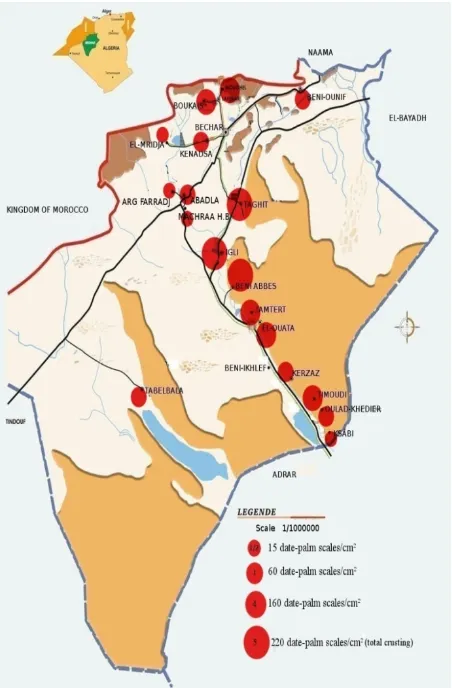
2.3White Scale Distribution Map
To establish a repartition map for one of the major enemies of date palm in Saoura region, we took in consideration:
The characterization of the level of infestation in
a simple way, using a scoring method with a logarithmic scale ranges from 0 to 5 [5].
The actual density of white scale which
corresponds to these indices is evaluated per cm² per leaflets: (0 = 0 scales/cm², 1/2 = 15 scales/cm², 1 = 60 scales/cm², 4 = 160 scales/cm², 5 = 220 scales/cm² which represents a total crust of palm). These notations focus on palms of the heart, inner and the outer crown of the date palm.
3. Results and Discussion
3.1 Representation of the Study Area
The region of study took its name from the valley of Saoura which results from the union of Oued Guir and Oued Zouzfana. Saoura region has a total land area estimated at about 138400 km², divided between rangelands (138190 km²) and an agricultural area (21000 ha) which has all the characteristics of a Saharan agriculture [6]. This area was characterized by a semi-arid Saharan climate, an average rainfall lower than 100 mm/year, an average temperature of
21 °C with extremes of 55 °C in shade at summer and 7 °C in winter, sandy ground and desert vegetation limited mainly to the xerophytic species such as Ephedra alata alenda, Acacia tortilis and date palm trees within oases [7]. Currently, the zone comprises a lot of oases in production covering a total surface of 1440 hectares [8]. Some oases in this area are continental and of the modern type with a mean planting space of 10 x 10 m. The rest are traditional, where the principal vegetation were date palm trees with a marked predominance of the Fagous variety and very few market-gardening or fodder practices for farmer consumption [9]. The estimated number of date palm in production at Saoura region is 711322 trees (Direction of Agricultural Services DAS, 2011) distributed as follows (Fig. 2).
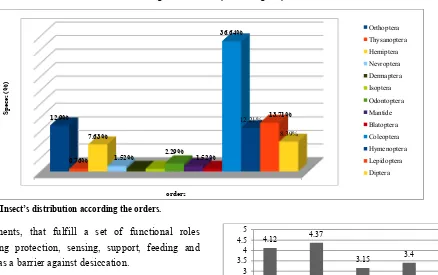
3.2 Study According the Number Captured and the Specific Importance of Different Orders
During the sampling period, we collected over than 3238 individuals at the different region of Béchar
(Saoura), all techniques included. The distribution of
identified species represents a rich entomofauna and height biodiversity level which varies from one order to another (Fig. 3).
The most numerous order in Saoura is Coleoptera. They have an exoskeleton contain rigid and resistant
Fig. 2 Numbers of palm trees in the various oases of Saoura.
0 20000 40000 60000 80000 100000 120000
Fig. 3 Insect’s distribution according the orders.
components, that fulfill a set of functional roles including protection, sensing, support, feeding and acting as a barrier against desiccation.
3.3The Entomofauna Biodiversity in Saoura
The large generally treeless arid areas on earth are mainly steppes, semideserts, and deserts. An almost continuous belt extends through North Africa and Asia, from Mauretania to eastern Mongolia.
The insects which inhabit these areas must be tolerant of lack of cover, as well as dryness, strong solar irradiation, extreme diel temperature changes, and often strong winds. Compared with other biomes, insect biodiversity is low, but even the most extreme, vegetation-free types of desert are not totally void of insects; several darkling beetles (Tenebrionidae), for example, survive on wind-transported organic material [10].
According to the histogram (Fig. 4), it notes that the biodiversity of insects is closely linked to oases density, where Shannon index and equitability values vary from one to another.
3.4 Distribution of Collected Species (Adults) by
Feeding Habits
The classification of insects by feeding habits
allowed us to know the ecological impact of each
species, taking in consideration of the life stage of
Fig. 4 The biodiversity in some oases of Saoura.
each insect (imago stage). At the study region, more than 33.8% of the collected specimens are phyllophagous (feed on leaves) with lapping type
mouthparts, however there are many opophagous
insects (feed on sap) is 7.69%, they feed on liquid food and their mouthparts are modified to form a tube through which fluid can be drawn into the mouth and, often, another tube through which saliva is injected into the food so that it is digested to some extent before being ingested [10]. One of the opophagous species which causes a heavy damage for date palm
the authors found is the white scale Parlatoria
blanchardi (Fig. 5).
Among the entomophagous insects (Mantidae,
Carabidae), the authors note that more than 15% of species are considered as auxiliaries, they play an
important role in oases ecosystem because they
Igli Taghit Beni Abbes Kezaz
Fig. 5 Insect’s distribution according feeding habits.
contribute to the ecological balance. Some xylophagous species, (Cerambycidae and Bostrichedae), feed on the wood of date palm and burrow into the trunk and leaves. They are considered as enemies of the host plant.
Species that belongs to hymenoptera order play a very important ecological role during the flowering season that participates at the palm date propagation, including pollination and seed dispersal [11].
The necrophagous and saprophagous insects participate at nutrient recycling, via leaf-litter and wood degradation, dispersal of fungi, disposal of carrion and dung, and soil turnover [12].
3.5 Factors that Affect the Horizontal Distribution of
Species
(1) The palms density: Normally the distance between two palms should be 10 m, it is a distance that promotes palms a good lighting, good irrigation (good display of roots) and good aeration;
(2) Plant biomass: the tree size is closely linked to insect’s biodiversity;
(3) Uses of pesticides, fertilizers and other chemicals;
(4) Plant biodiversity: there is a direct relationship between plant biodiversity and the entomological biodiversity;
(5) The situation and altitude of the oasis;
(6) Varieties of date palms: there are a several
varieties of palm in the region such as Fegous, Toumliha, Ghars, Hmira etc. These varieties differ from one to another according to:
Shape, size and color of palms;
Period of flowering and fruiting;
Duration of ripening fruits (dates);
Water content of dates (date soft, semi soft or dry).
All these factors affect the horizontal distribution of insects.
(7) The palms state: The abandoned or neglected palms represent a favorable environment for the growth and reproduction of insect larvae.
3.6 Statistical study
The chosen characters in our case for the Factorial Correspondence Analysis (FCA) are: the various monthly mean temperature, pest species of date palm with their natural enemies (Fig. 6). It represents the distribution of insects according to temperature where we record three cloud bitmap which represent the groups of similar insects in their ecological requirement and particularly the temperature.
Group A contain taxa that develop in moderate temperatures between 18.76 °C and 22.78 °C. The majority of these species appear during spring where the date palm accomplishes one of its most important vegetative stages which is flowering.
Fig. 6 Insect’s distribution according to FC Analysis. 33.80%
13.08% 7.69% 4.62% 15.38% 6.15%
5.38% 3.08%
11.54%
phylophagous
nectariphagous
opophagous
saprophagous
entomophagous
xylophagous
necrophagous
hematophagous
polyphagous
A
B
All species of the group A are pests that cause significant damage to palm during this period and especially to the inflorescences in spathes. Ectomyelois ceratoniae and Ephestia elutella are two species belonging to Pyralidae family. Their larvae remain in dates during winter then they pupate to appear as adults in late spring to renew the attacks. They installed on the first unknotted dates.
The group B includes Hemiptera species (Diaspididae). The species of this family have a significant presence throughout the year (until 160 species/cm² leaflet in some oases). They can attain until four generations per year. The Diaspididae tolerate low winter temperatures (15.15 °C to 22.78 °C), relatively the very low temperatures (less than 12.41 °C) cause a diapauses that the insect stops completely its development for nearly three months. It is the immature female or larva state of the second stage that the insect overwinters [13]. The species of this family are classified as pests of major economic importance, especially the famous white scale of palm
date (Parlatoria blanchardi Tag).
The Group C: The species of this group (Cybocephalus palmarum, and Pharoscymnus ancharago) represent the main natural enemies of the white scale, the emergence of these species during the month of August when the temperature is relatively very high (more than 40.87 °C) causes a remarkable decrease in the number of white scale (from 160 species/cm² to 115 species/cm² of leaflet in some oases).
4. Comparing both Results of Inventories
In 1928 the scientist P. Peyerimhoff specialist in entomology collected the different insects characterized Saoura and Hoggar regions in the extreme south of Algeria, currently the collection is kept in the museum of Beni Abbess 1250 km far from Béchar. After completing the inventories, the authors start comparing the results with those of P. Peyerimhoff. The following table shows the results
obtained, the Disappeared species (Table 2) represented in the set of species which found in the old collection of P. Peyerimhoff 1928 but absent in the new collection 2009.
However the new species (Table 3) are the species which found in the new collection 2009 but absent in the old collection of P. Peyerimhoff 1928.
4.1 Consequences of Insect’s Disappearance and Emergence
The disappearance of some insect species, especially the entomophagous one, such as Cebocephalus sp and Chilochorus bipustulatus, was catastrophic for the region, where it provoked disastrous consequences for the ecosystem by increasing the level of proliferation of some pests such as white scale (Parlatoria blanchardi), which Acquired the ability to reduce the diapauses period and increase the number of generations per year, it exceeds three generation per year so it as polyvoltine specie [13].
The introduction of exotic species is responsible for great perturbations in many ecosystems. The arrival of predators, competitors, pests, and pathogens has caused decreases in populations of native species in many areas. Native or endemic species often occupy narrow ranges, small population sizes, and lack defenses, all of which make them vulnerable to species introductions [10].
Table 2 The species disappeared from Saoura.
Order Family Specie
Coleoptera Coccinellidae Chilochorus bipustulatus
Coleoptera Carabidae Scarites Occidentalis
Coleoptera Carabidae Scarites Eurytus
Coleoptera Cerambycidae Plocaederus caroli
Coleoptera Cerambycidae Derolus mauritanicus
Coleoptera Cybocephalidae Cebocephalus sp
Table 3 The new species emerged in Saoura.
Orders Family Species Coleoptera Scarabaeidae Oryctes rhinocéros
Hymenoptera Apidae Xylocopa pubescens
Lepidoptera Noctuidae Dysgoniaalgira
4.2 Causes of the ecological imbalance
There are several factors that have caused this ecological imbalance, that they count:
Construction of a dam in Kenadza city, which
caused a disturbance in the valley floods. This led to the exacerbation of drought and groundwater salinity; the abandoned oases became a suitable place for the proliferation of palm pests.
Random and excessive use of pesticides, during
the desert locust (Schistocerca gregaria) invasion in
1995.
The spread of many fungal diseases, especially
Bayoud (Fusaruim oxysporum f. sp. albedinis), led to
the deterioration of the phytosanitary status of date palm, which represents a favorable environment for pest’s evolution.
4.3 White scale (Parlatoria blanchardi) adaptations
This insect improved defenses against any fluctuation of the ecological factors, whether biotic or abiotic, by the evolution of a waxy shield. These insects are distinctive for their sluggish or sessile habits, reduced morphology and the waxy secretions they produce. These secretions, which are mixtures of true waxes plus lipids, resins and other substances, are produced by integumentary wax glands [14]. In addition to the shield some other factors have contributed to the worsening of the situation more like: density of palms and lack of respect for the distance between the trees during the planting; disappearance of certain species, especially the auxiliary and parasitoids that attack scale insects; these conditions
allowed the white scale Parlatoria blanchardi to
exceed 4 generations per year, the spring generation being the most injurious. All green parts of the trees were damaged, especially the palms of the basal crown. In some cases, even fruits are not spared from injury. The damages caused by this scale insect are of several kinds:
This insect feeds on palms sap that aspire using a
rostrum;
Fig. 7 Distribution of white scale in Saoura region.
Insect injects a certain quantity of a toxin which
alter chlorophyll;
Crusting prevents respiration and photosynthesis;
Rapid aging of palms and premature death;
Reduction of production;
Deterioration of fruit quality.
The following map (Fig. 7) represents the excessive density of white scale in some oases which reflect the enormity of the damage done to the oasis ecosystem.
5. Conclusions
In the Saharan region of Saoura, date palm clearly dominates the other plant species. The presence and dominance of this plant are conditioned by temperature, with an optimum of 30 °C and rainfall up to 100 mm of water per year.


![Fig. 3 Initial velocity. Estimation of initial velocity represented conjugation with the formula v=d[p]/dt: where v represented velocity and p represented product](https://thumb-ap.123doks.com/thumbv2/123dok/3955142.1898562/44.595.169.435.88.501/initial-velocity-estimation-velocity-represented-conjugation-represented-represented.webp)
