JEJAK
Journal of Economics and Policy
http://journal.unnes.ac.id/nju/index.php/jejak
Analysis of Squid Net Fisheries Business Production
Herna Octivia Damayanti1, Indah Susilowati2, Herry Boesono3
1Student of Master of Coastal Resources Management, Diponegoro University 2Faculty of Economics and Business, Diponegoro University
3Faculty of Marine and Fisheries, Diponegoro University
Permalink/DOI: http://dx.doi.org/10.15294/jejak.v10i1.9125
Received: July 2016; Accepted: September 2016; Published: March 2017
Abstract
Squid net is one of alternatives to replace trawl net in Pati regency. The purposes of the research are 1) to determine the influence factors, 2) to analyze the return to scale, 3) to analyze cost and return.The research location in Juwana Subdistrict particularly Bakaran Kulon, Dukutalit, Bajomulyo and Bendar Villages. The research conducted on October 2015 to June 2016. The number of final samples was 36, while the formulation of management strategies used 15 samples by snowball sampling. Data analysis techniques used 1) Cobb Douglas production function, 2) revenue-cost ratio analysis. The results of the research are 1) significant inputs for production factor are long trip, Solar fuel, the number of crew and lights. 2) the return to scale of squid net bussiness in Juwana subdistrict Pati regency is -0.231 means decreasing to scale. 3) the R/C ratio of scenario II more profitable for squid net crews than scenario I.
Key words : production-function, bouke-ami, Juwana, return-cost.
How to Cite: Damayanti, H., Susilowati, I., & Boesono, H. (2017). Analysis of Squid Net Fisheries Business Production. JEJAK: Jurnal Ekonomi Dan Kebijakan, 10(1), 30-47. doi:http://dx.doi.org/10.15294/jejak.v10i1.9125
© 2017 Semarang State University. All rights reserved Corresponding author :
Address: Jl. Prof. Soedarto, Tembalang, Semarang, 50275, Central Java
E-mail: [email protected]
INTRODUCTION
The growth of Indonesian aquaculture in 2009-2013 that is 29.78% higher than the average growth of marine fisheries 4.61% (Marine and Fisheries Ministry, 2014). For Central Java Province, the average growth of inland fisheries in 2009-2013 25.96% while the average growth of marine fisheries 4.09% (Statistics of Central Java province, 2014).
Special for marine fisheries, Pati regency is one area in Central Java province that became the backbone of marine fish production in Central Java. In the Year 2013, Pati regency was ranked third with
contribution of 14.34%. The biggest
contribution of marine fisheries contributed by Rembang regency at 28.45%, followed by Batang regency 14.59%. For the other areas that contribute to marine fisheries, among others Tegal city 10.00% and Pekalongan city 8.16% (Statistics of Central Java province, 2014). Aquaculture production itself can be affected by fishing gear. Pasaribu (2008) in his research stating that the fishing gear with proper operation is one of the factors that determine fisheries production. Fishing gear used in Pati regency consists of Purse Seine, Dogol/Krikit, squid nets, gill nets, Pejer nets, Trammelnet nets, trawl, Prawe Fishing rod and nets (Statistics of Pati Regency, 2014).
On 2015, Marine and Fisheries Ministry of Indonesia Republic issued Ministerial Regulation Number 2 of 2015 on the prohibition of the use of fishing gear trawl and Seine Nets in Regional Fisheries Management of Indonesia Republic. Based on the Ministerial Regulation, fishing gear such as dogol and trawl are prohibited to use, including in Pati Regency. Based on the interview result with Pati Regency fisherman figures, fishing gear other than trawl and dogol that have good prospects is squid net and Purse Seine. Based on marine and
fisheries agency of Pati Regency, squid net fishing gear used engine boat of 10-30 GT, meanwhile Purse Seine fishing gear used engine boat above 30 GT. Operation of Purse Seine growth in squid net fishing gear, which reached 48.39% in 2013 shows that there is interest from fisherman to use squid net fishing gear. According Nelwan et al (2012), fishing activities are activities performed to obtain a number of catches in order to meet the demand by using various types of fishing gear. In practice, the operation is still optimal. Many fishing gear types used by fisherman creates competition
between fishing gear types. Meanwhile
Regency. (2) To analyze the return to scale of squid net production in Juwana Subdistrict Pati Regency. (3) To analyze the R/C ratio of squid net fisheries business in Juwana Subdistrict Pati Regency.
Cobb-Douglas Production Function
The Cobb-Douglas production
function was introduced by Charles W. Cobb and Paul H. Douglas. This production function created after conducting research on several industries in the world (Hossain et al, 2013). Felipe and Adams (2005) said that the estimation of Cobb-Douglas function is a way to conduct macroeconomic analysis and critical theoretical constructs such as potential output, technical changes or labor demand. By using the production function, we can see changes in supply with
simultaneous observation of the
development of labor quantity, capital and total factor productivity (Hajkova and Hurnik 2007). The Cobb Douglas function is a functional relationship between input and output (Ahmad and Khan, 2015 ). The
production function analysis is the
continuation of the regression analysis, that is the analysis describes causal relationships.
Weakness : Substitutional elasticity value (=1) and form the linear lines. Incorrect variable spesification causing the production elasticity is negative or the value is too large or small. It is also biased against management variables. Factors management is an important factor to increase production because it related directly with the dependent variable such as the management of the use of production factors which will drive the technical elasticity of the production function upward. Advantages : simple functional form, economical in the calculation of estimation parameters, and often produce tangible allegations according
to statistical tests. Consistent with
diminishing marginal product, easily obtainable alleged economies of scale, and contributing factors relative.
In the research of Mimit Primyastanto, Soemarno and Anthon Efani 2014 on Cobb-Douglass function studies to Payang fishing gear in Madura Strait with analysis of production factors, which the factors used are fisherman experience, number of trip, the amount of fuel and the length of payang pocket. Result of the research showed that based on F test, it can be said that the cange in production or cathcing (Y) caused by
production factors that are fisherman
experience (X1), number of trip (X2), amount of fuel (X3) and length of payang pocket (X4). The
entire technical production factors
increasing cath production by 0.344 ton/year with assumption the other factor is constant. Larger Payang pocket will make the coverage area wider, it increases the chances to catch fish.
RESEARCH METHODS
The research location in Juwana Subdistrict that are Bakaran Kulon Village, Dukutalit Village, Bajomulyo Village and Bendar Village. This research was held for 9 month, from October 2015 to June 2016. The research population are fisherman who use squid net fishing gear. Total population of fisherman who use squid net fishing gear are 46 person (marine and fisheries agency of Pati regency, 2014), because the total population less than 100 so all of the population used as research sample. Based on the results of current field research when the data have been collected, the population of fishermen using squid net fishing gear Juwana Subdistrict amounted to 41 person. Information obtained that 1 squid net boat were not operating due to the boat owner dies, 2 squid net boat is not operated, 1 squid net boat is the same boat but changed on the number of fishery business license and 1 squid net boat not using squid net fishing gear but using purse seine fishing gear. After
calculation of GT boat showed that range of data is 18-40 GT. To minimize the occurrence of heteroskedatisity, the data used will be limited to 20-40 GT. Consideration taken when determining the limits GT boat is meeting the needs of the data for further data processing.
To estimate the future production, there is need to be know the behavior of production factors affecting production change, so with the known of this behavior are furthermore identified the variables that influence the behavior significantly (Suharso et al, 2006).The model used in the research to describe the relationship between inputs and outputs in production process is the Cobb-Douglas function. To estimate the factors that influence the output, Cobb-Douglas model of appropriate use, because this model is a model that is most relevant (Nugroho, 2015). The Cobb-Douglas production function selected as the relationship between the catch value with the independent variable. Production of sqiud net catch in Juwana Subdistrict Pati Regency is a function of : GT boat, lenght of trip, diesel fuel, wide of net, the engine capacity, consumption, number of crew and lights. Production input for GT boat in the form of an index. This is done with consideration to minimize the occurrence of multicollinearity.
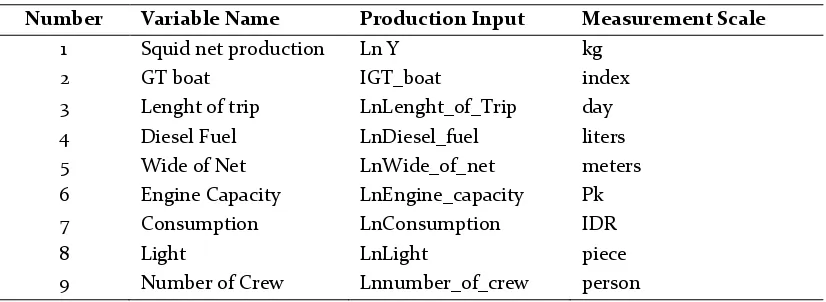
Table 1. Dependent and Independent Variable of Squid Net Fisheries Business
Number Variable Name Production Input Measurement Scale
1 Squid net production Ln Y kg
2 GT boat IGT_boat index
3 Lenght of trip LnLenght_of_Trip day
4 Diesel Fuel LnDiesel_fuel liters
5 Wide of Net LnWide_of_net meters
6 Engine Capacity LnEngine_capacity Pk
7 Consumption LnConsumption IDR
8 Light LnLight piece
9 Number of Crew Lnnumber_of_crew person
The mathematical equation can be written as follows :
𝑌 = f(IGT_boat, Lenght_of_Trip, Diesel_fuel, Wide_of_net, mechine_capacity, Consumption, Light, number_of_crew)
……….………... (1)
The estimation form of Cobb_douglas production function:
Ln Y = Ln b + b1 IGT_boat + b2
LnLenght_of_Trip + b3 LnDiesel_fuel +
b4 LnWide_of_net + b5
LnEngine_capacity + b6
LnConsumption + b7 LnLight + b8
Lnnumber_of_crew ……..……... (2)
GT boat variable is the index result againt the GT boat with the geometric formula index (Susilowati, 1998):
business calculated from the sum of elasticity coefficient of the physical input that is IGT boat, Lnlenght of trip, Lndiesel fuel, Lnwide of net, Ln engine capacity, Lnnumber of crew and Lnlight.
usaha perikanan jaring cumi dihitung dari penjumlahan koefisien elastisitas input fisik yaitu IGT kapal, Lnlama trip, LnBBM Solar, LnLuas.Jr, LnPK mesin, LnJml ABK dan LnLampu. Sistematically formulated :
Scenario I
∑bi physical = b1 + b2 + b3 + b4 + b5 + b6 + b7
……....………..……….…... (4) Explanation :
b1 = Elasticity coefficient of IGT boat
b2 = Elasticity coefficient of Lnlenght of trip
b3 = Elasticity coefficient of Lndiesel fuel
b4 = Elasticity coefficient of Lnwide of net
b5 = Elasticity coefficient of Lnengine capacity
b6 = Elasticity coefficient of LnLight
b7 = Elasticity coefficient of Lnnumber of crew
Cost and Return feasibility analysis of squid net fishery conducted by Revenue-Cost (R/C ratio) analysis. Revenue-Cost (R/C ratio) analysis is the comparation between total revenue and total cost from a business. This analysis was conducted to analyze the business performance assessed through their business income. The calculation result of R/C ratio will
be known the probability
advantages/disadvantages and feasibility of fishery business run. Sistematically :
Profit () = TR – TC ... (5)
The criteria for the calculation results of R/ Cratio is :
if R/C ratio > 1, the business experiencing profit or feasible to develop.
if R/C ratio < 1, the business experiencing loss or not feasible to develop..
if R/C ratio = 1, the business on Break Event Point condition.
Revenue-Cost analysis (R/C ratio) conducted for each trip and made in two scenarios :
Scenario I : ideal scenario, where the entire cost of equipment depreciation is included as fix cost. In other words, the boat crews take responsibility to the entire depreciation cost.
Scenario II : scenario negotiation, where there are negotiations between the owner with of the boat crews to bear the depreciation cost of equipment. Based on the interview with the owner, the depreciation cost of equipment that become the boat crew responsibility is 16% from evenue after deducting operating expenses.
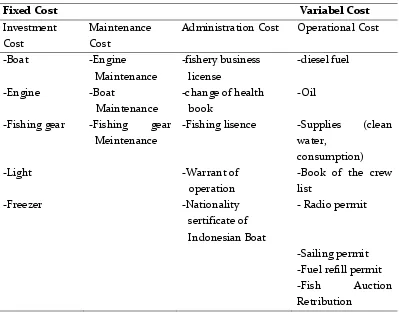
Table 2. Fixed and Variable Cost Component of Squid Net Fisheries Business
Fixed Cost Variabel Cost
Investment Cost
Maintenance Cost
Administration Cost Operational Cost
-Boat -Engine
Maintenance
-fishery business license
-diesel fuel
-Engine -Boat
Maintenance
-change of health book
-Oil
-Fishing gear -Fishing gear
Meintenance
-Fishing lisence -Supplies (clean
water,
consumption)
-Light -Warrant of
operation
-Book of the crew list
-Freezer -Nationality
sertificate of Indonesian Boat
- Radio permit
-Sailing permit -Fuel refill permit
-Fish Auction
Figure 1. Framework
RESULTS AND DISCUSSION
There are 4 village as domicile of squid net fisherman in Juwana Subdistrict Pati Regency that are Bakaran Kulon Village with total respondent 3 (N=3), Dukutalit Village N=5, Bajomulyo Village N=23 and Bendar Village N=5. As details, the respondent profil of squid net fisherman presented by Table 3.
The respondents age of squid net fisherman majority on the age of 51-60 years. Respondent with the age 30-40 years n=3, age 41-50 years n=9, age 51-60 years n=24 and none respondent on the age .60. The minimum age of respondent is 35 years, the maximum age of respondent is 57 years, the average age of respondent is 51.54 years with standard deviation 6.313 years.
The respondent education majority of squid net fisherman is primary school. Responden with primary education n=3, junior high school n=8, senior high school
n=5 and none respondent with bachelor education.
For fisherman experience on the range 0-10 years n=3, on the range 11-20 years n=17, on the range 21-30 years n=4, on the range 31-40 years n=10 and on the range . 40 years n=2. The minimum fisherman experience is 10 years, the maximum fisherman experience 45 years, the average fisherman experience is 22.29 years with standard deviation 10.916 years.
Production Function Analysis
Table 3. Respondent Profil of Squid Net Fisherman in Juwana Subdistrict Pati Regency
Number Explanation
Bakaran Kulon Village
Dukutalit Village
Bajomulyo
Village Bendar Village
1 Total 3 5 23 5
2 Age
Minimum Maximum Mean Std. Deviation
35 57 51,54 6,313
Details
30-40 years 0 1 1 1
41-50 years 0 2 4 3
51-60 years 3 3 2 16
> 60 years 0 0 0 0
3 Education
Primary School 0 2 18 3
Junior High
School 3 1 3 1
Senior High
School 0 2 1 2
Bachelor
4 Fisherman Experience
Minimum Maximum Mean Std. Deviation
10 45 22,29 10,916
Details
0-10 years 0 2 1 0
11-20 years 0 1 14 2
21-30 years 0 0 3 1
31-40 years 3 4 2 1
> 40 years 0 0 1 1
Sumber : Data Processing (2016), Mulyono et al (2012) with modification.
Table 4. Estimation of Cobb-Douglas Function of Sqiud Net Fisheries Business in Juwana Subdistrict Pati Regency
Variable Coefficient t-count Sig.
(Constant) IGT_Boat
Lnlength_of_Trip Lndiesel_Fuel Lnwide_of_Net Lnengine_Capacity Lnconsumption Lnnumber_of_Crew Lnlight
7.842 1.548 -0.725 0.446 0.035 -0.018 0.165 -1.987 0.470
3.448 0.994 -6.521 4.707 0.267 -0.279 1.752 -4.348 2.541
0.002 0.329 0.000 0.000 0.791 0.782 0.091 0.000 0.017 R-square
F count
Sig. F count
-Matrix of Correlation Coefficient Conclution
Estimation of Cobb-Douglas Function of Sqiud Net Fisheries Business in Juwana Subdistrict Pati Rgency is :
𝐿𝑛𝑃𝑟𝑜𝑑𝑢𝑐𝑡𝑖𝑜𝑛 = 𝐿𝑛 7.842 Douglas production function have positive and negative value indicates that the model is not in a normal condition that is a trend towards the production function is already saturated.
The reliability test of the model or the feasibility test of the model or more popularly known as the F test (some call a simultaneous test model) is an initial stage identifies the estimated regression model is feasible or not. Feasible on question is the estimated feasible model used to explain the
influence of independent variables on the
dependent variable (Iqbal, 2015). The
calculations show that the value of F calculated probability is 0.000 (see Table 14) so that it can be said that the regression model estimated worth it because the probability value <0.05.
The determination coefficient explaining the variation of independent variables influence to dependent variable or can be said as whole proportion of the influence of independent variables on the dependent variable. The determination coefficient can be measured by the value of R-Square (Iqbal, 2015). In the calculation, the value of R-Square (total of the independent variable is 8) is 0.819 (see Table 14). This shows that the proportion between the influence of the independent variables of 81.9%. Thus, 18.1% of squid net fisheries business in Juwana Subdistrict Pati regency is influenced by other factors outside the IGT boat, length of trip, Diesel Fuel, wide of net, machine capacity, consumption, number of crew and lights. Other factors that may be influential factor is the season.
Fishery Production Function
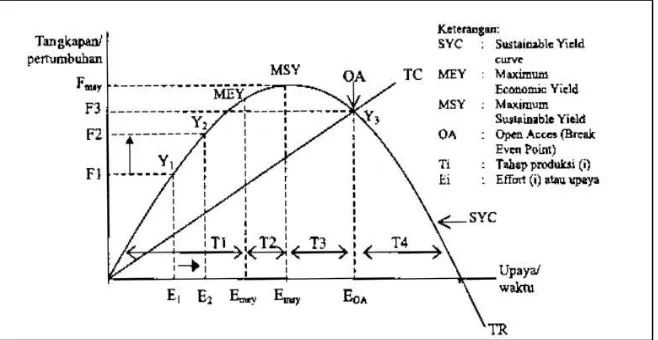
relationship between the catch and effort, whereas in the long term is a connection between catching and the average of catching that can be obtained at any particular time without affecting fish stocks.
Based on production teory, there are 4 stages of natural resources production seen from the number of input use. Stage I, production to achieve maximum economic
profits (Maximum Economic Yield/MEY).
Stage II, production to achieve maximum physical production (Maximum Sustainable
Yield/MSY). Stage III, production that does
not earn a profit or loss (break even point or
open acsess). Stage IV, loss production
(Susilowati, 2006).
Based on Susilowati (2006), if the production of a resource is located at the first stage it can be said that the resource is still in the stage of the glory economically, because it can provide additional results that increasing with the increasing of production input. When production is in stage II, with more and more use of inputs this resource will provide diminishing returns. When production started to go in stage III and IV, would have law of diminishing return when added the production inputs, the production
behavior occurs on all natural resources, including fisheries. The relationship between
the Maximum Economic Yield (MEY),
Maximum Sustainable Yield (MSY) and Open Access Equilibrium (OAE) is shown in Figure 2.
When the resources use overexploited, the level of production will be in the range of late stage II and stage III (mature production). In stage III, production is already experiencing saturated so the input addition will reduce the output (Susilowati, 2006). Squid net fisheries business in Juwana Subdistrict, the production levels are in the range of late stage II and stage III. It is characterized by the coefficient of production inputs that there are positive and negative. Some production input coefficients seen opposite each other, eg. lenght of trip input coefficient is negative, Diesel Fuel coefficient is positive and engine capacity coefficient is negative. If the condition is in stage I, the third productin input will be positive or proportional. It also happens to consumption coefficient and the number of crew coefficient. Thus, it can be said that the status of squid net fisheries business in Juwana Subdistrict Pati Regency is located at the transition of stage II to stage III or begin to decline in production.
Figure 2. The relationship between the Maximum Economic Yield (MEY), Maximum Sustainable Yield (MSY) and Open Access Equilibrium (OAE)
The model interpretation conducted after the classic assumption test and the feasibility of the model. It is because, First, the classic assumption test ensure that the minimum requirements of a linear regression model has been met so that will not cause an error in the fulfillment of assumptions. Second, the feasibility test ensure that a linear regression model estimated is worth explaining the influence of the independent
variable on the dependent variable.
Interpretation of squid net fisheries business model in Juwana Subdistrict Pati Regency are:
a). LnSquid net fisheries business production The constant is 7.842, means if the value of the independent variable is assumed to be 0, then the value of squid net fisheries production amounted to 7.842 kg.
b). IGT Boat business of 1.548%. The addition of the boat size (GT boat) will likely increase the number of production because the available of larger storage space. However, IGT boat input not significant (Sig. 0.329) against the squid net fisheries business production.
c). Lnlenght of trip
The coefficient for lenght of trip input is -0.725. This means that if the use of lenght of trip input increased 1% (ceteris paribus conditions) will result in an decrease in production output of squid net fisheries business of 0.725%. The addition of lenght of trip will likely decrease the number of production. This happens because the fishing area will be exploited even more so in the long run the amount of the stock will be reduced so that production will decline.
These conditions indicate the squid net fisheries business in Juwana Subdistrict are in a transition of stage II to stage III. lenght of trip input is significant (Sig. 0,000) to the production of squid net fisheries business. d). Lndiesel fuel
The coefficient for diesel fuel input is 0.446. This means that if the use of diesel fuel input increased 1% (ceteris paribus conditions) will result in an increase in production output of squid net fisheries business of 0.446%. The addition of diesel fuel will likely increase the number of production, however this applies to short-term, as they relate to the availability of fish stocks. These conditions indicate the squid net fisheries business in Juwana Subdistrict are in a transition of stage II to stage III. The diesel fuel input is significant (Sig. 0,000) to the production of squid net fisheries business. e). Lnwide of net
The coefficient for wide of net input is 0.035. This means that if the use of wide of net input increased 1% (ceteris paribus conditions) will result in an increase in production output of squid net fisheries business of 0.035%. The addition of wide of net will likely increase the number of production, however this influenced by the availability of fish stocks. If there had been over-exploitation, the production will still fall despite to the wide of net addition. The wide of net input is not significant (Sig. 0,791) to the production of squid net fisheries business. f). Lnengine capacity
relating to the availability of fish stocks, the squid net fisheries businesses in Juwana Subdistrict in production conditions that are in a transition stage II to stage III. The engine capacity input is not significant (Sig. 0,782) to the production of squid net fisheries business.
g). Lnconsumption
The coefficient for consumption input is 0.165. This means that if the use of consumption input increased 1% (ceteris paribus conditions) will result in an increase in production output of squid net fisheries business of 0.165%. The addition of consumption will likely increase the number of production because extend the lenght of trip. However, this conditions only happens in short-term because long of lenght of trip will decrease production. This conditions indicate the squid net fisheries businesses in Juwana Subdistrict in production conditions that are in a transition stage II to stage III. paribus conditions) will result in an decrease in production output of squid net fisheries business of 1.987%. Too many crew will make fishing activity becomes inefficient and can slow down the work process due to difficulties in coordination. In addition, the
region has occurred overexploitation
although the amount of crew have been added the production will continue to decline. This conditions indicate the squid net fisheries businesses in Juwana Subdistrict in production conditions that are in a transition stage II to stage III. The number of
crew input is significant (Sig. 0,000) to the production of squid net fisheries business. i). Lnlight
The coefficient for light input is 0.470. This means that if the use of light input increased 1% (ceteris paribus conditions) will result in an increase in production output of squid net fisheries business of 0,470%. Increasing the number of light will likely increase the number of production because squid net fishing gear rely on the lighting in the cathcing process. However, if the fishing area has occurred overexploitasi precisely the number of production will decrease. This conditions indicate the squid net fisheries businesses in Juwana Subdistrict in production conditions that are in a transition stage II to stage III. The light input is significant (Sig. 0,017) to the production of squid net fisheries business.
Return To Scale
The return to scale value of the squid net fisheries business in Juwana Subdistrict Pati Regency for Plan A : decreasing returns to scale, because the value of returns to scale less than 1. The condition of squid net fisheries business at the research time was at the term of decline in production, it is thought to be caused due to the over-exploitation of fish resources in the fishing area for squid net boat.
Cost and Return Feasibility Analysis
made in two scenarios : 1) Scenario I is ideal scenario, where the entire cost of equipment depreciation is included as fix cost. In other words, the boat crews take responsibility to the entire depreciation cost. 2) Scenario II is negotiation scenario, where there are negotiations between the owner with of the
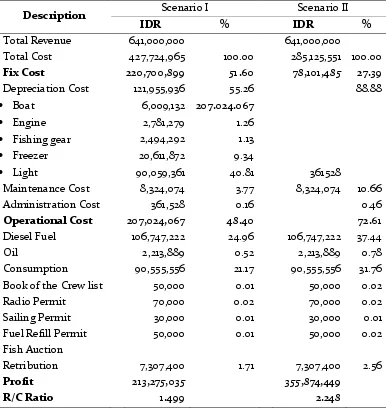
a) Revenue-Cost Ratio Analysis (R/C Ratio) Peak Season
Finansial feasibility analysis of squid net fisheries business in Juwana subdistrict Pati Regency were calculated by Revenue-Cost Ratio (R/C ratio) calculation. The Revenue-Cost Ratio calculation of squid net fisheries business in Juwana Subdistrict with Scenario I and Scenario II presented by Table 5. Based on the calculation result on Table 5, shows that the squid net fisheries business on peak season from scenario I experience the profits or worthy to be developed with R/C ratio 1.499. This R/C ratio also show that every expences of IDR 1,000 will earn revenue IDR 1,499. R/C ratio > 1 also show that this business already efficient. For scenario II experience the profits or worthy to be developed with R/C ratio 2.248. This R/C ratio also show that every expences of IDR 1,000 will earn revenue IDR 2,248. R/C ratio > 1 also show that this business already efficient (Sari, 2011).
The business profit earned per trip for peak season based on scenario I is IDR 213,275,035 while the business profit earned per trip for peak season based on scenario II is 355,874,449. This profit, will be shared by the sharing system between the owner and the crew. It because the crew wage for squid
net fisheries business in Juwana Subdistrict Pati regency performed by the sharing system. The sharing system details are 45% for the owner and 55% for the crew. The crew also has the details for nahkoda 2 portion from 55%, the mechanics 1.5 portion from 55% and the regular crew 1 portion from 55%.
The calculation result of the sharing system scenario I is the owner of squid net boat obtaining IDR 95,973,766 and the crew obtaining IDR 117,301,269. The crew portion then divided to each crew. If the average number of the squid net boat crew is 10 person with details 1 person is nahkoda, 2 peson are 3,258,369. Scenario II, the calculation of sharing system is the owner obtaining IDR 160,143,502 and the crew obtaining IDR 195,730,947. After being calculated, it show that wages per month for nahkoda IDR 10,873,941; wages per month for mechanics IDR 8,155,456; and wages per month for regular crew IDR 10,873,941.
Based on the interview result, the average of the crew household expences is IDR 1,800,000. Therefore, for peak season scenario I and scenario II, the revenue which is obtained by the squid net boat crew has been able to meet the needs of the crew household expences. Beside that, if seen from Regional Minimum Wage of Pati Regency in 2015 that is IDR 1,176,000/month, then the revenue of the squid net boat crew for the peak season has exceeded the specified Regional Minimum Wage.
b) Analisis Revenue-Cost Ratio (Rasio R/C) Musim Biasa
Table 5. R/C Ratio Calculation for Squid Net Fisheries Business at Peak Season
Description Scenario I Scenario II
IDR % IDR %
Total Revenue 641,000,000 641,000,000
Total Cost 427,724,965 100.00 285,125,551 100.00
Fix Cost 220,700,899 51.60 78,101,485 27.39
Depreciation Cost 121,955,936 55.26
361528
88.88
Boat 6,009,132 207.024.067
Engine 2,781,279 1.26
Fishing gear 2,494,292 1.13
Freezer 20,611,872 9.34
Light 90,059,361 40.81
Maintenance Cost 8,324,074 3.77 8,324,074 10.66
Administration Cost 361,528 0.16 0.46
Operational Cost 207,024,067 48.40 72.61
Diesel Fuel 106,747,222 24.96 106,747,222 37.44
Oil 2,213,889 0.52 2,213,889 0.78
Consumption 90,555,556 21.17 90,555,556 31.76
Book of the Crew list 50,000 0.01 50,000 0.02
Radio Permit 70,000 0.02 70,000 0.02
Sailing Permit 30,000 0.01 30,000 0.01
Fuel Refill Permit 50,000 0.01 50,000 0.02
Fish Auction
Retribution 7,307,400 1.71 7,307,400 2.56
Profit 213,275,035 355,874,449
R/C Ratio 1.499 2.248
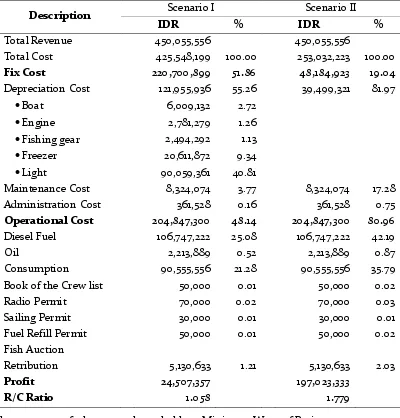
The calculation result on Table 6, shows that the squid net fisheries business on regular season from scenario I experience the profits or worthy to be developed with R/C ratio 1.058. This R/C ratio also show that every expences of IDR 1,000 will earn revenue IDR 1,058. R/C ratio > 1 also show that this business already efficient. For scenario II experience the profits or worthy to be developed with R/C ratio 1.779. This R/C ratio also show that every expences of IDR 1,000 will earn revenue IDR 1,779.
The business profit earned per trip for regular season based on scenario I is IDR 24,507,357. The calculation result of the
sharing system scenario I is the owner of squid net boat obtaining IDR 11,028,311 and the crew obtaining
IDR 13,479,046. The wages per month for nahkoda IDR 748,836; wages per month for mechanics IDR 561,627; and wages per month for regular crew IDR 374,418. For scenario II, the business profit earned per trip IDR 197,023,333. The calculation of sharing system is the owner obtaining IDR 88,660,500 and the crew
obtaining IDR 108,362,833. After being
Table 6. R/C Ratio Calculation for Squid Net Fisheries Business at Regular Season
Description Scenario I Scenario II
IDR % IDR %
Total Revenue 450,055,556 450,055,556
Total Cost 425,548,199 100.00 253,032,223 100.00
Fix Cost 220,700,899 51.86 48,184,923 19.04
Depreciation Cost 121,955,936 55.26 39,499,321 81.97
Boat 6,009,132 2.72
Engine 2,781,279 1.26
Fishing gear 2,494,292 1.13
Freezer 20,611,872 9.34
Light 90,059,361 40.81
Maintenance Cost 8,324,074 3.77 8,324,074 17.28
Administration Cost 361,528 0.16 361,528 0.75
Operational Cost 204,847,300 48.14 204,847,300 80.96
Diesel Fuel 106,747,222 25.08 106,747,222 42.19
Oil 2,213,889 0.52 2,213,889 0.87
Consumption 90,555,556 21.28 90,555,556 35.79
Book of the Crew list 50,000 0.01 50,000 0.02
Radio Permit 70,000 0.02 70,000 0.03
Sailing Permit 30,000 0.01 30,000 0.01
Fuel Refill Permit 50,000 0.01 50,000 0.02
Fish Auction
Retribution 5,130,633 1.21 5,130,633 2.03
Profit 24,507,357 197,023,333
R/C Ratio 1.058 1.779
The average of the crew household expences is IDR 1,800,000. Therefore, for regular season scenario I the revenue that earned by the squid net crew can not meet the needs of household expences per month of each squid net crew. Beside that, if the Regional Minimum Wage of Pati Regency in 2015 is IDR 1,176,000/month, then the revenue of the squid net boat crew in regular season is under the Regional Minimum Wage standard so that the squid net boat crew welfare is low. It’s different with scenario I, in scenario II regular season the squid net boat crew already meet the needs of the squid net boat crew household expences per month and has surpassed the Regional
Minimum Wage of Pati regency.
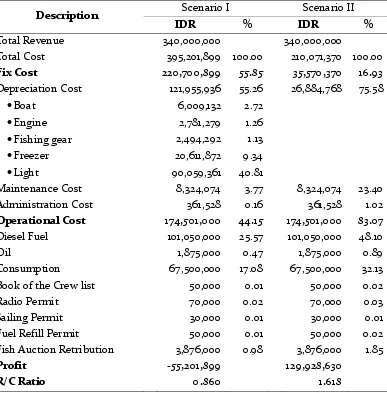
C) Revenue-Cost Ratio (R/C Ratio) Analysis bad Season
Table 7. R/C Ratio Calculation for Squid Net Fisheries Business at Bad Season
Description Scenario I Scenario II
IDR % IDR %
Total Revenue 340,000,000 340,000,000
Total Cost 395,201,899 100.00 210,071,370 100.00
Fix Cost 220,700,899 55.85 35,570,370 16.93
Depreciation Cost 121,955,936 55.26 26,884,768 75.58
Boat 6,009,132 2.72
Engine 2,781,279 1.26
Fishing gear 2,494,292 1.13
Freezer 20,611,872 9.34
Light 90,059,361 40.81
Maintenance Cost 8,324,074 3.77 8,324,074 23.40
Administration Cost 361,528 0.16 361,528 1.02
Operational Cost 174,501,000 44.15 174,501,000 83.07
Diesel Fuel 101,050,000 25.57 101,050,000 48.10
Oil 1,875,000 0.47 1,875,000 0.89
Consumption 67,500,000 17.08 67,500,000 32.13
Book of the Crew list 50,000 0.01 50,000 0.02
Radio Permit 70,000 0.02 70,000 0.03
Sailing Permit 30,000 0.01 30,000 0.01
Fuel Refill Permit 50,000 0.01 50,000 0.02
Fish Auction Retribution 3,876,000 0.98 3,876,000 1.85
Profit -55,201,899 129,928,630
R/C Ratio 0.860 1.618
The business loss earned per trip for bad season based on scenario I is IDR 55,201,899. Therefore, for bad season the squid net crew will not generate revenue but suffered a loss because of the income from the catch are not able to cover the costs incurred, so scenario I can not be applied to the squid net fisheries business in a bad season because the business is run will suffer losses. Meanwhile for scenario II, the profit that obtained per trip for bad season is IDR 129,928,630. The calculation result of the sharing system are the owner obtaining IDR 58,467,884 and the crew obtaining IDR 71,460,747. After being calculated, it show that wages per month for nahkoda IDR
3,970,041; wages per month for mechanics IDR 2,977,531; and wages per month for regular crew IDR 1,985,021.
in the regular season where the scenario II revenue that the crew earned is greater than in the first scenario, because the profit of scenario II were divided for the crew better than the first scenario (refer Table 6).
In contrast to the first scenario that experience loss (Table 7), at scenario II bad season experience profit (Table 7). Therefore, the crew already meet the needs of household expences and already surpassed the Regional Minimum Wage of Pati regency.
CONCLUSIONS
From these results, there are several conclusions, among others ; there is influence between the production factors on squid net fisheries business in Juwana Subdistrict Pati regency. Some input that would significantly influence the fishing effort that are lenght of trip, diesel fuel, number of crew and lights.
The Return to scale value of squid net fisheries business is -0.231. This indicates that there is decreasing to scale condition. This Douglas Production Function. International Journal of Research in Business Studies and Management, Vol 2 (5) : 32-33.
Anderson, L. G. 1986. The Economic of Fisheries Management. USA :The John Hopkins University.
Statistics Agency of Pati Regency. 2013. Pati In Figures 2012. Pati.
. 2014. Pati In Figures 2013. Pati.
Statistics Agency of Central Java Province. 2014. Central Java In Figures 2013. Semarang.
Marine and Fisheries Agency of Pati Regency. 2014. Fishing gears Data of Boats Machine 10-30 GT In Pati Regency. Pati.
Felipe, J and F. G. Adams. 2005. A Theory of Production, The Estimation of The Cobb-Douglas Function : A Retrospective View. Eastern Economic Journal, Vol 31 (3) : 427-445.
Ghozali, I. 2006. Multivariate Analysis Aplication with SPSS Program. Agency Publisher of Diponegoro University, Semarang.
Hajkova, D. and J. Hurnik. 2007. Cobb-Douglas Production Function : The case of a Converging Economy.
Czech Journal of economics and Finance, Vol 57 (9-10) : 465-476.
Hossain, Md. M., T. Basak and A. K. Majumder. 2013. Application of Non-Linear Cobb-Douglas Production Function With Autocorrelation Problem to Selected Manufacturing Industries in Bangladesh. Open Journal of Statistics, Vol 3 : 173-178.
Iqbal, M. 2015. Data Processing with Multiple Linear Regression (with SPSS). Jakarta : Perbanas Institute Jakarta.
Marine and Fisheries Ministry of Indonesia Republic. 2015.
Marine and Fisheries In Figures 2014. Jakarta. Mulyono, S. E., W. Waridin and I. Susilowati. 2012. Poverty
Alleviation In Municipality Of Semarang, Central Java-Indonesia : With Special Reference To Young Unemployed People Target. WEI International Academic Conference Proceedings. Zagreb, Croatia. Nelwan A. F. P., Susaniati W and Kurnia M. 2012.
Produktivity of Step on Boat Regional Fishing with different Distances From the Beach In Jeneponto Regency Waters. Jurnal Akuatika, Vol 4 (1) : 68-79. Nugroho, B. A., 2015. Production Function Analysis Fungsi
and Corn Efficiency In Patean Subdistrict Kendal Regency.Jurnal JEJAK, Vol 8 (2) : 163-177.
Agriculture Department Agriculture Faculty. Medan : North Sumatera University.
Marine and Fisheries Ministry of Indonesia Republic Regulation Number 2 of 2015 About Prohibition of the use of Trawls and Seine Nets Fishing Fishing gears In Regional Fisheries Management of Indonesia Republic. 2015 multiplied by Indonesia Republic.
Primyastanto, M., Soemarno and A. Efani. 2014. Study of Cobb-Douglas Function on Payang Catch Tools at Madura Strait. Australian Journal of Basic and Applied Sciences, Vol 8 (10) : 421-426. Purnomo, A. 2012. Efficiency Analysis and Purse Seine
Boat Productivity In sibolga. Unpublished Thesis. Postgraduated Program. Semarang : Diponegoro University.
Putra, S. E. 2013. Sustainable Fish Cathcing Business Analysis on Climate Change Conditions. Unpublished Thesis. Master of Economics and Development Study. Semarang : Diponegoro University.
Ramadhan, H., D. Wijayanto and Pramonowibowo. 2016. Technical Analysis and Fisheries Economical of Boat Lift Net In Coastal Fishing Port of Morodemak, Demak Regency. Journal of Fisheries Resources Management and Technology, Vol 5 (1) : 170-177.
Sari, K. M. 2011. Salted Fish Business Analysis In Cilacap Regency. Unpublished. Social Economic Agriculture Majoring Agribusiness Agriculture Study Program Agriculture Faculty. Surakarta : Sebelas Maret University.
Suharso, A. N. Bambang and Asriyanto. 2006. Elasticity of Fish Cathcing Production In Tegal District. Jurnal Pasir Laut, Vol 2 (1) : 26-36.
Susilowati, I. 1998. Economics of Regulatory Compliance In The Fisheries Of Indonesia, Malaysia And The Philippines. Unpublished Dissertation. Doctor Of Philosophy. Kuala Lumpur : Universitas Putra Malaysia.
. 2006. Alignment In the Utilization and Management of Fisheries Resources For People and the Environment. Speech Inauguration of Economics Faculty. Semarang : Diponegoro University.
Wardhani, R. K., Ismail and A. Rosyid. 2012. Boat Seine Fishing Gear Business Analysis In Coastal Fishing Port of Tawang Kendal Regency. Journal of Fisheries Resources Utilization Management and Technology, Vol 1 (1) : 67-76.