Changes in frozen ground in the Source Area of the Yellow River on the Qinghai–Tibet
Plateau, China, and their eco-environmental impacts
This content has been downloaded from IOPscience. Please scroll down to see the full text.
Download details:
IP Address: 221.10.102.199
This content was downloaded on 06/10/2013 at 02:47
Environ. Res. Lett.4(2009) 045206 (11pp) doi:10.1088/1748-9326/4/4/045206
Changes in frozen ground in the Source
Area of the Yellow River on the
Qinghai–Tibet Plateau, China, and their
eco-environmental impacts
Huijun Jin, Ruixia He, Guodong Cheng, Qingbai Wu,
Shaoling Wang, Lanzhi L ¨u and Xiaoli Chang
State Key Laboratory of Frozen Soils Engineering, Cold and Arid Regions Environmental and Engineering Research Institute, Chinese Academy of Sciences, 326 West Donggang Road, Lanzhou 730000, People’s Republic of China
E-mail:[email protected] Received 26 June 2009
Accepted for publication 20 October 2009 Published 23 November 2009
Online atstacks.iop.org/ERL/4/045206
Abstract
The Source Area of the Yellow River is located in the mosaic transition zones of seasonally frozen ground, and discontinuous and continuous permafrost on the northeastern Qinghai–Tibet Plateau. Vertically, permafrost is attached or detached from frost action. The latter can be further divided into shallow (depth to the permafrost table8 m), deep (>8 m) and two-layer permafrost. Since the 1980s, air temperatures have been rising at an average rate of
0.02◦
C yr−1. Human activities have also increased remarkably, resulting in a regional
degradation of permafrost. The lower limit of permafrost has risen by 50–80 m. The average maximum depth of frost penetration has decreased by 0.1–0.2 m. The temperatures of the suprapermafrost water have increased by 0.5–0.7◦
C. General trends of permafrost degradation include reduction in areal extent from continuous and discontinuous to sporadic and patchy permafrost, thinning of permafrost, and expansion of taliks. Isolated patches of permafrost have either been significantly reduced in areal extent, or changed into seasonally frozen ground. Degradation of permafrost has led to a lowering of ground water levels, shrinking lakes and wetlands, and noticeable change of grassland ecosystems alpine meadows to steppes. The degradation of alpine grasslands will cause further degradation of permafrost and result in the deterioration of ecological environments as manifested by expanding desertification and enhancing soil erosion.
Keywords:Source Area of the Yellow River (SAYR), frozen ground, cold regions ecology, degradation, environmental impacts
1. Introduction
Frozen ground plays a critical role in global thermal, water and carbon budgets. Under a changing climate, permafrost dynamics and ecological environments are undergoing rapid and remarkable changes. It is increasingly evident that frozen ground is affected by climate warming. This is manifested in rising ground temperatures and declining areal extents and thickness of permafrost [1–4]. They directly and indirectly
4
The Yellow, Yangtze and Lancang/Mekong Rivers, the so called ‘Three Rivers’, originate on the northeastern QTP. It is seasonally affected by southeast and south monsoons, and by the dry winds from Central Asia. The vegetation varies from subtropical forests in the southeast to alpine deserts in the west, but generally much of the Plateau is a pastoral landscape.
Permafrost on the QTP has been of much interest to geocryologists, engineers and environmental scientists for 50 years. The total area of permafrost is estimated to be 1.3–1.6 million km2. The existing permafrost was formed during the last two major glaciations [9]. During the Holocene, several periods of permafrost development and partial decay occurred. Permafrost along the QTP peripheries, including the Source Area of the Yellow River (SAYR), has been more sensitive to climate changes due to its delicate thermal balance and the strong monsoon influence in comparison with those in the interior.
Since the 1970s, the climate warming and a sharp increase in human activities, such as overgrazing of increasing cattle herds, and imprudent utilization of wetlands, pasturelands and water resources, have resulted in a general degradation of frozen ground as evidenced by rising ground temperatures, increased thaw depths, thinning permafrost, reduction of areal extent and increasing fragmentation of permafrost distribution [5, 9, 10]. These have resulted in adverse changes in cold regions environments [11]. On the other hand, degraded grasslands accelerate the rates of change in soil temperatures and moisture contents in the active layer because of declining vegetative coverage [12]. In turn, this increases soil temperatures and reduces soil moisture contents, and further degrades the permafrost.
Driving forces of regional environmental changes include natural causes, such as climate warming, permafrost degradation, increased rodent and insect activities, and anthropogenic causes, such as imprudent exploitation of water, soils, fauna and flora resources for short-term economic benefits. Permafrost degradation, however, is one of the most important factors in accelerating ecological changes [10,13,14].
In the SAYR, continuous, discontinuous, sporadic, and isolated patches of permafrost, as well as seasonally frozen ground, are mosaic with frequent transitions. During the past few decades, degradation of grassland ecosystems was persistent, and land desertification accelerated [10,15]. For example, the rate of degradation of grasslands in Madoi county doubled during the 1980s compared with the 1970s when the degradation was first observed. Since 1973, the grassland degradation has increased by 2.6% yr−1, and the
land desertification at an annual average rate of 1.83%. By 1998, about 2.414×10⁵km2of grasslands were degraded [14].
Grass productivity declined by 30–80%, and the quality of the grasslands also deteriorated.
During the early 1950s, the SAYR was surveyed for economic planning and the project of water diversion from the Yangtze River to the Yellow River. A comprehensive expedition organized by Qinghai Provincial Government in 1978 resulted in a large amount of relevant data. Specialized investigations were carried out from the 1970s to the 2000s.
They resulted in a 1:500 000 permafrost distribution map for the areas to be affected by the water diversion project [13]. During 2001–2004, 1:250 000 surveys of the ecological environmental geology in the SAYR were completed [14]. In this paper, distributive features of frozen ground and development trends, and their resultant and potential ecological and environmental impacts, are analyzed and discussed on the basis of these data.
2. Study region
2.1. Topography and geomorphology
The SAYR (33◦56′–35◦31′N, 95◦55′–98◦41′E, elevation 4100– 5442 m asl) encompasses the catchment area above Duoshixia (34◦
E; 4222 m asl) along the Yellow River, with a total catchment area of 2.5×10⁴km2(figure1).
It is bordered by the Bayan Har Mountains in the south, by the Buqing Mountains in the north, and by the Geshigeya Mountains in the west. The SAYR slopes SE, and is interspaced with numerous rugged mountains and hills, valleys and intermontane basins, lakes, rivers and high plains. The elevations increase rapidly northwards and southwards at the edges of the SAYR, and it rises gently westwards until the water divide at the Geshigeya Mountains is reached.
Tectonic structures, active faults in particular, which run generally in a NW–SE direction, determine the regional topography. Surrounded by NW–SE trending mountains, the SAYR includes the Gyaring and Ng¨oring (Sisters) Lakes and the Yellow River floodplains with flat topography and meandering river channels. Aeolian sand lands, dunes, and depressions are generally distributed in the areas between the south of Gyaring Lake and Mount Mianshanling. The circum-lake hills are gentle, and river valleys are wide and shallow.
2.2. Hydrology
The SAYR includes numerous meandering rivers and braided streams of the Yellow River. The majority of them are on the southern banks of the Yellow River, and the catchment areas and water supplies are asymmetrical. According to data from Huang’he’yan (Yellow Riverside) Hydrological Station (34◦53′07.09′′N, 98◦10′18.84′′E; 4215 m asl, with a catchment area of 20 930 km2) near Madoi, the 1955–2005 average flow is 22.61 m3 s−1, and the average annual discharge is
7.13×10⁸m3[16].
There are many lakes, such as the Sisters Lakes, Galala Co, Xingxinghai and Xingxiuhai lake clusters. Most of the lakes discharge freshwater to rivers. The Ng¨oring Lake (34◦46′–35◦05′N, 97◦32′–98◦54′E, 4266–4267 m asl) is the largest. In 2000, the water surface area was 610.7 km2, and the average water depth was 17.6 m, with the
greatest depth of 34.7 m and an estimated water storage of 10.76 × 10⁹ m3. The Gyaring Lake (34◦
4
Figure 1.Topography, permafrost and boreholes in the SAYR.
Table 1. Meteorological features in the sources area of the Yellow River [17]. Average air temp.(◦C
) Annual average Station
Long. (E)
Lat. (N)
Elev.
(m) Ann. Jan. Jul. Ann. range
Frost-free days (d)
Precip. (mm)
Evap. (mm)
Sunshine (h)
Insol.
(MJ m−2 ) Notes Madoi 98◦
13′
34◦
55′
4272 −4.0 −16.0 7.5 23.5 18 313 1351 2717 6474 Modoi 1995–2005 Ng¨oring L.
hydrol. st.
97◦45′ 35◦05′ 4273 −4
.5 −17.1 7.6 24.7 19 340 1065 2685 6534 N bank of Nyoring L. 1985–1989 Duoqu 97◦
21′
34◦
48′
4285 −4.0 −16.5 7.1 23.6 17 363 1045 2650 6500 S outlet of Gyaring L. 2000–2001 Yeniugou 97◦
58′
34◦
29′
4370 −4.2 −16.9 7.8 24.7 335 2799 6787 2000–2001 Maduo
village
96◦22′ 35◦02′ 4450 −4
.3 −17.5 7.6 25.1 16 376 1528 2702 6568 2000–2001
local microclimate. However, the lake water levels have been sinking.
2.3. Climate
The climate is semi-arid alpine (table 1). The mean annual air temperatures (MAATs) are lower than −4◦C, with 15– 20 frost-free days in a year. The lakes and rivers freeze up for more than seven months in a year. There is no clear division of seasons, but diurnal variations of temperatures are large. Solar radiation is strong throughout the year, with annual total sunshine hours varying between 2500 and 2800 h and insolation from 6400 to 6800 MJ m−2[17].
The annual precipitation varies between 300 and 400 mm, and is mainly in the form of rain storms or snow/hailstones.
There are clear differences between the dry and wet seasons; much of the precipitation (70–80%) falls in the warm seasons. The cold seasons are dry, with prevailing westerly winds. The annual average evaporation is about 1000–1500 mm. The average rate of decrease in precipitation was 25 mm yr−1
during 1980–2000 [16], often occurring in the warm seasons.
2.4. Soils and vegetation
4
generally gravelly, sandy and prone to erosion and the organic content to decomposition. However, in the river plains at about 4200 m asl, aeolian erosion is pronounced and exposed ground surfaces are prone to wind action. Aeolian sandy soils are abundant. Paludal soils are developed in lowlands and depressions.
The vegetation is dwarfed and herbaceous, and dominated by paludal and typical alpine meadows and steppes. In some upper mountains, sparse vegetation consists of spotty cushion vegetation, such as Androsace tapete and Arenaria pulvinata. Pioneering species are generally encountered on the screes or protaluses. The vegetation in the alpine steppes consists mainly of perennial and xerophytic thickets of Poe alpigena, Stipa purpurea, and Agropyron cristatum
and is present in wide intermontane valleys, fluvial and alluvial fans, and river or lake terraces at 4300–4600 m asl. Alpine meadows consisting mainly of species of Kobresia pygmaea, K. humilis, K. capillifolia, K. tibetica, K. prattii,
and K. kansuensisare present in lowlands, wide valleys and flat mountain tops. Paludal meadows mainly consist ofK. tibetica,
K. pygmaea, K. kansuensis, and Carex moorcroftii in the wetlands and valleys and on river terraces with standing water. Shrub-meadows consist mainly ofRhododendron thymifolium, Salix oritrepha, Spiraea alpina and Dasiphora fruticosa
on the Yellow River banks. At present, xerophilization, halophilization, and adaptation to sandy environments have become the leading trends in vegetation successions. Floristic structures become simple, and the vegetative coverage is declining. Phytocommunity biodiversity biomass and productivity have declined.
2.5. Socioeconomic environments
The SAYR includes the major portion of Madoi county and parts of Chendo and Q¨umalˆeb counties, with a population of about 70 000. The majority (70%) of the population are Tibetan, living by raising cattle. Husbandry has developed rapidly since the 1970s, with tripled total herds of 1107 500 heads of sheep or equivalent during the past 30 years. There are only a few salt farms, hydroelectric power plants, and resource-exploitative firms. In 2000, the total GDP of the SAYR reached 2.1×10⁸ yuan (about 2.5×10⁷ USD), with
annual disposable income of 1283 yuan (about 155 USD)
per capita. Basic energy, transportation and communications infrastructures have improved in recent years.
However, due to persistent increases in cattle herds, overgrazing has become a disturbing fact, and the livestock grazing is largely traditional nomadic in search of water sources and grasslands. In the lowlands, with generally good grasslands close to residential centers, frequent and concentrated grazing has damaged or suppressed the growth and reproduction of vegetation. This exploitative operation has accelerated degradation of grasslands.
3. Frozen ground
3.1. Distribution and types of frozen ground
Distribution of frozen ground and kinds of seasonal freeze– thaw processes are influenced by elevational climate zoning,
but they are made more complicated by lakes and rivers. The lower limit of permafrost varies between 4215 and 4400 m asl. Borehole data show the basic features of the frozen ground (table2) [14,18].
The SAYR has a mosaic of various types of frozen ground. East of the Ng¨oring Lake, only isolated patches of and sporadic permafrost and seasonally frozen ground are present at elevations lower than 4400 m in river valleys and basins with high soil moisture. For example, permafrost was present in boreholes ZK5 and ZK6 on river banks or lake shores, but permafrost was absent in borehole ZK7 on dry land. In particular, seasonally frozen ground is only present lower than 4250 m asl from Huang’he’yan to Duoshixia along the Yellow River, and the Requ and Hei’he Rivers, as shown in boreholes ZK4 and K8. Due to the increasing elevation westwards, southwards and northwards from the Sisters Lakes, there is a transition from lake shore taliks to isolated patches of permafrost and discontinuous permafrost, and continuous permafrost at elevations higher than 4400 m asl as shown in boreholes ZK7 and K8003. Taliks due to the thermal influences of lakes, rivers and active faults are as wide as 100–300 m, as revealed in borehole K3. Permafrost is often continuous on all slopes above 4400–4500 m asl, such as in the valleys along the Kariqu and Yueguzongliequ Rivers, with extensive presence of wetlands.
On the basis of borehole data (table 2), it appears that seasonally frozen ground and permafrost are interspaced from Madoi to Yeniugou along the G214. Isolated patches of permafrost generally occur under wetlands above 4250– 4400 m asl, and seasonally frozen ground generally occurs at dry locations. Madoi town is located on the middle and upper parts of a piedmont fluvial fan with a dry ground surface underlain by seasonally frozen ground. To the south, permafrost was found in boreholes ZK5 and K14 on the northern banks of the Yellow River and borehole K10 in Xiaoyemaling, but seasonally frozen ground was present in borehole K8 on the southern bank of the Yellow River and in borehole ZK4 on the north bank of the Hei’he River. Pit excavations also indicate that there is only seasonally frozen ground below 4250 m asl along the Hei’he River banks and at Yematan. Isolated patches of permafrost start to occur near Yeniugou (4370 m asl). Permafrost becomes continuous, and thicker above 4500 m asl For example, ground ice and permafrost are well developed from Chalaping (4800 m asl) to the Bayan Har Mountain Pass (4824 m asl) along the G214. As shown in a pit 1.3 m in depth, the permafrost table was at 0.8 m in September 1997, and a ground ice layer was found at depths of 0.8–1.3 m. Cuts for highway construction and maintenance revealed a 2 m thick ice layer immediately below the permafrost table in Chalaping. Glacial deposits and landforms such as U-shape troughs, nival and ice-scoured lakes, and periglacial manifestations of various types such as thermokarst lakes, pingos and palsas are present and on a larger scale than other sections of the highway [18,19].
4
Table 2. Features of frozen ground in the sources area of the Yellow River [14,18]. Permafrost layer
4220 88.97 1.2 10.0 Attached ZK6 N shore of the Ng¨oring L., 35◦
05′
97◦
46′
4272 200.80 1.5–8.0 6.5 Two-layer 123.9 m E of the fishery 19.81–24.26 4.45
ZK7 Huangjintai Valley N of Ng¨oring L.
35◦12′ 97◦43′ 4472 80.01 1.3 44.27 Attached
ZK8803 Slope toe 25 km N of Ng¨oring L.
35◦10′ 97◦42′ 4400 171.0 1.2 18.2
ZK8804 Interlake bar between the Ng¨oring L. and Wuming
4253 77.50 1.0–20.2 19.2 Attached No 9 E shore, Ayonggongma Co
L. No 10 Yellow R. valley at
Duoshixia K3 Sand bar between Nan Co
and Ng¨oring L.
4221 46.60 4.85–13.35 8.5 Detached K10 Xiao Yemaling 34◦
01′
98◦
08′
4294 91.85 8.05–10.40 2.35 ZK4 N bank of the Hei’he
R. along G214
into shallow (depth to present permafrost 8 m) and deep (>8 m), and two-layer permafrost. Along the G214, detached shallow permafrost is common. For example, it was found at three sites south of Madoi in the Yellow River valley, as well as in borehole No 3 on the northern shore of Xingxinghai south of the Yellow River, in borehole No 31 in Dayamaling, and in boreholes Nos 31, 47 and 49 south of the Hei’he River Bridge. In these areas, the permafrost table was generally detected at depths of 5–8 m, and it was less than 10 m in thickness. Sometimes, a lower layer of permafrost was encountered at depths below 17 m. For example, the lower layer of permafrost was at depths of 17–33 m in boreholes K2, K5, and ZK6 (table2) [9].
3.2. Temperature and thickness of permafrost
Although elevational zoning of permafrost thickness and temperature dominates, latitudinal zoning is also evident in spite of the frequent disruptions from the rugged terrains and other local factors such as surface water bodies, soil types, slope orientations, and vegetation coverage. Most of the boreholes in table 2 are in intermontane valleys and basins lower than 4600 m asl. Ground temperatures were only
measured in boreholes ZK5, ZK6, and ZK7 (figure 2). The thicknesses deduced from ground temperature measurements and local prevailing geothermal gradients agree well with those judged from on-site drilling cores (table2) [9].
The permafrost thickness increases with increase in elevation as shown in boreholes ZK6, ZK8803, and ZK7 on the northern shore of the Ng¨oring Lake. These three boreholes, about 35 km apart, are at similar geomorphic positions, with only a difference in elevation. The permafrost is 6.5 m thick in borehole ZK6 at 4272 m asl; 18.2 m in borehole ZK8003 at 4400 m asl; and 44.3 m in borehole ZK7 at 4472 m asl. The geo-electrical sounding on the northern slope of the Bayan Har Mountains also indicates that the permafrost thickness increases at an average rate of about 13–17 m (permafrost thickness) per 100 m rise in elevation. It is possible that permafrost thickness can exceed 100 m at elevations above 5000 m asl in the Bayan Har and Buqing Mountains.
3.3. Seasonally frozen ground
4
Table 3. Monthly average temperatures of air, ground surface and soils at Madoi during 1956–2005. Temperature(◦C
)
Jan. Feb. Mar. Apr. May. Jun. Jul. Aug. Sep. Oct. Nov. Dec.
Annual average Air −16.8 −13.4 −8.4 −3.7 1.4 5.2 7.6 6.9 2.9 −2.5 −10.7 −15.1 −3.9 Ground
surface
−14.8 −9.6 −3.9 1.8 7.1 10.6 12.4 11.9 7.2 1.2 −7.6 −12.9 0.4 Soil
depth (cm)
5 −11.1 −7.6 −2.8 1.3 5.9 9.4 11.2 10.8 8.0 2.3 −3.5 −7.8 1.3 10 −10.2 −7.0 −2.9 0.9 5.6 10.1 11.1 11.1 7.9 2.7 −3.4 −7.7 1.4 20 −9.5 −6.8 −3.1 0.1 4.6 8.6 10.0 10.1 7.6 3.1 −2.5 −6.8 1.3 40 −7.7 −5.7 −2.7 −0.1 3.4 7.7 8.7 8.9 6.6 2.0 −1.0 −5.6 1.2 80 −5.1 −4.1 −2.2 −0.4 1.3 4.9 6.0 7.0 5.9 2.7 0.4 −2.7 1.1 16 −0.5 −1.1 −0.9 −0.4 −0.2 0.0 0.5 2.0 3.9 2.9 1.2 0.3 0.6 320 0.5 0.2 0.2 0.1 0.1 0.1 0.3 1.2 1.8 2.2 1.6 0.9 0.8
Figure 2.Ground temperature curves at boreholes ZK5, ZK6, and ZK7 [9].
temperature of+0.3◦
C, and an accumulative period of subzero (including 0◦
C) average daily air temperatures ranging from 192 to 207 days. The monthly average air temperatures are above 0◦C from May to September, when occasionally daily average air temperatures can still dip below freezing. The accumulative period with subzero minimum ground surface temperatures ranges from 300 to 320 days. The maximum depths of frost penetration vary from 2.2 to 2.4 m. It is evident that the mean annual ground surface temperature was 4.3◦
C warmer than the MAAT during the period from 1956 to 2005 (table3).
4. Degradation of frozen ground
4.1. Evidence
The degradation of frozen ground is evident in the SAYR. This is based the following observations:
(1) A decrease in the areal extent of permafrost, and relative increase of seasonally frozen ground and taliks from recently thawed permafrost. For example, Huang’he’yan and Madoi town were all underlain by permafrost before the 1970s [19]. Repeated investigations and surveys for urban planning and construction projects showed that permafrost under these two towns had largely disappeared after the 1990s. At present, the boundary of permafrost near Madoi town has shifted westwards by about 15 km; the lower limit of permafrost in foothills to the north has risen to 4350 m asl from 4250 m asl; at Huang’he’yan in the south, the permafrost boundary also moved northwards by 2 km.
(2) Detached permafrost layer(s) has/have been discovered in many places in the eastern SAYR. The depths to the permafrost table have increased, and the talik thickness has increased. For example, talik has reached a depth of about 5 m in Xiaoyemaling.
(3) Data from boreholes, excavation pits, and water wells indicate that the lower limit of permafrost has risen by 50– 80 m compared with the 1980s. For example, it rose from 4320 to 4370 m asl at Yeniugou along G214, and from 4270 m asl to more than 4350 m asl on the slope north of Madoi.
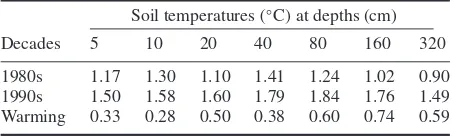
(4) The averages of maximum frost penetration depths were 2.4 m in the 1980s and 2.2 m in the 1990s. During the 1980s–1990s, the average soil temperatures at depths of 0.05–3.2 m rose by 0.3◦
C. Water temperatures in many wells in Madoi town also rose from 0.8◦
C in the 1980s to 1.5◦
C in the 1990s. This may suggest a similar warming trend of ground temperatures at similar depths (figure3; table4).
(5) Many pingos generally near the lower limit of permafrost thawed and collapsed in the lower parts. They migrated upslope in wetlands as a result of upslope thawing of permafrost. In addition, solifluction and retrogressive thaw slumps were observed.
4
Figure 3.Changes in mean annual soil temperatures at the Madoi Meteorological Station during 1981–2000.
Table 4. Decadal averages of mean annual soil temperature(◦
C). Soil temperatures(◦
C)at depths (cm) Decades 5 10 20 40 80 160 320 1980s 1.17 1.30 1.10 1.41 1.24 1.02 0.90 1990s 1.50 1.58 1.60 1.79 1.84 1.76 1.49 Warming 0.33 0.28 0.50 0.38 0.60 0.74 0.59
patches into seasonally frozen ground or taliks. Permafrost degrades more rapidly in the east than in the west. It has resulted in reduction of vegetation types and grassland desertification.
4.2. Causal analysis
Frozen ground degradation is complicated and has many causes, but rising air temperatures are the most basic reason. The MAATs have been increasing from 1955 to 2005 (figure 4). The increase in MAATs was at an average rate of 0.02◦C yr−1 during the mid-1980s and late 1980s. In
particular, the MAAT was−2.6◦C in 1998, the largest positive departure of 1.4◦
C from the 51-year average. The MAAT average in the 1990s was 0.6, 0.7 and 0.4◦
C warmer than those in the 1960s, 1970s and 1980s, respectively. The period between 2001 and 2005 was 0.8◦
C warmer than those in the 1960s. Increases in MAAT decadal averages were 0.6–0.7◦
C, and the warming occurred in all seasons, but the warming in winter was the largest(+0.9◦
C), followed by those in autumn (+0.8◦
C), summer (+0.4◦
C) and spring (+0.3◦ C).
The decadal averages of mean annual ground surface temperature increased from−0.1◦C in the 1960s to+0.8◦C in the 1990s (table 5). Changes in air temperatures showed an apparent seasonality. The warming in winter is the most striking, followed by those in summer and autumn. The warming in the 1980s mainly occurred in autumn and winter. Since the 1990s, the warming rates slowed in winter and autumn, but accelerated in spring and summer. At the same time, evaporation increased.
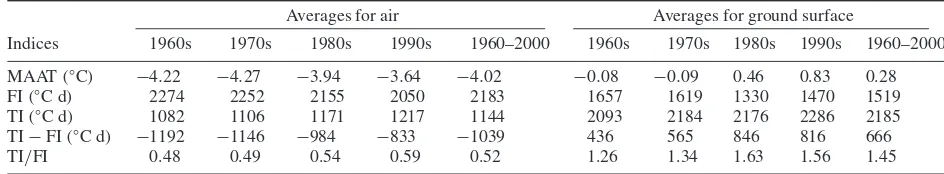
Changes in air and ground surface freezing and thawing indices are important in analyzing the accumulative changing trends of frozen ground. During 1961–2000, the freezing indices were decreasing, and the thawing indices were increasing at Madoi (table6), indicating a warming trend both in the cold and warm seasons and a heat accumulation in
Figure 4.Changes of mean annual air temperature at Madoi in the SAYR during 1950–2006.
soils [20]. Since the 1980s, the mean annual ground surface temperatures changed from subzero to above zero, and the ratio of thawing index to freezing index decreased from 1.63 to 1.56. This suggests that climate warming had an increasing effect on frozen ground degradation.
5. Ecological and environmental impacts of
degrading permafrost
The persistent presence of frozen ground can effectively retard, reduce, or even prevent soil moisture and surface waters from downward and lateral permeation [21]. It can also re-enrich with various nutrients on the bottom of the active layer or above seasonally frozen ground for plant growth during thawing seasons. As a result, alpine meadows usually flourish in valleys and basins.
During the past few decades, climate warming, over-grazing, unplanned mining, over-harvesting of herbaceous medicine plants and damage by rodent activities have resulted in severe degradation of grasslands in the SAYR. Degradation of frozen ground has further accelerated the degradation of grasslands and other environmental deterioration. The degrad-ing or degraded frozen ground alters the habitats for flora and fauna through changing or changed heat, moisture and nutrient regimes in soils, causing ecological chain reactions.
4
Table 5. Decadal averages of mean annual and seasonal air and ground surface temperatures(◦
C). Decadal averages of mean annual and seasonal air temperatures
Decade Annual Spring Summer Autumn Winter
Decadal average of mean annual ground surface temperatures
1960s −4.2 −3.6 6.6 −3.6 −16.0 −0.1 1970s −4.3 −3.7 6.7 −3.9 −16.5 −0.1 1980s −4.0 −3.9 6.6 −3.2 −15.4 0.5 1990s −3.6 −3.3 7.0 −2.8 −15.1 0.8 1960–2000 −4.0 −3.8 6.6 −3.5 −15.9 0.23
Table 6. Decadal averages of mean annual air and ground surface temperatures, freezing index (FI;◦
C d) and thawing index (TI;◦
C d) at Madoi, and their differences (TI−FI;◦
C d) and ratios(TI/FI)at Madoi [20].
Averages for air Averages for ground surface
Indices 1960s 1970s 1980s 1990s 1960–2000 1960s 1970s 1980s 1990s 1960–2000 MAAT(◦C
) −4.22 −4.27 −3.94 −3.64 −4.02 −0.08 −0.09 0.46 0.83 0.28 FI(◦C d
) 2274 2252 2155 2050 2183 1657 1619 1330 1470 1519
TI(◦C d
) 1082 1106 1171 1217 1144 2093 2184 2176 2286 2185
TI−FI(◦C d
) −1192 −1146 −984 −833 −1039 436 565 846 816 666
TI/FI 0.48 0.49 0.54 0.59 0.52 1.26 1.34 1.63 1.56 1.45
meadow vegetation, are either reduced or depleted due to resultant lower water table or lateral drainage. At the same time, the soil temperature rises and its seasonal and inter-annual variability also increases. This may greatly affect those species of short-rooted plants and flora and fauna adapted to cold air and soil environments in alpine meadows, and consequently the plant biodiversity, community compositions, and eventually stability of ecosystems. For example, frozen ground near Madoi has been degrading since the 1980s, and the ground water table has been lowered to depths of 6– 10 m, with a regional fall of 2–3 m during past 20 years. Landscapes around the town have been turned to sandy land or even to desert from alpine steppes [14]. Piedmont plains at the interception of the Niutoushan Hill between the Sisters Lakes and on the northern shore of the Ng¨oring Lake were excellent pastoral lands prior to the 1980s. Wetlands were formed in warm seasons by creeks seeping from the suprapermafrost water at the toes of slopes. The water flows were sharply reduced after the 1980s due to the elevation of the positions of springs and lowered suprapermafrost water table as a result of permafrost degradation. Accordingly, surface water supplies and soil moisture availability have been reduced, and in many places, water supplies have been completely cut off, resulting in transitions from paludal or typical alpine meadows to alpine steppes.
During thawing seasons, alpine meadows play important roles in controlling flash floods by ground storage and modulating surface runoffs and soil water supply. Mats or cushions formed by paludal meadow vegetation and root systems can buffer the splashing of raindrops or hailstones on otherwise bare ground surfaces, and absorb them in the vegetation–root–soil systems. This enables the reduction and retardation of surface runoffs, and slow percolation of water into the underlying soil layers for later use by biological communities.
Permafrost degradation has led to changes from the paludal alpine meadows to typical alpine meadows and/or
steppes, to changes in plant root structures and vegetative coverage, to a reduced retention, modulation, and storage of rainfall and snow-melt and ice-melt water by vegetation, and to an increased surface evaporation. The continual lowering of the ground water table changes the original hydraulic channels and runoff conditions, and alters the original water equilibrium such as in supplies, runoff, discharge and annual budgets. These result in a weakening or loss of the functions of vegetation for moisture retention and storage. In some areas, a lowered ground water table might reverse the supply–discharge relationships of surface water bodies and ground water. For example, when the suprapermafrost water table is lowered to a level below local water levels in rivers and lakes, they supply water to ground water, resulting in reduced river flows, low lake levels, reduction in the area of lakes or even dried lakes. During 1950–2004, the water levels at the Sister Lakes were lowered by 3.1–3.5 m [14].
Degrading permafrost has increased thaw settlement, sudden ground failures due to excessive differential thaw settlement, or retrogressive thaw slumps, solifluction, and soil erosion on slopes with fine-grained deposits and adequate soil moisture. The original structures of soil strata and plant roots systems have been damaged. The repeated freeze–thaw cycling differentially sorts soil particles: coarser grains move upwards and onto the ground surface. Once the soils are exposed on the ground surface, they become subject to land desertification, sand/dust storms, or other aeolian actions, enhancing soil erosion. Pastoral lands damaged due to overgrazing are hard to restore, and eventually they become desert if the overgrazing persists. The area of the desertified land has reached about 7841 km2, and accounts for 31% of total land area in the SAYR [14].
4
causing further damage to pastoral lands. The areas affected by rodents reached 224 925 km2, or 65.2% of total areal extent
of pastoral lands in Modoi county in 1998 [10]. Slightly affected grasslands have a lower productivity and a change in dominating plant species. Severely affected grasslands are transformed, resulting in the extensive appearance of ‘black soil land’ [22,23]. Rodent hazards have become one of the major reasons for deteriorating eco-environments in the SAYR. Permafrost degradation may also have contributed to the decline in the size of lakes and wetlands through increased water storage and improved hydraulic channeling. According to remote sensing data, the total lake area was 1227 km2 in the 1960s and 1177 km2 in 2000, i.e., there was a reduction of 50 km2 over the past 40 years [14]. The area of wetlands was 3895 km2in the early 1980s, and 3247 km2in the 1990s, i.e. there was a reduction of 648 km2of total area or an annual rate of loss at about 59 km2[24]. As a result, their functioning for water retention and storage, flood modulation and control, and preservation of species biodiversity has declined. The aquatic habitats shrank, aquatic biodiversity decreased, and the communities became smaller and more vulnerable. All these factors have adverse impacts on biological and community structures, abundance and the survival of rare and endangered species.
Permafrost degradation has caused the desertification of pastoral lands. The ground surface conditions have been changed, resulting in higher albedo. This alters heat and radiation budgets and reduced the convection of the near-surface atmosphere, resulting in a drier and warmer local climate with increased evaporation and more consumption of water resources. On the other hand, degraded pastoral land reduces the water supply to ground water from precipitation, and surface runoffs, and lessens the modulation and storage functions of soils for water resources. These processes destabilize spatiotemporal dynamics in precipitation, evaporation and runoffs, and could further reduce water resources and cause the deterioration of water and soil environments.
The vertical distribution of grassland degradation indicates that barren land resulting from degrading grasslands mainly occurs at elevations of 4100–5200 m asl [25, 26]. It is most severe at 4300–5000 m asl, where the areal extent of grasslands accounts for 2.4–7.5% of that at 4100–5200 m asl. This coincides with the belt of warm (>−1◦
C) permafrost, where its degradation has been most striking. Therefore, the degradations of permafrost and grasslands are spatially symbiotic, indicating interdependent, interactive and synchronous relationships.
6. Conclusions, prospects, and recommendations
The following conclusions can be drawn.
(1) A mosaic distribution of frozen ground was formed and continues to exist in the SAYR. As a result of its marginal nature, permafrost is either vertically attached or detached from the frost penetration. The detached permafrost can be further divided into shallow, deep and two-layer
permafrost. In general, permafrost is warm, thin, and thermally unstable.
(2) Since the 1980s, permafrost has been in general undergoing degradation due to climate warming and increasing human activities. Permafrost degradation has been more striking around the Sisters Lakes and in the east. The lower limit of permafrost has risen by 50– 80 m. The maximum frost depths decreased by about 0.2 m. The general trend of permafrost degradation is manifested by thinning and shrinking of permafrost and the transformation of discontinuous permafrost to isolated patches of permafrost, sometimes to seasonally frozen ground.
(3) As a result of permafrost degradation, the ground water table has been lowered and lakes and wetlands have shrunk in area, resulting in a degradation of grassland ecosystems. The degradation of grasslands may result in land desertification. Many factors have contributed to changes in ecological environments. They include climate warming and drying, permafrost degradation, increasing rodent activities, and anthropogenic factors. Permafrost degradation further accelerates the degradation of grasslands. These environmental factors interact and are interdependent. A self-fulfilling vicious cycle inevitably results in an environmental deterioration, of which the vital issue is the declining water resources, particularly the water availability in near-surface soil layers.
Two aspects need to be urgently studied to understand the mechanisms and for the effective remediation of the deteriorating environments.
4
changes in the evapotranspiration, precipitation retention and percolation, runoff generation and phase changes in response to ground freezing–thawing. Permafrost eco-hydrogeology is still rarely studied and poorly understood. Thus, the answers to these basic questions are at best speculative. The urgent issue now is to investigate and understand the state of hydrogeology and conversions of ‘five waters’ (ground water, surface water bodies, precipitation, evapotranspiration, and ground ice). It is basic for the remedial measures to increase and preserve the badly needed water for the near-surface soils and plant roots, and to rehabilitate the deteriorating environments. (2) Since 2003, the governmental programs of ‘Returning
to grasslands from grazing’ and ‘Ecological protection in the Three Rivers sources’ have been implemented by evacuating local inhabitants, limitation of grazing, and artificial rain-making. The ecological environments in the SAYR have shown signs of recovery. Water flows and levels in rivers and lakes have indicated a slow, but gradual increasing trend. If these remedial measures and programs can be sustained, they may alleviate the anthropogenic impacts on the fragile and sensitive ecological environments. However, in spite of the fact that the roles of people and cattle in the ecosystems on the QTP are poorly understood so far, and the actual effects of this passive and adaptive mitigation would be limited. These costly remedial measures cannot be sustained due to complicated cultural conflicts. Therefore, more active measures should be sought after for ecological remediation, such as the upper route for the West Line of the Water Diversion Program from the Yangtze River to the Yellow River. Although the major concern for the program is to relieve the water shortage in the upper streams of the Yellow River, it can also be valuable in improving ecological functions in the SAYR.
Therefore, it is recommended that:
(1) Special funding should be established for basic research and monitoring systems in national key eco-environmental remediation programs. Before rushing into implementing costly programs, visionary, strategic and tactical research and experiments relating to the damaged ecological environments and their remedial effects should be conducted, validated and improved in order to achieve the goals in eco-environmental management, protection and rehabilitation in an integrated, more effective and practical way.
(2) Under the auspices of a coordinated endeavor by state ministries, research organizations, local governments, and service agencies, stations, transects, profiles and networks for monitoring climate, frozen ground, hydrology and hydrogeology, and eco-environments should be established in the SAYR. On the basis of ground-based measurements, GIS/RS-integrated modeling and forecasting of water/ice cycling, eco-hydrogeological effects of permafrost degradation and experiments with more active human intervention, and the validation of their effects can be accomplished.
(3) Research on the eco-hydrogeological effects of degrading permafrost needs long-term, integrated, systematic and multidisciplinary research. It involves many key system questions and answers in many scientific and engineering fields. The goals of these studies should aim at providing a solid scientific basis and practical solutions for national key projects for ecological rehabilitation and engineering construction, in order to provide infallible ecological and water safety for China.
Acknowledgments
The research was supported by the State Key Laboratory of Frozen Soils Engineering (Grant No SKLFSE-ZY-01) and China National Science Foundation (Grant No 40821001). Mr. Geoffrey Gay provided generous assistance with English editing.
References
[1] Harris C, M¨uhll V D, Isaken K, Haeberli W, Sollid J L, King L, Holmlund P, Dramis F, Guglielmin M and Palacios D 2003 Warming permafrost in European mountainsGlob. Planet. Change39215–25
[2] Jin H J, Yu Q H, L¨u L Z, Guo D X and Li Y W 2007 Degradation of permafrost in the Xing’anling Mountains, Northeastern ChinaPermafr. Periglac. Proc.18245–58
[3] Jin H J, Yu Q H, Wang S L and L¨u L Z 2007 Changes in permafrost environments along the Qinghai–Tibet
engineering corridor induced by anthropogenic activities and climate warmingCold Reg. Sci. Technol.53317–33
[4] Marchenko S S, Gorbunov A P and Romanovsky V E 2007 Permafrost warming in the Tien Shan Mountains, Central AsiaGlob. Planet. Change56311–27
[5] Jin H J, Cheng G D, Li S X and Zhao L 2000 . Permafrost and climatic change in ChinaGlob. Planet. Change26387–404
[6] Jorgenson M T, Racine C H, Walters J C and Osterkamp T E 2001 Permafrost degradation and ecological changes associated with a warming climate in central AlaskaClim. Change48551579
[7] Harris C, Haeberli W, M¨uhll V D and King L 2001 Permafrost monitoring in the high mountains of Europe: the PACE project in its global contextPermafr. Periglac. Proc.123–11
[8] Heginbottom J A 2002 Permafrost mapping: a reviewProg. Phys. Geogr.26623–42
[9] Jin H J, Chang X L and Wang S L 2007 Evolution of
permafrost on the Qinghai–Tibet Plateau since the end of the PleistoceneJ. Geophys. Res.112F02S09
[10] Wang S L, Jin H J, Li S X, Zhao L and Guo D X 2000 Permafrost degradation on the Qinghai–Tibet Plateau and its environmental impactsPermafr. Periglac. Proc.1143–53
[11] Wang G X and Cheng G D 2000 Eco-environmental changes and causative analysis in the source regions of the Yangtze and Yellow Rivers, ChinaEnvironmentalist20221–32
[12] Liu G S, Wang G X, Hu H C, Li T B, Wang J F, Ren D X and Huang Y J 2009 Influence of vegetation coverage on water and heat processes of the active layer in permafrost regions of the Tibetan PlateauJ. Glaciol. Geocryol.3189–95 (in Chinese)
4
[14] Zhang S Q, Wang Y G, Zhao Y Z, Huang Y, Li Y G, Shi W D and Shang X G 2004 Degradation of permafrost in the Sources of the Yellow River and its environmental impacts
J. Glaciol. Geocryol.261–6 (in Chinese)
[15] Cheng G D, Wang G X and Wang X D 1998 Eco-environmental change in the Sources of the Yangtze, Yellow and
Lancangjiang Rivers and its causal analysisAdv. Earth Sci.
1324–31 (in Chinese)
[16] Ding Y J, Liu S Y, Xie C W, Zhang Y and Wang J 2006 Yellow River at risk: An assessment of the impacts of climate change on the Yellow River source region, available at
www.yellowriversource.org(for Greenpeace)
[17] Qinghai Geological Survey and China University of Geology 2002Investigation Report on the Ecological Environmental Geology in the Sources of the Yellow River Xi’ningQinghai Geological Survey, China, p 50 (in Chinese)
[18] Wang S L, Lin Q and Zhao L 1999 Permafrost along the Qinghai–Kang (W. Sichuan) HighwayArid Reg. Geogr.22
42–29 (in Chinese)
[19] Wang S L 1987 Frozen ground and periglacial feature in the southeastern part of Qinghai ProvinceReports on the Northeastern Part of the Qinghai–Xizang Plateau by Sino-West German Scientific Expedition(Beijing: Science Press) pp 343–65
[20] Wu T H, Zhao L, Li S X, Xie C W, Pang Q Q and Zhang W G 2008 Freezing/thawing index variation during the last 40
year over the Tibet PlateauProc. 9th Int. Conf. on Permafrost (Fairbanks, AK)vol 2, pp 1969–73
[21] Jin H J, Sun G Y, Yu S P, Jin R and He R X 2008 Symbiosis of marshes and permafrost in the Da and Xiao Hinggan Mountains in northeastern ChinaChin. Geogr. Sci.1862–9
[22] Shang Z H, Ma Y S, Long R J and Ding L M 2008 Effect of fencing, artificial seeding and abandonment on vegetation composition and dynamics of ‘black soil land’ in the headwaters on the Yangtze and the Yellow Rivers of the Qinghai–Tibet PlateauLand Degrad. Dev.19554–63
[23] Wang C T, Long R J, Wang Q L, Jing Z C and Shi J J 2009 Changes in plant diversity, biomass and soil C in alpine meadows at different degradation stages in the headwater regions of three rivers, ChinaLand Degrad. Dev.20187–98
[24] Chen G C, Huang Z W and Lu X F 2002 Features and protection of wetlands on the Qinghai PlateauJ. Glaciol. Geocryol.24254–9 (in Chinese)
[25] Bai W Q, Shen Z X, Zhang Y L and Xie G D 2002 Analysis of formation causes of grassland degradation in Madoi county in the source region of Yellow RiverChinese J. Appl. Ecol.
13823–6 (in Chinese)
![Table 1. Meteorological features in the sources area of the Yellow River [17].](https://thumb-ap.123doks.com/thumbv2/123dok/2113141.1609076/4.595.56.535.65.364/table-meteorological-features-sources-area-yellow-river.webp)
![Table 2. Features of frozen ground in the sources area of the Yellow River [14, 18].](https://thumb-ap.123doks.com/thumbv2/123dok/2113141.1609076/6.595.66.536.83.470/table-features-frozen-ground-sources-area-yellow-river.webp)
![Figure 2. Ground temperature curves at boreholes ZK5, ZK6, andZK7 [9].](https://thumb-ap.123doks.com/thumbv2/123dok/2113141.1609076/7.595.78.258.113.511/figure-ground-temperature-curves-boreholes-zk-zk-andzk.webp)