Summary We developed a fertilization technique that results in the control, and maintenance at defined rates and levels, of growth and tissue composition of plants of different sizes and developmental stages growing at exponential and nonexponen-tial rates in solid media under naturally fluctuating light and temperature regimes. Clonal cottonwood (Populus deltoides Bartr.) saplings were grown in sand. Low concentrations of nutrient solution were added daily at different constant expo-nentially increasing rates for 20--30 days to produce plants with different growth rates and tissue nutrient composition. Match-ing nutrient supply to measured growth demand by bootstrap-ping, where bootstrapping is the use of an iterative equation that calculates demand from either actual or desired growth rates, maintained these differences for 20--40 days. Nutrient additions controlled growth of saplings with growth rates be-tween 2.0 and 4.0% day−1, heights between 13.9 and 37.5 cm, dry weights between 0.70 and 3.90 g, leaf nitrogen contents between 1.2 and 3.9%, and leaf carbon/nitrogen ratios between 42.1 and 12.5. The technique was reproducible in a greenhouse without temperature, humidity, or light control, and is easily modified to suit different plant species, plants of various sizes, and various growing conditions.
Keywords: cottonwood, foliar carbon, foliar nitrogen, growth rate, nutrition, Populus deltoides, steady-state growth.
Introduction
The effects of soil nutrient availability on plant growth, physi-ology, tissue chemistry, or stress tolerance are often investi-gated by experimentally manipulating nutrient supply. Several approaches have been used including stationary solution cul-ture, bulk fertilization in soil, and supplying nutrients expo-nentially to solid media (e.g., Timmer et al. 1991, Miller and Timmer 1994) or exponentially in flowing solution-spray cul-ture (e.g., Ingestad 1982, Asher and Edwards 1983, Ingestad and Lund 1986).
In stationary solution culture and bulk fertilization, a rela-tively high concentration of nutrients is added once, or infre-quently at the same concentration. Initial nutrient supply invariably exceeds plant demands, and nutrient concentrations in tissues are often in surplus relative to requirements (Timmer et al. 1991) and substantially in excess of those found in the field (Epstein 1972). Plant demand then begins to exceed supply as nutrients are used for growth and are not replenished (Ingestad 1982, 1987). Nutrient stress at various stages of seedling development (Imo and Timmer 1992) and deficiency symptoms may then appear that are not commonly seen in natural systems (Ingestad 1982). Consequently, plant growth (Ingestad 1982), development, physiology (McDonald et al. 1986) and tissue biochemistry (Waring et al. 1985) fluctuate, often to a greater extent than found for plants in the field (Ingestad 1982).
In contrast, exponential additions of nutrients at low concen-trations (Ericsson 1981a, 1981b, Ingestad 1982, Asher and Edwards 1983, Ingestad and Lund 1986) can match nutrient supply with plant uptake and use over time. In response to exponential nutrient additions, small seedlings exhibit stable biochemical composition of tissues during exponential growth (e.g., Ingestad 1982, Waring et al. 1985). The resultant steady-state growth and nutrition during exponential growth has ad-vantages. Comparisons between plants grown under different environmental conditions become simplified and more precise because plant nutrient status and growth rates are stable (Tamm 1964, Linder and Rook 1984, Ingestad and Ågren 1991, 1992, and see Duarte et al. 1989, Burgess 1990, Cromer and Jarvis 1990, Thorsteinsson et al. 1990). Time- and size-dependent variations in the tissue content of nutrients and other chemical characteristics, and luxury consumption of nutrients are re-duced, preventing these factors from confounding the interpre-tation of plant responses to changes in nutrient availability (Waring et al. 1985, Coleman et al. 1994, Ågren 1994). The allocation of carbon (C) and nitrogen (N) to growth (Ingestad and Ågren 1988, 1991) versus defense (Waring et al. 1985,
Controlling growth and chemical composition of saplings by iteratively
matching nutrient supply to demand: a bootstrap fertilization
technique
D. ALEXANDER WAIT,
1,2,3CLIVE G. JONES
2and MICHAEL SCHAEDLE
11 SUNY-College of Environmental Science and Forestry, Syracuse, NY 13210, USA 2
Institute of Ecosystem Studies, Box AB, Millbrook, NY 12545, USA
3 Present address: Biological Research Laboratories, Department of Biology, 130 College Place, Syracuse University, Syracuse, NY 13244, USA
Received October 4, 1994
Larsson et al. 1986) can be readily investigated. Increased fertilizer-uptake efficiency and outplanting performance of nursery stock has been achieved (Timmer et al. 1991, Imo and Timmer 1992, Miller and Timmer 1994).
The use of flowing solution or spray culture to achieve steady-state growth and nutrition has some disadvantages. Nutrient flux rates across the root surface are often more rapid than those found in nature; root development and architecture are different from that found in soils; the necessary equipment is expensive; and the size and number of plants that can be grown are limited (e.g., Ingestad and Lund 1986, Koch et al. 1987). Applying exponentially increasing rates of nutrients to plants in solid media is problematic because plants will not always be growing at constant exponential rates (e.g., Braak-hekke and Labe 1990, Freijsen and Otten 1993), and therefore, exponential additions will not maintain steady-state growth and nutrition.
The theoretical concepts and methodology to maintain steady-state conditions beyond exponential growth are not well developed (Friejsen and Otten 1993) for large plants or plants growing in solid media. The objective of this study was to develop a steady-state fertilization technique that would control growth and tissue composition of plants of various sizes and developmental stages growing at exponential and nonexponential growth rates in solid media.
Materials and methods
Plant culture
Shoot cuttings from 2-year-old cottonwood (Populus deltoides Bartr.) saplings (Clone ST109) were rooted in perlite and grown in sand to a uniform height (10 ± 0.5 cm) and fresh weight (FW, 2 ± 0.1 g), and then planted in plastic tree tubes (50 cm height × 10 cm diameter) containing 3 l of deionized water-washed Mystic White silica sand (bulk density, 1300 kg m−3). Tree tubes were spaced 12 cm apart within a plywood rack to minimize shading. Saplings were randomly assigned to a nutrient addition treatment, and treatments were randomly distributed within and between racks. Racks were placed on benches in a greenhouse without humidity, temperature, or light control at 60% of full sun. Experiments took place at the Institute of Ecosystem Studies in Millbrook, New York, be-tween June and August.
Nutrient solution composition
Nutrient additions were expressed as the amount of N (mg) added to pots, with all other nutrients added in constant pro-portion to N (Table 1). The nutrient propro-portions used were similar to those found to be optimal for Betula verrucosa J.F. Ehrh. (Ingestad 1970), Salix aquatica Smith (Ericsson 1981a, 1981b) and Populus simonii Carr. (Hui-Jun and Ingestad 1984) with one major modification. Because P. deltoides foliage has a high calcium (Ca) content (0.8--3.0% dry weight (DW), Blackmon 1977), the proportion of Ca was increased sixfold relative to the nutrient proportions used by Ingestad (1970) to ensure that Ca was not limiting to growth or development.
Pot dynamics
To match nutrient supply with uptake and use, we first deter-mined that nutrients added to a tree tube on a daily basis and not taken up by the plant would be flushed out at the next addition, i.e., there would be no net accumulation of nutrients in the sand that might lead to subsequent oversupply of nutri-ents.
Based on a 200-ml addition to pots and a measured retention volume of 80 ± 2.5 ml, nutrient retention as N was measured in two ways. First, nutrients were added once daily for 16 days at an exponentially increasing rate of 7.2% day−1, with an initial N concentration of 0.5 mM (0.56 mg) and a final N concentration of 1.6 mM (1.8 mg), to five pots without sap-lings. Leachate was collected from the pots after 3, 6, 9, 13 and 16 days, and its specific conductivity determined with a YSI 33 S-C-T meter. Conductivity of leachate samples (three repli-cates and 40-ml aliquots per sample) was converted to N concentration based on a standard curve (N (mM) = 0.0064 ×
conductivity (ohm) − 0.048; r2 = 0.99, P < 0.001, n = 30). All but 6 ± 14% of the N added the previous day was recovered in the leachate, with an estimated retention of 0.06 mg N per 1.0 mg N added. Second, nutrients were added once daily for 8 days at a N concentration of 1.0 mM to five pots without saplings, and leachate conductivity was determined after 1, 3 and 8 days. Over 95% of the total N added over the 8 days was recovered in leachate.
These data, along with weekly NO3−, NH4+ and pH measure-ments of input and leachate solutions in a preliminary growth experiment (Wait 1992), indicated that the assumption of no nutrient retention over time was valid, and that the pH (4.5 to 5.7) was within the range required for growth of cottonwood.
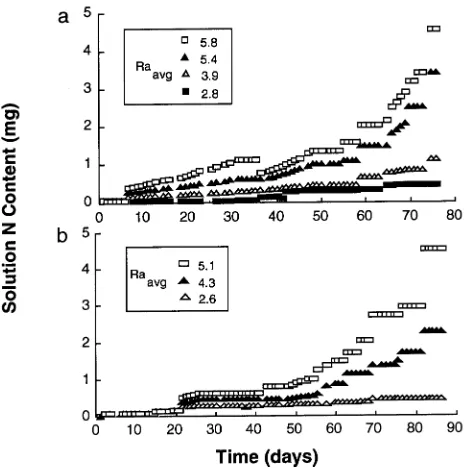
Table 1. Nutrient solution composition.
Element Mole ratio Macronutrient salts Concentration (µM) Micronutrient salts Concentration (mM)
N 1.00 NH4NO3 200 H3BO3 46.0
K 0.24 Ca(NO3)2 300 MnCl2 9.5
P 0.06 CaCl2 200 CuSO4 0.2
Ca 0.50 MgSO4 40 ZnSO4 0.8
Mg 0.05 MgCl2 10 Na2MoO4 0.1
S 0.04 KH2PO4 60 NaCl 50.0
Nutrient addition method
(1) Establishing different growth rates and tissue composi-tion among treatments; nutrient addicomposi-tions for lag phase growth and exponential growth Deionized water was added to saplings once daily for 5 days to acclimate plants to pots. A low concentration of nutrient solution (0.056 mg N) was then added for 5 days to initiate uniform growth in all treatments. Nutrients were then added daily at different, but constant, exponential rates to initiate differences in growth rates and tissue composition among treatments (Ingestad and Lund 1986). The exponential additions were carried out for 20--30 days until growth rates appeared to separate. Exponentially increasing addition rates were calculated as in Ingestad and Lund (1979) and Imo and Timmer (1992, Equations 1 and 2). The additions were based on the exponential function Nt = Ns(ert− 1), where Nt is the amount of N to be added in the number of nutrient applications (t), Ns is the content of N in the seedlings on any given day, and r is the relative addition rate required to maintain or increase the N content in the tissue to a final N content. Thus, Nt− Ns is the amount of N to be added to allow the N content to increase at the desired relative rate (Ericsson 1981a), which is a direct function of the relative growth rate. Therefore, the amount of N needed to maintain a current N content at a given growth rate can be calculated as follows:
r = W Ns RGR, (1)
where W is sapling fresh weight, and RGR is measured or desired relative growth rate. The initial amount of N in 2.0 gFW saplings in these experiments was 0.5% FW. The potential range of RGRs was estimated to be between 1.0 and 6.0% day−1 (Hui-Jun and Ingestad 1984, Wait 1992).
(2) Maintaining different growth rates and tissue composi-tion among treatments; iterative, bootstrap, nutrient addi-tions for nonexponential growth Nutrient additions were re-estimated from instantaneous shoot elongation rates (cm day−1) and estimated leaf N concentration (1.0 to 5.0% DW, Hui-Jun and Ingestad 1984, Hansen et al. 1988) after the initial 20--30 days of constant exponentially increasing additions. The fol-lowing equation re-estimates the amount of N to add on a given day to maintain differences in growth rates and tissue compo-sition achieved from exponential additions:
Ng = ∆Ht Np HW, (2)
where Ng is the amount of N (g) required for the plant to maintain the current N concentration at the given current absolute growth rate, ∆Ht is the change in height over time (cm day−1), N
p is the actual or estimated percentage N (N concen-tration, % DW) in leaves, and HW is a factor that relates height to weight, estimated from weight = 0.149 × height − 0.998 (1 cm = 0.08 g, r2 = 0.914, n = 67, P = 0.0001). The value of HW was determined from 19 harvested saplings between 10 and 40 cm in height and confirmed with 48 saplings harvested from growth experiments (Wait 1992).
The amount calculated (Ng) is then added at an exponential
rate or linear rate until the amount of N to add is again re-estimated. Deciding at what rate to add nutrients will de-pend on whether the measured growth rate is an exponential or nonexponential function. Thus, the essence of bootstrapping is to adjust the amount of N and the addition rate to account for nonexponential growth, and thereby avoid the over- or under-supply of nutrients that leads to deviations from steady-state conditions.
Growth experiments
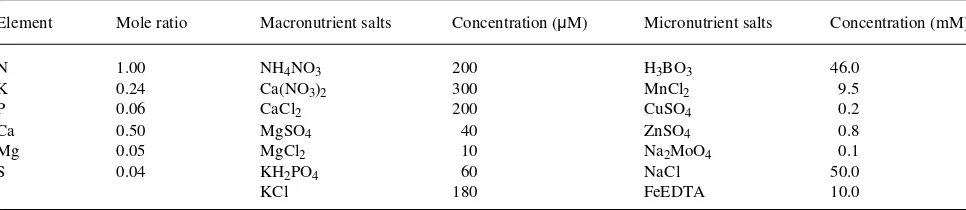
In Experiment 1, 80 saplings were grown for 76 days at one of four nutrient addition rates (Figure 1a). The initial N mass added to all treatments was 0.056 mg; the final N mass added for each treatment was 0.47, 1.12, 3.36 and 5.15 mg for constant exponential addition rates of 1.5, 3.0, 4.5 and 6.0% day−1, respectively. Because the nutrient addition rate was adjusted periodically (Equation 2), treatments were designated as the average exponential nutrient addition rate (Raavg , mg mg−1 day−1 or % day−1) over the entire experiment. The Ra
avg for the 76 days for each treatment was 2.8, 3.9, 5.4 and 5.8% day−1, respectively.
In Experiment 2, 60 saplings were grown for 86 days at one of three nutrient addition rates (Figure 1b). The initial N mass added to all treatments was 0.056 mg; the final N mass added for each treatment was 0.54, 2.24 and 4.48 mg for constant exponential addition rates of 2.0, 4.0 and 6.0% day−1, respec-tively. The Raavg for the 86 days for each treatment was 2.6, 4.3 and 5.1% day−1, respectively.
Growth and foliar chemistry
Height was measured from an acrylic paint mark at the stem base to the tip of the primary node (stem apex) on eight saplings per treatment every 2 to 4 days in Experiment 1 and on 12 saplings per treatment every 7 to 10 days in Experi-ment 2. On Day 76 in ExperiExperi-ment 1, the saplings measured for height were harvested. Leaf area was determined with an LI-3100 area meter (Li-Cor Inc., Lincoln, NE); roots, stems and leaves were weighed, dried at 35 °C and re-weighed. Leaves (two per sapling) at or approaching full expansion were pooled, dried and milled (20 mesh), and analyzed for elemen-tal N and C with a Carlo Erba NA 1500 N/C analyzer and microwave digested and analyzed for elemental P, K, Ca and Mg with a Spectro ICP analyzer. In addition, the 12 saplings per treatment not measured for height in Experiment 1 were harvested in randomly chosen pairs for determination of foliar N, RGR (g g−1 day−1), and height/weight ratio through time.
Data analysis
Sapling height was used to calculate instantaneous relative height growth rate (RHGR, day−1) as follows:
RHGR = (ln(h2) − ln(h1))/(t2−t1),
(3)
where ln(h2) and ln(h1) are the natural log of plant height at time t2 and t1, respectively.
The mean daily RHGR in a treatment (RHGRdaily ) plotted against time was used to visualize the growth rate in a treat-ment between time intervals (Evans 1972, Poorter 1989a). Third-order polynomials were fitted to RHGRdaily to derive the RHGR over time (Hunt 1982, Poorter 1989a, 1989b).
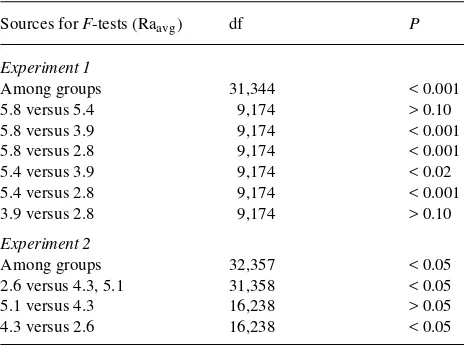
To verify that different nutrient addition rates significantly affected RHGRdaily , fitted curves to RHGRdaily (fitted to 12 and 8 time intervals in Experiments 1 and 2, respectively) were analyzed with regression methods as described by Potvin et al. (1990). Pairwise comparisons of fitted response curves (i.e., RHGR) indicated which treatments were statistically different from each other. The RHGRdaily data were analyzed by re-peated measures ANOVA (Potvin et al. 1990) to verify the results of regression analysis. Stable growth was defined as a period of time when the rate of change of RHGR was at or near zero. That is, a plant growing at the same relative (i.e., constant exponential) or absolute rate over a given time period, where the rate of change in growth could be increasing, constant, or decreasing depending on whether growth is described by a constant exponential, or nonexponential function. Stable growth was determined by visually inspecting RHGRdaily and the curves (i.e., slope of line) fit to RHGRdaily , and by calculat-ing the rate of change of growth from the derivatives of the polynomial (Hunt 1982, Poorter 1989a, 1989b). End point heights, leaf areas, root/shoot ratios, and tissue nutrient com-positions were analyzed by ANOVA. When a significant treat-ment effect occurred (P < 0.05), pairwise comparisons of means were made by either the Waller/Duncan method or t-tests.
Results Growth rates
Daily nutrient addition treatments (Raavg )significantly af-fected RHGR (Table 2). The treatments that differed by more than 1.5% day−1 in Experiment 1 and by more than 0.8% day−1 in Experiment 2 resulted in statistically significant differences in RHGR (Table 2). Repeated measures ANOVA of RHGRdaily indicated that there were significant nutrient addition by time effects (P < 0.001) in both experiments. By bootstrapping nutrient additions to account for nonexponential growth, the mean RHGRdaily was maintained at a stable rate between Days 49 and 76 in Experiment 1 and between Days 65 and 86 in Experiment 2 (Figure 2, Table 3). Dry matter growth rates (RGR, g g−1 day−1) were significantly positively correlated to RHGRdaily over time (df = 19, r2 = 0.69, P = 0.0001, RGR = 0.717 × RHGRdaily + 3.094 × 10⁻⁴), indicating that RGR was stable and that height was a good estimate of biomass for these cottonwood saplings.
Growth characteristics
Saplings grown at high rates of nutrient addition were signifi-cantly taller, and had signifisignifi-cantly greater biomass, leaf area and weight (Table 3) than saplings grown at low rates of nutrient addition. Root/shoot ratios were lower in saplings grown at high nutrient addition rates than in saplings grown at low nutrient addition rates (Table 3). Variation in growth char-acteristics between saplings within a treatment was low, as indicated by low coefficients of variation (Table 3).
Foliar chemistry
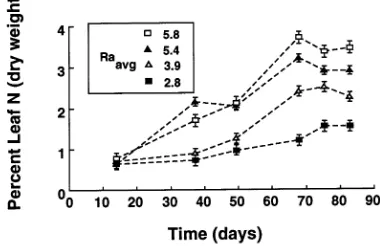
Foliar N was significantly greater in saplings in the high nutrient addition treatments than in saplings in the low nutrient addition treatments (Table 3). Foliar C/N ratios declined with growth rate and were significantly different between each Raavg treatment except between treatments 5.4 and 5.8% day−1 in
Table 2. Regression analysis of third-order polynomials fitted to RHGRdaily (from Figure 2) for different average rates of nutrient addition (Raavg , % day−1). Experiment 1, n = 8 saplings per Raavg ; Experiment 2, n = 12 saplings per Raavg .
Sources for F-tests (Raavg ) df P
Experiment 1
Among groups 31,344 < 0.001
5.8 versus 5.4 9,174 > 0.10
Among groups 32,357 < 0.05
2.6 versus 4.3, 5.1 31,358 < 0.05
5.1 versus 4.3 16,238 > 0.05
Experiment 1 (Table 3). Foliar N was significantly correlated to RHGRdaily (df = 19, r2 = 0.77, P = 0.0001, N (gDW) = 0.488
× RHGRdaily + 53.255), indicating stable foliar N (Figure 3). Concentrations of P, K, Ca and Mg were above deficiency levels in Experiment 1, with no visible nutrient deficiency
symptoms (as described by Epstein 1972). Foliar concentra-tions of Ca and Mg were similar in all Raavg treatments, whereas foliar concentrations of P and K increased with in-creasing nutrient supply.
Discussion
Constant exponential growth may not occur, or may be of short duration in plants (Pieters and van den Noort 1985, 1990) because of self-shading (Ingestad and Lund 1979), a declining ratio of growing to mature tissue (Pieters and van den Noort 1990), or reproduction (Freijsen and Otten 1993). Therefore, constant exponential nutrient supply would only be expected to control growth over limited time periods and plant develop-mental stages. For example, Ingestad (1982) and Ericsson (1981a, 1981b) used exponential nutrient supply to control the growth of small Betula seedlings and Salix ramets during exponential growth phases. Once growth deviated from expo-Figure 2. Mean RHGRdaily of saplings grown at different average
nutrient addition rates (see Figure 1). The solid lines (RHGR) are the fit of third-order polynomials as described by Poorter (1989a). (a) Experiment 1, n = 8 saplings per treatment; pooled standard deviation for all treatments was 0.0050 between Days 49 and 76; pairs of Raavg treatments are shown in separate graphs for clarity. (b) Experiment 2, n = 12 saplings per treatment; pooled standard deviation for all treat-ments was 0.0020 between Days 65 and 85.
Table 3. Sapling growth and foliar chemistry. Numbers in parentheses are coefficients of variation unless otherwise indicated; letters within a row and experiment indicate significant differences between means (P < 0.05).
Raavg (% day−1) Experiment 1 Experiment 2
2.8 3.9 5.4 5.8 2.6 4.3 5.1
Sapling growth
Days of stable growth1 76 (49--76) 76 (49--76) 76 (49--76) 76 (49--76) 86 (65--86) 86 (65--86) 86 (65--86) Stable mean RHGR2 0.019 (20) 0.026 (20) 0.033 (15) 0.039 (13) 0.026 (6) 0.034 (6) 0.037 (7) Height (cm) 13.9 (20) a 22.3 (30) b 29.5 (11) c 37.5 (13) d 15.3 (8) a 25.9 (5) b 34.5 (5) c Total dry weight (g) 1.08 (52) a 2.26 (43) b 3.69 (30) c 5.00 (11) d nd3 nd nd Leaf dry weight (g) 0.37 (52) a 1.01 (25) b 2.77 (5) c 3.41 (21) c nd nd nd
Leaf area (cm2) 54 (50) a 174 (17) b 492 (1) c 610 (3) d nd nd nd
Root/shoot ratio 0.90 (28) a 0.69 (13) b 0.57 (14) c 0.48 (8) c nd nd nd
Foliar chemistry (dry weight basis)
% N 1.2 (2) a 2.4 (2) b 3.2 (1) c 3.7 (11) d 1.9 (4) a 3.2 (2) b 3.9 (1) c C/N ratio 42.1 (21) a 18.8 (16) b 14.5 (1) c 12.8 (2) c 29.5 (9) a 14.9 (3) b 12.5 (2) c
% P 0.10 (20) a 0.16 (18) b 0.26 (23) c 0.42 (23) d nd nd nd
% K 0.59 (29) a 0.85 (22) b 1.50 (16) c 1.80 (8) d nd nd nd
% Ca 1.3 (18) a 1.5 (23) a 1.6 (18) a 1.6 (17) a nd nd nd
1 Days of stable growth refers to the time period during which the rate of change in growth was constant or essentially zero (see Figure 2). 2 Stable mean RHGR is the mean RHGR
daily during the days of stable growth. 3 nd = No data available.
nential, the relationships between relative addition rates, rela-tive growth rates, and relarela-tive uptake rates were no longer constant, and growth and tissue composition could no longer be controlled. Wait (1992) observed that exponential nutrient addition rates to cottonwood saplings for over 30 days resulted in oversupply so that growth and tissue composition were ultimately not different between treatments, or stable within a treatment. Conventional, single dose or constant top dressing fertilization regimes would also not be expected to result in steady-state growth and nutrition (Imo and Timmer 1992).
Nutrient addition method
Because exponential nutrient additions can lead to oversupply, and possibly undersupply, of nutrients over time, which would lead to fluctuations in growth and tissue composition, we developed an iterative bootstrap fertilization method. This method takes into account that growth is not a constant expo-nential function because of plant size, plant developmental stage, and fluctuations in temperature, light and humidity.
Initially, no or low nutrient concentration additions were made so that the saplings could adjust to the culture system and to avoid oversupply of N during the lag phase growth (see Ingestad and Lund 1986). The negative slope for RHGR for up to 15 days in both Experiments 1 and 2 (Figure 2) illustrates this lag phase, or pre-exponential phase of growth. Constant exponential nutrient addition rates were then made based on potential, and desired, growth rates and tissue N concentra-tions (Ingestad and Lund 1986). Separation of RHGRs during the exponential additions illustrated that nutrient supply was driving RHGR at different rates (Figure 2). Day to day vari-ations in RHGRdaily occurred (Figure 2) that were most likely due to fluctuations in light and temperature, and to different measurement intervals (Poorter 1989a). During the nonexpo-nential phase of growth, iterative bootstrap-calculated addi-tions were used to maintain the differences in RHGRs achieved by the exponential additions. Bootstrapping re-estimates the amount of N needed to maintain stable growth and tissue composition based on actual growth in each treatment. The re-estimated N amount was then added at a constant exponen-tial or linear rate depending on current growth rates until N was again re-estimated. For example, every 3--5 days in Experi-ment 1 and every 7--10 days in ExperiExperi-ment 2 (Figure 1).
Growth and tissue composition
The fertilization method controlled sapling growth, by varying the supply rate of nutrients, over relatively long time periods (60+ days) during which exponential and nonexponential growth occurred (Figure 2). In two independently replicated experiments, the nutrient addition treatments (Table 2) resulted in differing sapling relative height growth rates (Figure 2), but within a treatment, stable height growth rates were maintained (Table 3) for over 20 days. Foliar N concentration increased with increasing nutrient addition rate (Figure 3). The patterns of growth and biomass allocation conformed to those expected for plants growing at different rates of nutrient supply (Table 3) (Ingestad 1982, McDonald et al. 1986, Wilson 1988, Ingestad and Ågren 1991).
Applicability of nutrient addition method
The basic premise of establishing different growth rates and tissue composition with exponential nutrient additions, and then maintaining these differences at defined levels throughout different developmental growth phases with a set of iterative bootstrap equations is applicable to fertilization experiments in general. Successful application of the technique to other plant species would require certain preliminary data. First, the approximate range of growth rates observed at different devel-opmental stages should be known. Second, the mean and range of macronutrient concentrations in the leaf tissues or the whole plant or both at plant sizes of interest should be estimated. Third, the best nondestructive estimate of dry matter accumu-lation that can be readily measured (e.g., leaf area, height, or a combination of both) should be determined. Finally, some estimate of nutrient retention in the solid medium is needed.
Because the technique helps avoid potentially confounding effects of uncontrolled fluctuations in resource supply and demand, it will be useful for studies that require conditions of steady-state growth and nutrition (see Ingestad and Ågren 1992, Ågren 1994). For example, the technique could be used to investigate resource allocation to shoot growth versus root growth, or growth versus other processes such as partitioning of metabolites to defense. It should also be possible to use the technique to control resource availability while studying the effects of multiple types of stress or physical damage.
Acknowledgments
We thank D. Bulkeley for invaluable greenhouse assistance, and J.S. Coleman and G.M. Lovett for critical comment. Supported by the NSF (BSR-8817519) (CGJ), the General Reinsurance Corporation (CGJ), John Simon Guggenheim Foundation (CGJ), the Mary Flagler Cary Charitable Trust (CGJ) and Sigma Xi (DAW). Contribution to the program of the Institute of Ecosystem Studies.
References
Ågren, G.I. 1994. The interaction between CO2 and plant nutrition: comments on a paper by Coleman, McConnaughay, and Bazzaz. Oecologia 98:239--240.
Asher, C.J. and D.G. Edwards. 1983. Modern solution culture tech-niques. In Encyclopedia of Plant Physiology. Vol. 15A. Eds. A. Pirson and M.J. Zimmerman. Springer-Verlag, Berlin, pp 94--119. Blackmon, B.G. 1977. Effects of fertilizer nitrogen on tree growth,
foliar nitrogen, and herbage in eastern cottonwood plantations. Soil Sci. Soc. Am. J. 41:992--995.
Braakhekke, W.G. and D.A. Labe. 1990. Steady state nutrition by transpiration controlled nutrient supply. In Plant Nutrition----Physi-ology Applications. Ed. M.L. van Beusiche. Kluwer Academic Publishers, Boston, pp 73--79.
Burgess, D. 1990. White and black spruce seedling development using the concept of relative addition rate. Scand. J. For. Res. 5:471--480. Coleman, J.S., K.D.M. McConnaughay and D.D. Ackerly. 1994.
Inter-preting phenotypic variation in plants. TREE 5:187--190.
Duarte, P., P. Oscarson, J. Tillberg and C. Larsson. 1989. Nitrogen and carbon utilization in shoots and roots of nitrogen-limited Pisum. In Structural and Functional Aspects of Transport in Roots. Ed. B.C. Loughman. Kluwer Academic Publishers, Boston, pp 199--202. Epstein, E. 1972. Mineral nutrition of plants: principles and
perspec-tives. Wiley, NY, 412 p.
Ericsson, T. 1981a. Effects of varied nitrogen stress on growth and nutrition in three Salix clones. Physiol. Plant. 51:423--429. Ericsson, T. 1981b. Growth and nutrition of three Salix clones in low
conductivity solutions. Physiol. Plant. 52:239--244.
Evans, G.C. 1972. The quantitative analysis of plant growth. Black-well Scientific Publications, Oxford, 734 p.
Friejsen, A.H.J. and A. Otten. 1993. Utilization of the ambient concen-tration as a criterion for steady state after exponential growth: some culture experiments with optimum and suboptimum nutrition. Plant Soil 151:265--271.
Hansen, E.A., R.A. McLaughlin and P.E. Pope. 1988. Biomass and nitrogen dynamics of hybrid poplar on two different soils: implica-tions for fertilization strategy. Can. J. For. Res. 18:223--230. Hui-Jun, J. and T. Ingestad. 1984. Nutrient requirements and stress
response of Populus simonii and Paulownia tomentosa. Physiol. Plant. 62:117--124.
Hunt, R. 1982. Plant growth curves: the functional approach to plant growth analysis. Edward Arnold, London, 243 p.
Imo, M. and V.R. Timmer. 1992. Nitrogen uptake of mesquite seed-lings at conventional and exponential fertilization schedules. Soil Sci. Soc. Am. J. 56:927--934.
Ingestad, T. 1970. A definition of optimum nutrient requirements in birch seedlings. I. Physiol. Plant. 23:1127--1138.
Ingestad, T. 1982. Relative addition rate and external concentration: driving variables used in plant nutrition research. Plant Cell Envi-ron. 5:443--453.
Ingestad, T. 1987. New concepts on soil fertility and plant nutrition. Geoderma 40:237--252.
Ingestad, T. and G.I. Ågren. 1988. Nutrient uptake and allocation at steady-state nutrition. Physiol. Plant. 72:450--459.
Ingestad, T. and G.I. Ågren. 1991. The influence of plant nutrition on biomass allocation. Ecol. Appl. 1:168--174.
Ingestad, T. and G.I. Ågren. 1992. Theories and methods on plant nutrition and growth. Physiol. Plant. 84:177--184.
Ingestad, T. and A.-B. Lund. 1979. Nitrogen stress in birch seedlings. I. Growth technique and growth. Physiol. Plant. 45:137--148. Ingestad, T. and A.-B. Lund. 1986. Theory and techniques for steady
state mineral nutrition and growth of plants. Scand. J. For. Res. 1:439--453.
Koch, C.W., W.E. Winner, A. Nardone and H.A. Mooney. 1987. A system for controlling the root and shoot environment for plant growth studies. Environ. Exp. Bot. 27:365--377.
Larsson, S., A. Wiren, L. Lundgren and T. Ericsson. 1986. Effects of light and nutrient stress of leaf phenolic chemistry in Salix dasy-clados and susceptibility to Galerucella lineola. Oikos 47:205--210.
Linder, S. and D.A. Rook. 1984. Effects of mineral nutrition on carbon dioxide exchange and partitioning of carbon in trees. In Nutrition of Forest Trees. Eds. G.D. Bowen and E.K.S. Nambiar. Academic Press, New York, pp 211--236.
McDonald, A.J.S., A. Ericsson and T. Lohammar. 1986. Dependence of starch storage on nutrient availability and photon flux density in small birch (Betula pendula Roth.). Plant Cell Environ. 9:433--438. Miller, B.D. and V.R. Timmer. 1994. Steady-state nutrition of Pinus resinosa seedlings: response to nutrient loading, irrigation and hardening regimes. Tree Physiol. 14:1327--1338.
Pieters, G.A. and M.E. van den Noort. 1985. Leaf area coefficient of some Populus euramericana strains. Photosynthetica 19:189--193. Pieters, G.A. and M.E. van den Noort. 1990. Adaptation of growth rate
of Populus euramericana to light and nitrate proceeds via the vascular system. In Plant Nutrition----Physiology and Applications. Ed. M.L. van Beusichem. Kluwer Academic Publishers, Boston, pp 61--67.
Poorter, H. 1989a. Growth analysis: towards a synthesis of the classi-cal and functional approach. Physiol. Plant. 75:237--244.
Poorter, H. 1989b. Intraspecific variation in relative growth rate: on ecological causes and physiological consequences. In Causes and Consequences of Variation in Growth Rate and Productivity of Higher Plants. Eds. H. Lambers et al. SPB, The Hague, pp 45--68. Potvin, C., M.J. Lechowics and S. Tardif. 1990. The statistical analysis
of ecophysiological response curves obtained from experiments involving repeated measures. Ecology 71:1389--1400.
Tamm, C.O. 1964. Determination of nutrient requirements of forest stands. Int. Rev. For. Res. 1:115--170.
Thorsteinsson, B., E. Tillberg and T. Ericsson. 1990. Levels of IAA, ABA and carbohydrates in source and sink leaves of Betula pendula Roth. Scand. J. For. Res. 5:347--354.
Timmer, V.R., G. Armstrong and B.D. Miller. 1991. Steady-state nutrient preconditioning and early outplanting performance of con-tainerized black spruce seedlings. Can. J. For. Res. 21:585--594. Wait, D.A. 1992. Effect of nutrient addition rates on growth,
chemis-try, and physiology of Populus deltoides, and the feeding preference and consumption of Chrysomela scripta and Lamantria dispar. M.Sc. Thesis. SUNY-ESF, Syracuse, NY, 157 p.
Waring, R.H., A.J.S. McDonald, S. Larsson, T. Ericsson, A. Wiren, E. Arnidsson, A. Ericsson and T. Lohammar. 1985. Differences in chemical composition of plants grown at constant relative growth rates with stable mineral nutrition. Oecologia 66:157--160. Wilson, J.B. 1988. A review of evidence on the control of root:shoot