COMPARISON BETWEEN 2-D AND 3-D STIFFNESS MATRIX
MODEL SIMULATION OF SASW INVERSION FOR PAVEMENT
STRUCTURE
Sri Atmaja P. Rosyidi
Division of Transportation Engineering, Department of Civil Engineering, Faculty of Engineering Muhammadiyah University of Yogyakarta, Yogyakarta, Indonesia
Email : [email protected], [email protected]
ABSTRACT
The Spectral Analysis of Surface Wave (SASW) method is a non-destructive in situ seismic technique used to assess and evaluate the material stiffness (dynamic elastic modulus) and thickness of pavement layers at low strains. These values can be used analytically to calculate load capacities in order to predict the performance of pavement system. The SASW method is based on the dispersion phenomena of Rayleigh waves in layered media. In order to get the actual shear wave velocities, 2-D and 3-D models are used in the simulation of the inversion process for best fitting between theoretical and empirical dispersion curves. The objective of this study is to simulate and compare the 2-D and 3-D model of SASW analysis in the construction of the theoretical dispersion curve for pavement structure evaluation. The result showed that the dispersion curve from the 3-D model was similar with the dispersion curve of the actual pavement profile compared to the 2-D model. The wave velocity profiles also showed that the 3-D model used in the SASW analysis is able to detect all the distinct layers of flexible pavement units.
Keywords: 2-D and 3-D stiffness matrix model, SASW, pavement structure.
INTRODUCTION
The accurate information of the elastic modulus and thickness of the various pavement layers are needed for pavement management system. The Spectral Analysis of Surface Wave (SASW) is a non-destruc-tive method that is based on the dispersion of Rayleigh waves that has been developed to deter-mine the shear wave velocity corresponding to dynamic stiffness and thickness of each layer of the pavement profile. The SASW entirely operates from the surface of the pavement profile without needs of any drillings on the structure. The SASW method has been utilized in different application over the past decade from the advancement and improve-ment of the well-known steady-state technique which was initiated by Jones [1]. In the SASW analysis, the experimental dispersion curve of Rayleigh wave velocity versus wavelength is inversed to estimate the shear wave velocities and their variation with depth. Initially, the simple technique established by Heisey [2] was used to obtain the shear wave velocity profile in the SASW inversion. However, the technique is just sufficient for the profile with material stiffness increasing gradually with depth such as a normal soil profile.
Note: Discussion is expected before June, 1st 2007, and will be published in the “Civil Engineering Dimension” volume 9, number 2, September 2007.
Received 6 February 2006; revised 9 June 2006, 31 August 2006; accepted 25 September 2006.
For the pavement profile a more accurate approach, the stiffness matrix algorithm, is used to generate the theoretical dispersion curve for obtaining best fitting to the experimental dispersion curve. The purpose of this paper is to simulate and to compare the theoretical phase dispersion curve produced by the 2-D and 3-D stiffness matrix model which is employed in the SASW inversion process for the shear wave velocity assessment of an actual flexible pavement structures. Based on the shear wave velocities, the dynamic stiffness property (elastic modulus) of each layer in a pavement profile is also analyzed.
THEORY OF SPECTRAL ANALYSIS OF
SURFACE WAVE
variation of stiffness with depth. This phenomenon is termed dispersion which the frequency is dependent on Rayleigh wave velocity. The ability of detecting and evaluating the depth of the medium is influenced by the wavelength and the frequency generated. The shorter wavelength of high frequency penetrates the shallower zone of the near surface and the longer wavelength of lower frequency penetrates deeper into the medium.
The range of wavelength to be used as a guide for the receiver spacing can be estimated from the shear wave velocities of the material anticipated at the site from:
velocity predicted from soil classified at the site or the initial information from other site investigation works. The high and low frequency waves groups needed can be generated by various transient sources with different weights and shapes. Rosyidi [3] and Rosyidi et al. [4] studied and reported the effect of various weights and shapes of sources to generate the appropriate wave frequencies.
The experimental dispersion curve of phase velocity and wavelength may be developed from phase information of the transfer function at frequency ranges satisfying the coherence criterion. In addition, most of the researchers apply the Heisey's filtering criteria [2] with a wavelength greater than ½ and less than 3 of thereceiver spacing which is able to capture an effective part of the individual dispersion. A travel time between the receivers for each frequency can be calculated by:
φ
is the phase difference in degrees at a given frequency. The distance of the receiver (d) is a known parameter. Therefore, Rayleigh wave velocity (phase velocity) at a given frequency (VR) is simply obtainedby:
( )
f
t
d
V
R=
(3)and the corresponding wavelength of the Rayleigh wave, LR may be written as:
( )
V
f
( )
f
f
L
R=
R (4)ANALYTICAL MODELING
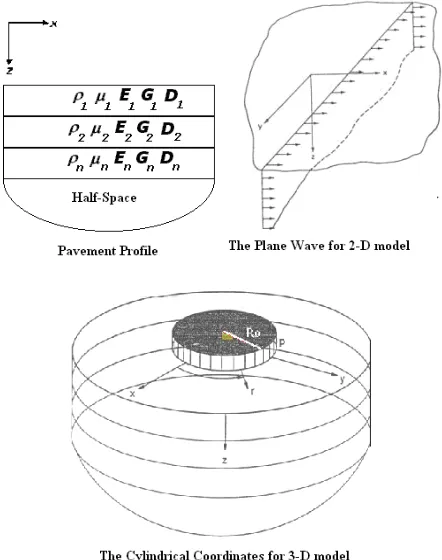
The actual shear wave velocity of the pavement profile is produced from the inversion of the composite experimental dispersion curve. In the inversion process, an automated modeling analysis is used where a set of homogeneous layer profile extending to infinity in the horizontal direction is assumed. The last layer is usually taken as a homogeneous half-space. Based on the initial profile, a theoretical dispersion curve is modeled using the stress wave propagation theory and employing the dynamic stiffness matrix method [5]. Modeling of the SASW analysis can be accomplished with two approaches: considering only plane generalized Rayleigh waves that is called the two dimensional model, or calculating for three directions of wave propagation effect, called the three dimensional model. In the 2-D approach, the Rayleigh wave is assumed as simple plane wave which horizontally propagates along the surface of a multi-layered medium in x direction and vertically penetrates into the medium (Figure 1). The plane in the x-y axis is the boundary of the elastic half space and z is positive downward. The Rayleigh wave displacement of the 2-D model is calculated in the direction of x
and z while it is independent in y direction. Whereas, the 3-D model simulates the Rayleigh wave traveling along the surface in radian function which is expressed in cylindrical coordinates and decaying with the depth as a function of z direction. The dynamic response in the pavement profile is measured on the surface at distance r from an impact source which is a vertical circular disk loaded at the center of the system (Figure 1). The displa-cement of Rayleigh wave propagation is described in the spatial domain and energy transmission in the radial direction due to vertical oscillation of a circular disk on the surface of medium. Using Fourier
transform and phase different method (Equation 2 to 4), the displacement of Rayliegh wave in spatial domain from the 2-D and 3-D model is then simulated to the phase velocity in frequency domain which is usually called as a theoretical dispersion curve. In the SASW analysis, a theoretical dispersion curve is ultimately matched with the experimental dispersion curve in the lower Root Mean Square (RMS) error of an optimization technique [6].
Two-Dimensional Model
propagation allows the stresses and displacements at the top of the layer of the pavement profile to be related to those at the bottom as a function of vibration and the wave number (or wavelength) through a dynamic stiffness matrix [5]. The stiffness matrices of the individual layers (as well as that of a half space) can be assembled following the normal rules of matrix structural analysis leading to a system equations of the form:
P = K U (5)
where K is the dynamic stiffness matrix of the complete pavement materials, U are the amplitudes of the displacements at the various layer interfaces (starting at the free surface) and P is the vector of applied loads at these interfaces. The terms of K are function of the frequency, ω, and the wave number, k. In order to have a non trivial displacement without any external loads the determinant of K must be equal to 0. The terms of the matrix K is a tridiagonal matrix of 2 × 2 submatrices and the determinant can be easy evaluated for any value of k and a fixed ω.
The solution technique for arbitrary loading requires the time history of the specified load forces to be decomposed into its different frequency using a Fourier transform. For each frequency, any given load vector is expanded in a double integral Fourier transform in the two horizontal directions for Cartesian coordinates as follows:
P
(k, z, ω) =∫ ∫
−+∞∞P
(x,
z,
t)e
−iωxdt
dx
(6)where
P
is given load vector in the wave number domain. The displacement in the wave number domain is then solved by:(
k,
z,
ω
)
K
P
(
k,
z,
ω
)
U
=
−1 (7)The actual displacements are computed as:
U (x, z , t) =
∫∫
+∞(
)
∞−
U
k,
z,
ω
e
dk
d
ω
2
1
iktπ
(8)where U is the actual displacement in time-space domain.
Three-Dimensional Model
In the 3-D model, displacements and stresses (or traction) on a horizontal surface is expanded in Fourier series in the circumferential direction and in terms of cylindrical function (Bessel, Neuman or Hankel functions) in the radial direction as shown by Kausel and Röesset [5]. For application to cases with as axisymmetric loading only one term of Fourier series is needed (the 0 term), and the radial and vertical displacements (U and W) can be expressed by:
U( r ) =
∫
∞=0 k
)
kr
(
)
k
(
u
J
R
J
dk
qR
1 1 ; and W ( z )=∫
∞=o
k 1 o 0
dk
kr
J
kR
J
w
qR
(
)
(
)
(9)where J0 and J1 are the zero and the first order
Bessel function, k is the wave number, r is the radial distance from the source, R is the radius of the disk and q is the magnitude of the uniformly distributed load.
u
, andw
are functions of k and can be obtained finding the solution to Equation 5 for a harmonic load at the surface with wave-length 2πk.Figure 1. The Plane Wave Propagation for 2-D Model and the Cylindrical Coordinate for 3-D Model Concept
The solution of the problem requires assembling the dynamic stiffness matrix of the pavement profile, solving it for various values of k (wave number) and evaluating the integrals of Equation 10. The compu-tation is relatively time consuming where there is a large number of layers and the integration requires special precautions if there is no damping in the pavement materials. An alternative solution can be obtained by expanding the terms of the dynamic stiffness matrix of a layer in terms of k and keeping only up to second degree items. The stiffness matrices of each layer and of the total profile can be expressed in the form:
K = A k2 + B k + C – Ω2 M (10)
modes of propagation are now the solution of a quadratic eigenvalue problem. Kausel and Röesset [5] had shown that the displacements
u
, andw
, in Equation 9, can be written as:∑
+=
−
=
2n 2 1i i1 i1
k
ik
2k
2ik
w
u
u
)
(
; and∑
+=
−
=
2n 2 1i i 2 2i
2 1 i
k
k
k
k
w
w
)
(
(11)For a system of n layers over a half-space, where ui1
and wi1 denote the horizontal and vertical
displacement at the surface in the ith mode, can be
found from the corresponding mode shape. By substituting Equation 11 to 9, the integral can be evaluated analytically in closed form [5]. This solution is particularly convenient when dealing with a large number of layers as in the case when it is desired to obtain a detailed variation of pavement properties.
PAVEMENT MATERIAL STIFFNESS
The dynamic elastic modulus of the pavement material can be determined using the shear wave velocities from the following equations [7]:
E =
γ
⋅
(
1
+
ν
)
g
V
2
2
s (12)
where E is the dynamic elastic modulus, ν, the Poisson ratio, Vs, shear wave velocities, g,
gravita-tional acceleration and γ, total unit weight of the material. Rosyidi [3] has explained that the modulus parameter of material is constant below a strain of about 0.001% and is equal to the maximum level. In this strain range, the material is typically inde-pendent of strain amplitude [8].
EXPERIMENTAL WORK OF SASW AND
DCP TEST
An impact source on a pavement surface is used to generate Rayleigh waves at a point. These waves are detected with two acceleration receiver locations and the signals are recorded using a spectrum analyzer for post processing (Figure 2). Several configurations of the receiver and the source spacing test are required in order to sample different depths. Short receiver spacing of high frequency (short wave-length) are used to sample shallow layers while long receiver spacing of low frequency (long wavelengths) is used in sampling deeper layers. For detecting the pavement profile, the receiver spacings of 5, 10, 20, 40, 80 and 160 cm were implemented. The high frequencies of the sources were generated from the ball bearing weight of 5 to 20 g while the lower
frequencies were produced from hammer weight of 3 to 5 kg. All the data collected are transformed using fast Fourier transform (FFT) to frequency domain by a spectrum analyzer. Two functions in frequency domain between the two receivers are of great importance: (1) the coherence function, and (2) the phase information of the transfer function spectrum. The coherence function is used to visually inspect the quality of signals being recorded in the field. The transfer function spectrum is used to obtain the relative phase shift between the two signals in the range of the frequencies being generated as shown in Figure 3. By repeating the procedure outlined by Equation (2) through (4) for each frequency value, the Rayleigh wave velocity corresponding to each wavelength is evaluated and the experimental dispersion curve is generated.
Figure 2. Field Measurement Configuration
Figure 3. The coherence and the Transfer Function Spectrum
penetro-meter (DCP) is also employed as a rapid means of assessing the sequence, thickness and the in-situ bearing capacity of the unbound layers and the underlying subgrade of the pavement structure. The DCP uses a 8 kg steel mass falling 20 inches (50.8 cm) striking an anvil causing a penetration of 1.5 inches (3.8 cm) from a cone with a 60° vertex angle seated in the bottom of a hand augered hole. The blows required to drive the embedded cone a depth of 1-3/4 inches have been correlated to N values of the Standard Penetration Test (SPT). The depth of cone penetration is measured at selected penetration or hammer-drop intervals, and the soil shear strength is reported in terms of DCP index. The relationship between the DCP and the field California Bearing Ratio (field-CBR) can be determined using the model derived by Klyen and van Heerden [9]. The result obtained in their study can be written as follows:
log CBR = 2.628 – 1.273 log (DCP) (13)
where DCP is the penetration mm/blows. The elastic modulus of pavement material can be calculated using Shell' formulation [10] as follows:
Edynamic = 1,500 CBR (in Psi) (14)
RESULTS AND DISCUSSIONS
In order to show the dispersion result obtained from the 2-D and 3-D analysis, the actual pavement profile was studied. The road profile consists of an asphalt layer (70 mm thick), and a base of crushed aggregate (53 mm thick) over a subgrade. Thick-nesses of the pavement layers are shown in Figure 5. The experimental dispersion curve of actual pave-ment profile was constructed using the experipave-mental data from SASW test which is presented in Figure 4. In order to simulate the 2-D and 3-D model of dispersion curve, the starting model parameters (SMP) were then generated. The starting model parameters are employed to facilitate the inversion process and to avoid the convergence to a local minimum in the inversion problems ([3] and [6]). The starting model parameters are constructed using the required information which include Poisson's ratio, mass density, the shear wave veloci-ties, material damping ratio and layer thicknesses. If the above information from the previous testing in the site are not available, they can be obtained with reasonable assumption. The starting model para-meters of a pavement profile was divided into three layers of pavement structure, each layer was still separated into smaller layers for a detailed model of a pavement profile. The pavement layer properties of the starting model parameters are presented in Table 1.
Table 1. The Starting Model Parameters for Gene-rating 2-D and 3-D Model
Thickness Shear Wave Velocity
Poisson Damping Ratio
Figure 4. Comparison Between the 2-D, 3-D and the Experi-mental Dispersion Curve
Based on the starting model parameters, the theoretical dispersion curve was simulated using 2-D and 3-D stiffness matrix algorithm. Both theoretical curves were then compared to the experimental data and modifying the assumed properties to improve the fit. Figure 4 shows the theoretical dispersion curve of the 2-D and 3-D model compared to the experimental dispersion curve of the actual pave-ment profile. The result of 2-D model with the first mode appears to be in good agreement with the experimental data for wavelength up to 0.2 m. The phase velocities obtained with 3-D model are in better agreement with the experimental data. The phase velocity from 3-D model almost agrees well to all of wavelengths. It can be validated with the error measurement of root-mean-square (RMS) which is 34.42 and 17.63 m/s for 2-D and 3-D model respectively. It shows that the 3-D model of the dispersion curve is more fitted to actual profile than the 2-D model.
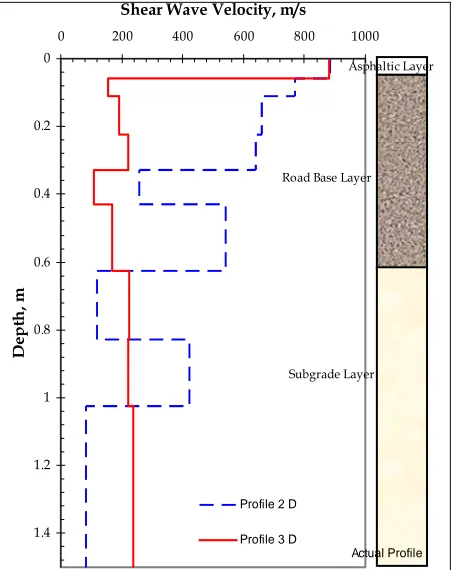
wave velocities profile is extremely different with the 3-D profile. The 2-D model can not successfully detect the interface between the asphaltic and road base layer. It can be explained that when the modulus of underlying layer is smaller than upper layer (pavement profile), the propagation of surface waves are recorded at maximum frequency (higher mode) which there are no real wave numbers occurred. It is caused by interferences of the refraction and refraction of the body wave in the interface. Consequently, it needs the determining the complex eigenvalues leading also to complex phase velocity of surface waves. The 2-D model does not provide algorithm for above case.
Shear Wave Velocity, m/s
D
Figure 5. Comparison the Shear Wave Velocities Between the 2-D and 3-D Model
Table 2 shows the average dynamic elastic modulus that is calculated from the shear waves profile of the 2-D and 3-D using Equation 12 compared to the elastic modulus of the actual pavement profile from the DCP test. The difference of the elastic modulus between the 3-D model with the analytical result for road base is 6.45 % and for subgrade layer is 1.45% which are better than the 2-D model result.
Table 2. Comparison the Elastic Modulus Between the 2-D and 3-D Model of SASW Measure-ment and the DCP test-Shell's Analytical Formulation
The theoretical dispersion curve of the 2-D and 3-D dynamic stiffness matrix model was simulated and compared in the SASW inversion process for pave-ment structures. The 3-D model produces a better theoretical dispersion curve compared to the 2-D model. Compared to the actual pavement profile the 3-D model gives an RMS value of 17.34 m/s. The use of the 3-D model can produce the true wave propagation phenomena involved in the SASW test for irregular stiffness profile with sharp changes in the properties of the layers such as most pavement structure. Good agreement is also obtained in the measurement of dynamic elastic modulus using the 3-D model SASW inversion as compared to the actual profile from the DCP test. Ultimately, this study shows that the capability of the 3-D dynamic stiffness model to be used in the inversion process for characterizing the stiffness of the pavement layers in terms of shear wave velocity for pavement design and evaluation.
Acknowledgments
Part of this work was supported by the Kompetisi Penelitian Dosen (KPD) Grant from Muhammadi-yah University of Yogyakarta and the Ministry of Science, Technology and Environment, Malaysia through IRPA Grant No.09-02-02-0055-EI151A. Interesting discussion was conducted with Prof. Mohd Raihan Taha, Ph.D. and Mr. Khairul Anuar Mohd. Nayan at the National University of Malay-sia, and also interactive lecture of Prof. Sung Ho Joh, Ph.D. at Chung Ang University, South Korea. The author wishes to express their appreciations for their support.
REFERENCES
1. Jones, R.B., In-situ measurement of the dynamic properties of soil by vibration methods, Geotech-nique, 8 (1), 1958, pp, 1-21.
2. Heisey, J.S., Stokoe II, K.H., and Meyer, A.H., Moduli of pavement systems from Spectral Analysis of Surface Waves, Transportation Research Record, 852, 1982, pp, 22-31.
3. Rosyidi, S.A., Evaluation of the Dynamic
Stiff-ness of Pavement Layer using SASW Method,
M.S. Thesis, Department of Civil and Structural Engineering, the National University of Malay-sia, 2004.
4. Rosyidi, S.A., Nayan, K.A.M., Taha, M.R., and Mustafa, M.M., The Measurement of Dynamic Properties of Flexible Pavement Using
Spectral-Analysis-of-Surface-Wave (SASW), Proceeding
of 5th Symposium on Inter-University
5. Kausel, E. and Röesset, J.M., Stiffness matrices for layered soils, Bulletin of the Seismological Society of America, 71 (6), 1981, pp, 1743-1761.
6. Joh, S.H., Advance in Interpretation and Analy-sis Technique for Spectral-AnalyAnaly-sis-Of-Surface-
Spectral-Analysis-Of-Surface-Waves (SASW) Measurements, Ph.D.
Disserta-tion, Department of Civil Engineering, the University of Texas at Austin, 1996.
7. Yoder, E.J. and Witczak, M.W., Principles of Pavement Design, John Wiley & Son Inc., New York, 1975.
8. Nazarian, S. and Stokoe, K.H.II., In Situ Deter-mination of Elastic Moduli of Pavement Systems by Spectral-Analysis-of-Surface-Wave Method (Theoretical Aspects), Research Report 437-2, Center of Transportation Research, Bureau of Engineering Research, the University of Texas at Austin, 1986.
9. Klyen, E.G. and van Heerden, Using DCP Soundings to Optimize Pavement Rehabilitation, Proceeding of Annual Transportation Conven-tion, Report LS/83 Materials Branch, Transvaal Roads Department, South Africa, 1983.