Model Development of Rainwater Management for Agriculture
Decision Support System in Semi Arid Area
Susilawati, C.L.1 and Tunggul, S.2
Abstract: Land cultivation for agricultural purposes in semiarid area is usually carried out only once a year specifically during the rainy season. The condition is even worse since it is not without the risk of failure because of dry-spell or water-logging. To cope with this situation, the researchers developed a model of Rainwater Management for Agriculture Decision Supporting System (RMA-DSS). The objective of this RMA-DSS is to facilitate the decision making to build water infrastructure. Using this program it is hoped that sufficient water supply for specific crops with correct planting time can be guaranteed, which in turn will optimize harvest. The model consists of three parts, namely, rainfall-runoff-infiltration model, crop water requirement-irrigation-drainage model and rainwater management for agriculture model. The Models are
designed using Microsoft Excel’s Macro Visual Basic and finalized with Visual Basic language program for operating spatial database of map object and non spatial database.
Keywords: Rainwater management, agriculture, decision support system, model development.
Introduction
Semiarid area usually undergoes three to five months of rainy season and dry season usually lasts longer. Semiarid agriculture basically relies merely on rainwater during the rainy season. This one-season agriculture is even worse off because it faces a serious problem of disorderly distribution of rainy days. This condition may cause the occurrences of water logging and dry-spells that can result in the decrease of harvest or even in the withering of crops [1, 2].
To cope with this situation, the researchers develop a model of Rainwater Management for Agriculture Decision Supporting System (RMA-DSS). The object-tive of RMA-DSS is to facilitate the decision making to build water infrastructure. In planning stage, RMA-DSS is developed to provide information concerning the details of location of RMA infras-tructure (a construction for rainwater management for agriculture). This includes planning of water-traps on natural drainage gullies as well as dug wells and the optimum breadth of cultivatable land that can be served by the infrastructure.
1 Civil Engineering Department, Widya Mandira Catholic
Uni-versity, Kupang, West Timor, INDONESIA.
2 Natural Resources and Environment Engineering Faculty,
Brawi-jaya University, Malang, East Java, INDONESIA.
Note: Discussion is expected before November, 1st 2011, and will be
published in the “Civil Engineering Dimension” volume 14, number
1, March 2012.
Received 21 April 2010; revised 12 June 2011; accepted 17 August 2011.
In operation stage, the RMA-DSS is developed to provide information concerning the sufficiency of water for agriculture, irrigation, agricultural drai-nage and planting pattern. The problems in developing this model are:
1. The relationship between rainfall-runoff-infiltra-tion, where the rainfall and surface runoff can be trapped by water trap or check dam series that enable it to permeate into the soil as recharge water table.
2. The relationship between crop water requirement
and irrigation to overcome dry-spell and the need for drainage to overcome water logging.
3. To develop rainwater management for
agri-culture, that is to guarantee the sufficiency of water supply for agriculture with an accurate and optimum measure.
RMA-DSS Model Development Concept
The development of RMA-DSS model includes three components, namely database/information, model, and user interface. The relationship among the three components is illustrated in Figure 1.
Database (acquisition, management and pro-cessing)
User interface
Database (acquisition, management, processing) Model (analysis,
simulation, optimization)
Figure 1. Main Components of Decision Supporting System [3]
Legend:
Data on daily rainfall which is entered into the worksheet of Excel program for the analysis of surface runoff (RO) and effective rainfall (Re) calculation
Data on monthly climate which is entered into CropWat program in order to find the volume of ETo, further entered into Excel program worksheet
Excel program that contains information concerning database and data analysis. In this program one can access spatial program
CropWat program, which is a decision support system developed by the Land and Water Development Division of FAO
Spatial programs (Map Object and Arc View GIS), which are developed by ESRI (Environmental Systems Research Institute)
The required data are categorized into two groups, namely data concerning the capacity of water supply and data on agricultural practices. Data concerning water supply include:
1. Climatology, namely: temperature, humidity,
wind velocity, and the length of solar radiation. 2. Topography to determine the breadth of
catch-ment area for the whole system and runoff coefficient, and
3. Soil data to determine the coefficient of water percolation or water potential that can be per-colated into the soil.
These data are managed and processed by using spatial program respectively: ArcView GIS 3.3 and Map Object, which is developed by ESRI (Environ-mental Systems Research Institute). These pro-grams are used to obtain information on the size of surface runoff coefficient, infiltration coefficient, the breadth of cultivation area, the breadth of rain catchment area, and the relationship between the depth and the volume of inundating water in RMA infrastructure (utilizing Digital Elevation Model – DEM). From this data the researcher performed a storage analysis of surface water that turns into groundwater which becomes the supply for agri-culture. From the analysis result of water require-ment for agricultural irrigation and drainage in comparison to water supply, we can perform further analysis on water balance in order to compute an optimum size of cultivatable land. Data on agri-cultural practices include:
1. Plant specification in order to find plant coeffi-cient and growing duration.
2. Established or referral Evapotranspiration which is computed with CropWat model computer [5]. 3. Effective rainfall, and
4. Planting pattern and the breadth of agricultural area.
These data are managed and processed using CropWat, which is a decision support system deve-loped by the Land and Water Development Division of FAO. Its main functions are [5]: to calculate: reference evapotranspiration, crop water require-ments, and crop irrigation requirements; to develop irrigation schedules under various management conditions and scheme of water supply; and to evaluate rain-fed production and drought effects and efficiency of irrigation practices. This program in the model is used to calculate the potential evapo-transpiration, ETo. The information is then entered into Excel program for the purpose of analysis of irrigation and drainage water requirement.
Model (analysis, simulation, optimization)
Models used in RMA-DSS cover:
1. Model 1: Rainfall-runoff-infiltration model (Equa-tions 1 and 2) to determine the water availability.
RO = x I x A [6] (1)
Inf = x I x A [7] (2)
In which, RO is the runoff, Inf the infiltration, the run off coefficient, the infiltration coefficient,
I the rain intensity, and A the rain catchment area.
2. Model 2: Plant water
requirement-irrigation-drainage model (Equations 3 through 6) to deter-mine the agricultural water requirement.
ETcrop = kcET0 [5-7] (3)
ET0 = Kp x Epan [6, 7] (4)
Irr = ETcrop + P - Re [7] (5)
D = Re - ETcrop [8] (6)
In which, ETcrop is crop evapotranspiration, kc crop coefficient, ET0 potential evapotranspiration, Kp pan coefficient, Epan open evaporation of pan, Irr irrigation requirement, P soil percolation data, Re effective rainfall, and D the drainage require-ment.
3. Model 3: Rainwater management for small scale
agriculture model (Equation 7) to determine the optimum field area.
V = RO + D – Epan P [8, 9] (7)
In which, V is volume of water absorption
The frameworks of Model 1, Model 2, and Model 3 (Figures 3, 4 and 5 respectively) are written in Microsoft Excel [4]. Data that are needed in Model 1 are the data on rainfall and topography/land use in order to find out the runoff coefficient, , and the data on
soil in order to find out the infiltration coefficient, .
From the data on rainfall and runoff coefficient, , one can calculate the quantity of runoff, RO, using Equation 1, and from data on infiltration coefficient, , and the data on rainfall, one can calculate the quantity of water that infiltrates into the soil and can be used for plants, Inf/Re, which is computed using Equation 2 (Figure 3).
Rainfall
Figure 3. Model 1 Rainfall–Runoff–Infiltration Model [4]
Data needed in Model 2 (Figure 4) are:
1. Data on plants and planting patterns that pro-vide information on plant coefficient and plant-ing time,
can find information on the amount of potential evapotranspiration, ETo, which is computed using Equation 3,
3. Data on soil that can be found in spatial model
provide information on infiltration coefficient, , and the volume of percolation. From the infor-mation on the extent of ETo and plant coefficient, one can determine the water requirement for plants, ETcrop which is computed using Equation (4). From the information on ETcrop, Re, and P, one
Figure 4. Model 2: Crop Water Requirement – Irrigation – Drainage Model [4]
Data that are needed in Model 3 (Figure 5) are data on topography/land use which are found in spatial model, that provide information on the breadth of
catchment area and infiltration coefficient, , on the runoff, RO, from Model 1 and on the volume of water required for the crop, D, and irrigation water requirement, Irr, in Model 2. From this information one can compute the volume of inundation in RMA infrastructure building, or the volume of water that can be infiltrated into the soil as groundwater recharge, V, which can be calculated using Equation (7).
Absorption Water Volume: V
Figure 5. Model 3: Rainwater Management for Agricul-ture Model [4]
User Interface
The appearance of the RMA-DSS menu is illustrated in Figure 6.
Figure 6. RMA-DSS in Semi Arid Area Menu
The data worksheets consist of worksheet for rainfall data, I, evaporation, Epan, soil data, P, area, A, and crop coefficient, kc. The rainfall data worksheet, I, is the daily rainfall data for one year. The evaporation data worksheet, Epan, measures the evaporation data from the evaporation pan. In order to determine reference operation ETo, one has to multiply the data from the evaporation pan with pan coefficient that can be chosen from 1 to 2.1, with the interval of 0.1 [4]. Potential evapotranspiration, ETo, that is infiltrated into the soil presumably effective during the rainy season and available for watering crops. In this worksheet one can also find the catchment area for check-dam ponds and agricultural field from spatial analysis. All data in these worksheets are computed by Visual Basic program that operates on spatial data [11]. The data of area worksheet, A, also contains the catchment area for every planned check dam pond. It contains crop coefficient data for crop planting period [6].
stored in the check-dam ponds. The infiltration calculation gives the result of the amount of water that can be used for crops or the effective rainfall [12]. All these worksheets are equipped with gra-phical performance sheets (RO-Inf chart – Figure 7).
14.8
Jan Peb Mar Apr Mei Jun Jul Aug Sep Okt Nov Des
R
Figure 7. Runoff – Infiltration Chart (RO-Inf Chart)
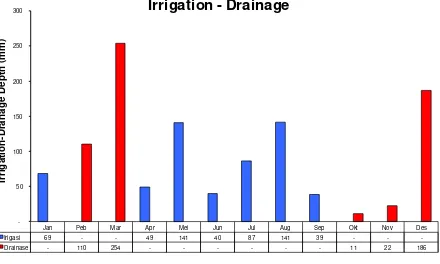
The RMA-DSS Model 2 consists of crop water requirement calculation worksheet ETcrop, which is displayed in the daily format for one year, and irrigation, Irr, and drainage requirement, Irr-D, which displays the monthly format for one year. In the ETcrop worksheet one can find the cropping pattern option and Excel will give the values of ETcrop for every crop planting season through the macro program. These worksheets are also accompanied by graphical performance (Irr-D Chart – Figure 8).
Jan Peb Mar Apr Mei Jun Jul Aug Sep Okt Nov Des
Irigasi 69 - - 49 141 40 87 141 39 - -
-Figure 8. Irrigation – Drainage Chart (Irr-D Chart)
In the RMA-DSS Model 3 one can find the discharge flow worksheet indicating the amount of water that can be stored in the check-dam pond, V. This worksheet is equipped with a chart, V chart (Figure 9). The calculation is in the daily format, while the chart is in monthly format.
Beside the discharge worksheet, one can also find the water balance worksheet for the check-dam pond, NA check-dam, that indicates the potential water that percolates into the soil, spilled water, and stored water. This worksheet is also equipped with a chart, NA check-dam chart (Figure 10).
3896
Jan Peb Mar Apr Mei Jun Jul Aug Sep Okt Nov Des
D
Check-Dam Discharge / Volume (m^3/month)
Figure 9. Volume of Water in Check-Dam Pond
0
Jan Peb Mar Apr Mei Jun Jul Aug Sep Okt Nov Des
V
Water Balance in the Check-Dam Pond
Figure 10. Water Balance in the Check-Dam Pond
The field water balance worksheet, NA field, informs the water balance in the soil which can be explored by digging a well. This worksheet is also equipped with a chart (Figure 11). There is also a solution option in this water balance worksheet. If one has to solve the problem of optimized potential area of agricultural field in relation to the sufficiency of groundwater supply, user just clicks the solution icon, and automatically the solution is given.
2,773
Jan Peb Mar Apr Mei Jun Jul Aug Sep Okt Nov Des
W
Water Balance in the Agricultural Field
Figure 11. Water Balance in the Agricultural Field
Conclusion
References
1. Susilawati, C.L., Analisa Produksi Tanaman
Pangan di UPT Weberek, Timor Timur, Seri Kajian Ilmiah Vol.: 9 No. 1, ISSN: 0853-0707, ISBN: 979-8366-30-1, Universitas Katolik Soegija-pranata, Semarang, 1999.
2. Mark, F., Fox, M., Persson, P., Gunn, R.J., Water Harvesting for Upgrading of Rainfed Agriculture, Problem Analysis and Research Needs, SIWI Report 11 Published 2001 by Stockholm Inter-national Water Institute, 2001, http://www.siwi. org/documents/Resources/Reports/Report11_ Water_ Harvesting_for_Upgrading_Rainfed_Agriculture_2 001.pdf
3. Larry, B., Decision Support Systems: Role in Planning and Management, Ford Collins, CO,
2005.
http://watercenter.colostate.edu/CSUSemi-nars/Brazil%20 Decision%20Support%20system.
mht.pdf
4. Susilawati, C.L., Pengelolaan Air Hujan untuk Pertanian pada Pulau Kecil Daerah Kering Indonesia, Gita Kasih, Kupang, 2011.
5. Clarke, D., Crop Wat for Windows: User Guide, FAO Irrigation and Drainage Paper No. 46, Rome, 1998.http://www.fao.org:80/WAICENT/FAOINFO/A GRICULT/AGL/aglw/CROPWAT.htm.
6. Linsley, R.K., Kohler, M.A., Paulhus, J.L.H., Her-mawan, Yandi, Hidrologi Untuk Insinyur, Edisi III, Erlangga, Jakarta, 1989.
7. Suyono, S. (Editor), Hidrologi Untuk Pengairan, PT Pradnya Paramita, Jakarta, 1999.
8. Ritzema, H.P., (Editor-in-Chief), Drainage Prin-ciples and Aplications, ILRI Publication 16 second edition (completely revised), The Netherlands, 1994.
9. Wilson, EM., Marjuki, A., Hidrologi Teknik, Edisi Keempat, Erlangga, Jakarta, 1993.
10.Mc Cuen, Tabulated Values of Rational Method of Runoff Coefficient. http://www.utd.edu/~brikowi/ Teaching/Applied_Modeling/SurfaceWater/Lecture Notes/Rational_Method/Runoff_Coefficient.html, 2004.
11.Tunggul, S., Sistem Informasi dan Model Simulasi untuk Pengelolaan Daerah Aliran Sungai dan Manajemen Banjir, Disertasi ITB, Bandung, 2005.
![Figure 1. Main Components of Decision Supporting System [3]](https://thumb-ap.123doks.com/thumbv2/123dok/3649495.1465315/2.595.118.465.275.544/figure-main-components-decision-supporting.webp)
![Figure 3. Model 1 Rainfall–Runoff–Infiltration Model [4]](https://thumb-ap.123doks.com/thumbv2/123dok/3649495.1465315/3.595.313.538.564.673/figure-model-rainfall-runoff-infiltration-model.webp)
![Figure 4. Model 2: Crop Water Requirement Drainage Model [4] – Irrigation –](https://thumb-ap.123doks.com/thumbv2/123dok/3649495.1465315/4.595.58.282.197.400/figure-model-crop-water-requirement-drainage-model-irrigation.webp)