1
DETERMINANT OF DIGITAL DIVIDE IN INDONESIA:
THE CASE OF SOUTH SUMATRA PROVINCE, INDONESIA
Mery Yanti
Department of Sociology, Faculty of Political and Social Sciences, University of Sriwijaya, Indonesia Alamsyah
Department of Public Administration, Faculty of Political and Social Sciences, University of Sriwijaya, Indonesia
ABSTRACT
Penetration of information and communication technology in Indonesia is producing new development issue. Popularly, it is now recognized as the digital divide. In the case of Indonesia, it is urgent to explain the digital divide phenomenon because for governments it was so expensive to introduce internet in the society. Based on this fashion, this article is attempting to explain the characteristics and digital divide determinants in Lubuk Linggau city, Baturaja city, and Palembang city. We are using quantitative approach and survey design methods to organize research process. Our respondents are individuals who are aged 15 years old or more. They were selected by multistage random and simple random sampling methods. Quantitative data is analyzed by using SPSS Version 17, especially using descriptive statistics (frequency distribution and cross tabulation). The results showed that there are digital divide between cities in South Sumatra Province. Although internet began to trigger productive activity among respondents, but internet penetration in South Sumatra Province had not been yet significant. Respondents do not have economic and social reasons, but they have economic and social benefits when they used ICTs device, especially internet. Finally, we proposed the gap meaning as one of aspect of digital divide concept.
Keywords: digital divide, determinant, South Sumatera, Indonesia
I. INTRODUCTION
Information and communication technology (ICT) is always synonymous with computers, mobile phones, and internet. According to Association of Indonesian Computer Entrepreneurs (APKOMINDO), penetration of computers (desktops, laptops, and notebooks) in Indonesia has reached 4 percent of total populations of Indonesia (http://www.swa.co.id). This number is relatively small when compared to the mobile phone users (250 million people) (http://inet.detik.com) and internet subscribers (50 million) (http://mizan.com).
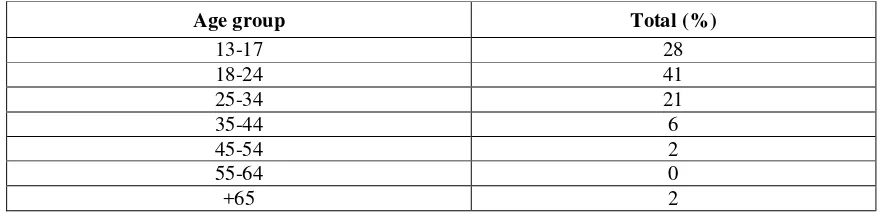
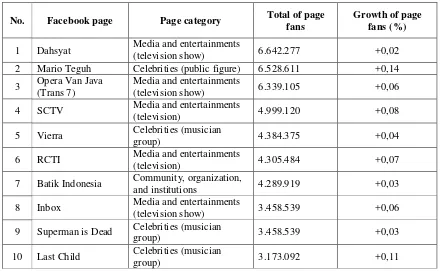
2 networking (71%) rather than sending/receiving email (51 %); (d) Facebook was the most popular social media site in Indonesia. In terms of age, Facebook users composition was predominantly by youth (see, Table 1). Meanwhile, the site of salingsilang.com (http://fbdir.salingsilang.com) shows Facebook pages that are most in demand by netizens in Indonesia (see, Table 2). Table 2 show the domination of entertainment world (celebrities, television shows, and music) favored by Facebook users in Indonesia.
While they are taking from different sources, there is a common thread that connecting Table 1 and Table 2, that is: youth and entertainment. Both of these words complement each other. Youth are identical with entertainment (leisure). Entertainment is identical with youth. Related to digital divide debates on a global level, internet subscribers data in Indonesia show that not all Indonesian people are included in “the have” (accessing and using internet). It is describing the early symptoms of digital divide phenomenon in Indonesia. It is triggering all of us to explore it further so that we have more understanding towards relationship between ICTs and Indonesian people at regional level.
Table 1 Composition of Facebook users in Indonesia by age
Age group Total (%)
13-17 28
18-24 41
25-34 21
35-44 6
45-54 2
55-64 0
+65 2
3 Table 2 The most popular Facebook page among Facebook users in Indonesia
No. Facebook page Page category Total of page fans
Growth of page fans (%)
1 Dahsyat Media and entertainments
(television show) 6.642.277 +0,02 2 Mario Teguh Celebrities (public figure) 6.528.611 +0,14 3 Opera Van Java
(Trans 7)
Media and entertainments
(television show) 6.339.105 +0,06 4 SCTV Media and entertainments
(television) 4.999.120 +0,08
5 Vierra Celebrities (musician
group) 4.384.375 +0,04
6 RCTI Media and entertainments
(television) 4.305.484 +0,07
7 Batik Indonesia Community, organization,
and institutions 4.289.919 +0,03 8 Inbox Media and entertainments
(television show) 3.458.539 +0,06 9 Superman is Dead Celebrities (musician
group) 3.458.539 +0,03
10 Last Child Celebrities (musician
group) 3.173.092 +0,11
Source: http://fbdir.salingsilang.com, accesed in 18 December 2012
In Indonesia, it is urgent to explain the digital divide because it is expensive for national government to introduce internet to the public. Ministry of Information and Communications, Republic of Indonesia, for example, has created MPLIK (Car for District Internet Service Center) program. In South Sumatra, South Sumatra province government has launched free Wi-Fi area program at several locations in Palembang (capital city of South Sumatera Province). In Ogan Komering Ulu, precisely in Baturaja (capital city of Ogan Komering Ulu region), local government has also launched free Wi-Fi area program in numerous public spaces. However, these actions do not integrate with promoting economic growth and digital divide alleviating efforts. There is notion that Indonesian government (national and local government) just follows citizens’ movement who are more adaptive in adopting ICT developments.
4 determinants of digital divide in South Sumatra Province, particularly in the Lubuk Linggau city, Baturaja city, and Palembang city.
II. RESEARCH METHODS
We are using quantitative-qualitative approach to explain digital divide in South Sumatera Province. Quantitative approach was interpreted into survey method and descriptive statistics. Qualitative approach was translated into logic of positivism and interpretation. Logic of positivism means that we have to build conceptual and operational definitions of variable. Interpretative refers to process where the researchers giving a subjective meaning on data. We, according to interpretative methods, do not only describe research object, but also interpret it.
We focused on the five variables, namely: digital divide, characteristics of ICT user, reason d' etre of ICT usage, the benefits of ICT usage, and constraints of ICT usage. The digital divide was defined as the difference of possessing, accessing, and using of ICT among internet users in real life and virtual life. It was measured based on the following indicators: (a) number and type of ICT device ownership; (b) kind of ICT device and location to accessing internet; (d) type of simcard usage; (e) top ten of the most visited websites; (g) type of social media usage; and (h) type of respondent activity when connected to the internet.
Meanwhile, characteristics of ICT user’s variable refer to personal traits of netizens (internet user). It was measured based on the following indicators: (a) age; (b) sex; (c) education; (d) income; (e) occupation; and (f) marital status. While reason of ICT usage variable was defined as social and economic motives of netizens when using ICT devices. We build Likert scale that contains twenty questions. Social motives contain ten questions (six questions are positive and four are negative statements). Economic motives also contain ten questions (seven are positive statement and three are negative statements).
5 Finally, variable of ICT constraints is respondent perception on obstacles and barriers when accessing and using ICT device. This variable was measured based on the following indicators: (a) the types of signals/network availability in the respondent residence; (b) the affordability of internet services; (c) the availability of ICT equipment owned by the respondent.
Survey research was conducted in Province of South Sumatra, especially in the Palembang city, Baturaja city, and Lubuk Linggau city. In each city, we selected one district as primary sampling unit through simple random sampling method. In each district, we selected fifty respondents randomly through the following procedures: (a) in district sample, we selected one sub-district by simple random sampling; (b) in each sub-district, we selected one neighborhood by simple random sampling; (d) in the neighborhoods level, we identified and selected a number of households by simple random sampling; (e) in the household, we identified total member of household and selected one household member randomly to become our respondent.
We have two types of data sources, namely, primary and secondary. Source of primary data are respondents who are members of the household aged fifteen years old or more. Secondary data derived from official data published by government agencies, companies, and civil society who deal with the object of study. Primary data was collected by structured interview. We used a set of questionnaire as guidance of structured interview. While the secondary data obtained through the collection of documents published by government organizations related to information technology policy and digital divide.
6 III. LITERATURE REVIEW
a. Meaning of digital divide
According to Wikipedia website, the internet was first discovered in 1953. In this year, the first email was sent from Professor Leonard Kleinrock’s computer at the University of California, Los Angeles, to a computer at Stanford Research Institute (SRI). In the mid-1990s, internet commercialization has produced tremendous impact in people's lives. Commercialization of the internet is the starting point for email (electronic mail), instant messaging, internet-based communications (Voice over Internet Protocol/VoIP), video calls, World Wide Web (WWW), which allows people to build social interaction (social networking, online shopping, online discussion) in cyberspace.
Internet produced digital divide issue in 1995 when the National Telecommunications and Information Agency (NTIA) published their report on the phone and internet access of United Stated of America (USA) populations. In 1996, the phrase of digital divide had become newspaper headlines in the New York Times article written by Steve Lohr. Two years later, the National Telecommunications and Information Agency (NTIA) still contains the phrase digital divide as they report subtitles. Until now, digital divide is identical with issues of access (Monroe, 2004: 6).
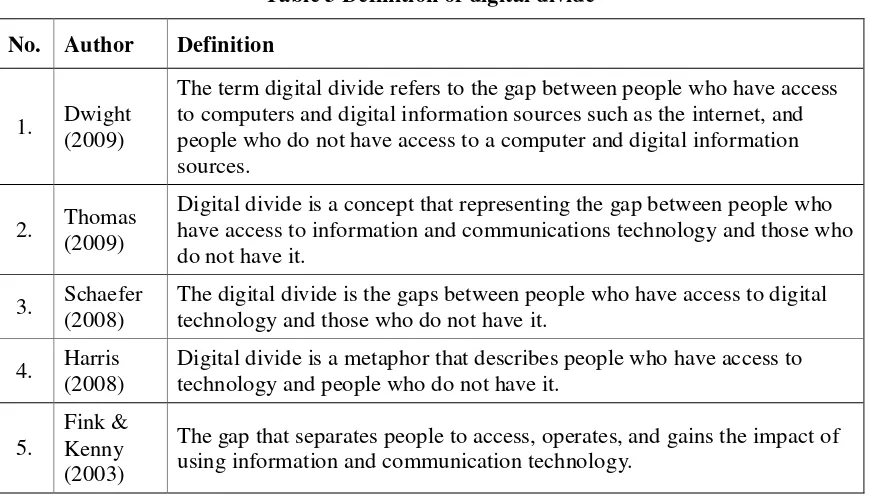
7 Table 3 Definition of digital divide
No. Author Definition
1. Dwight (2009)
The term digital divide refers to the gap between people who have access to computers and digital information sources such as the internet, and people who do not have access to a computer and digital information sources.
2. Thomas (2009)
Digital divide is a concept that representing the gap between people who have access to information and communications technology and those who do not have it.
3. Schaefer (2008)
The digital divide is the gaps between people who have access to digital technology and those who do not have it.
4. Harris (2008)
Digital divide is a metaphor that describes people who have access to technology and people who do not have it.
5.
Fink & Kenny (2003)
The gap that separates people to access, operates, and gains the impact of using information and communication technology.
Many scholarly publications had been written by using framework "the haves" and "the have not". These literatures discussing the digital divide phenomenon as a global issue and produce global digital divide terminology. These papers explain the differences of ICT’s access between the countries within the region, for example, Latin America (de Munster, 2005), Southeast Asia (Tipton, 2001), Europe (Hubregtse, 2005; Lengsfeld, 2011), Asia Pacific (Samarajiva & Gamage, 2007), Sub Saharan Africa (Mutula, 2008). Other papers explain digital divide between countries in the different regions, for example, Latin America and Europe (Bagchi, 2005), the United States and Europe (Cullen, 2001), or all countries in the world as sample study (Chinn & Fairlie, 2004).
8 Even though they are using dichotomous framework (have and have not), the way of thinking of Fink & Kenny (2003) is slightly different from many scholars on the above. According to Fink & Kenny (2003), the digital divide is not just a difference in ICTs access, but also the differences on ability, real usage, and its impact on individuals and social groups in their social life. It is similar to Valades and Richard (2007) work, who using physical access, actual use, the availability of support for ICTs usage, and social consequences of ICTs usage as variable of their research.
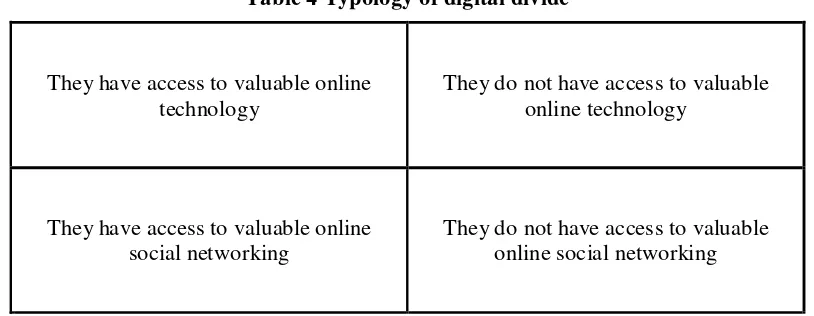
Zhao and Elesh (2007) (2007) using more different framework. According to them, the digital divide does not have two categories, but four categories (see, Table 4). Because, according to them, there is two type of the digital divide (see, Table 4). Associated with this typology, they argue that (a) equal and fair internet access is not necessarily produce equality of access to social resources in the internet, (b) access to valuable social networks in cyberspace is not equal/unequal among individuals. This inequality is a reflection of social injustice in real life (offline world).
Table 4 Typology of digital divide
They have access to valuable online technology
They do not have access to valuable online technology
They have access to valuable online social networking
They do not have access to valuable online social networking
Note: Visualized by authors
(neo-9 liberalism) and left John Maynard Keynes (welfare state). Thus, Stevenson (2009) said, the digital divide is not merely technical and administrative issues, but also class struggle issues.
While Warschauer (2003), starts from Egypt case, trying to expose weaknesses of "haves" and "have not" framework embraced in some literature. According to Warschauer (2003), there is several misunderstanding within this framework, that is: first, the term implies dichotomous division between “haves” and “have not”, “connected” versus “disconnected”. In fact, connectivity is a continuum, not dichotomous. Second, digital divide reflects inequality phenomenon. In fact, inequality is not only life in the digital world, but also being within the real social life. It means that social, economic, political, and cultural factors will sharpen the meaning of internet in individual social life significantly. Third, the digital divide framework reflects determination of technology in logic of thinking. It implies that the presence and absence of technology will affect the behavior and social life.
Some scholars had attempted to explain digital divide phenomenon without being imprisoned in dichotomous framework (have and have not). It is true that internet based ICTs led to digital divide phenomenon. However, ICTs can build digital equality where every person has access to communication technology and Internet-based information without looking at their social, economic, political, and cultural background. Technology can be bridging "haves" and “have not" group (Laouris and Laouris, 2008; Venkat, 2001; Tipton, 2001; Samarajiva & Gamage, 2007).
Hilbert (2011) also proposed new framework to understanding digital divide. According to him, digital divide is not about the dichotomy of "haves" and "have not" matters. It is about who (e.g., individuals, countries, etc.), which kind of characteristics (e.g., age, income, residence), connect how (limited access or effectively adopt), and to what (e.g., mobile phones, internet, digital TV, etc.). If these variables are answered and explained by a matrix, then there are many options to define the digital divide.
10 affect other aspects of the communities, namely economy, employment, space, and culture. At this point, the digital divide is a phenomenon that describes imperfect innovation diffusion stage. Referring to the diffusion of innovation theory proposed by Rogers (1983), the digital divide could be explained through the stage, attributes, and actors involved in diffusion of innovation process.
We can use the world system theory (Hopkins & Wallerstein, et.al., 1982) for explaining digital divide. Borrowing its logic, digital divide is manifestation of international division of labor. The “have” group is the “core” and the “have not” is the “peripheries”. Without peripheries, there is no core; there is no system of global capitalism. With the same logic, without the “have”, there is no “have not”. Without the “have”, there is no global capitalism in the sector of digital information and communications technology.
The above storyline shows how digital divide can be understood using different perspective. Each of the viewpoints has implications to explain digital divide. The next section will illustrate previous researches experience to understanding digital divide.
b. Previous researches on digital divide
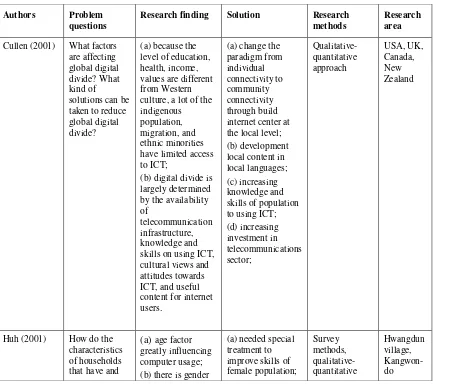
Table 5 reveals that research on digital divide has always started with mapping or grouping the people who use and have ICTs access (have) and people who do not have and do not use ICTs access (have not). Generally, access was understood as having opportunity to using and accessing information and communication technology services. After that, further explanation was expanding to explaining the factors that contribute to digital divide. The researchers can use quantitative, qualitative, or qualitative-quantitative approach to studying it. Individuals, groups, or organizations might be used as unit of analysis.
11 between individuals, and urbanization. Demography (young versus old; males versus females) and geographic (urban versus rural) also contribute to digital divide. From the aspect of service, there are content and network quality variable. From the infrastructure, there are variables such as availability of telecommunications infrastructure, telephone density, and electric consumption.
Indeed, their contribution to digital divide is varying from country to country, from organization to organization and from community to the others. Therefore, digital divide is not in a vacuum space. It is born, grown, and thrives in social, economic, politics, and cultural settings. How do we explain the influence of socio-cultural setting to digital divide? Answering this question is intellectual exercise for everyone who are concerned with digital divide issue in the future.
.
Table 5 Previous researches on digital divide
Authors Problem questions
Research finding Solution Research methods
Research area
13
14
James (2004) How to explain digital divide in
16 IV. FINDING AND DICUSSION
a) Characteristic of digital divide
From the ownership of ICTs device indicators, respondents in Palembang city are dominating computers, fixed telephones and mobile phones possession. In contrast, a few respondents in Lubuk Linggau city have a computer, fixed phone, mobile phones, and Android-based mobile phone. Furthermore, the largest proportion of respondents in Linggau Lubuk city does not have a computer and mobile phone. Respondents in Baturaja city have largest proportions in category do not have fixed telephone and Android-based mobile phone. In Lubuk Linggau city and Baturaja city, we still found respondents who did not have mobile phone. In contrast, all of respondents in Palembang city have mobile phones.
Majority of respondents in Lubuk Linggau city are using mobile phones and computers to access internet. There is no evidence to suggest that respondent in Lubuk Linggau accessing internet through fixed telephone as modem and Android-based mobile phone. In Baturaja city and Palembang city, respondents are accesing internet through computer, fixed telephone, mobile phones, and Android-based mobile phones. In Baturaja city, respondent who access internet through computer much more than respondent who access internet via fixed telephone, mobile phones, and Android-based mobile phones.
Where do respondent access internet? Home, office/work place, school, internet cafes, public space with Free Wi-Fi Area, and MPLIK (Mobil Pusat Layanan Internet Kecamatan/ Sub District Internet Service Center Car) are places where respondents access internet. House and cafe is still a favorite place for respondents to connect internet. MPLIK car – a program was launched the Ministry of Information and Communications, Republic of Indonesia, to improve internet accessibility of Indonesian peoples – is not a favorite place to accessing internet. Fewer respondents are using it to accessing internet.
17 largest proportion of respondents in Baturaja, Lubuk Linggau, and Palembang city are accessing Internet from their home.
ICTs devices are also used to calling and sending short message system (SMS). The results showed that Telkomsel is the most desirable product respondents in Palembang. In Baturaja city and Lubuk Linggau city, XL is used by respondents for calling and sending SMS more often uses products. Flexy card is used only by a handful of respondents in Palembang city and Baturaja city. Indosat product also quite interests respondents in Palembang, Baturaja city, and Lubuk Linggau city. Proportions of Indosat user is far below for Telkomsel product. AXIS, Three, Fren used by a few respondents in Palembang city, Baturaja city, and Lubuk Linggau city. Esia only used by a few respondents in Palembang city. While Ceria used by a few respondents in Palembang city and Baturaja city. We need to reaffirm the fact that Telkomsel products still dominate the simcard market in Indonesia.
Which kind of simcard does the respondent use to access internet often use? Research data shows that (a) Flexy, Esia, Ceria, and Axis user in Palembang city, Baturaja city, and Lubuk Linggau city more than Telkomsel user. It means that respondent using different simcard to make call, sending message, and using internet; (b) all respondents in Palembang city, Baturaja city, and Lubuk Linggau city used their simcard to accessing internet occasionally. If it is associated with the previous narrative, then the respondents tend to prioritize their computer as a device to connecting internet; (c) the proportion of respondents who have not used their mobile phones to connect to the internet are very few. This fact is in line with previous findings that instead of computer, mobile phone is a device commonly used by the respondent to access internet.
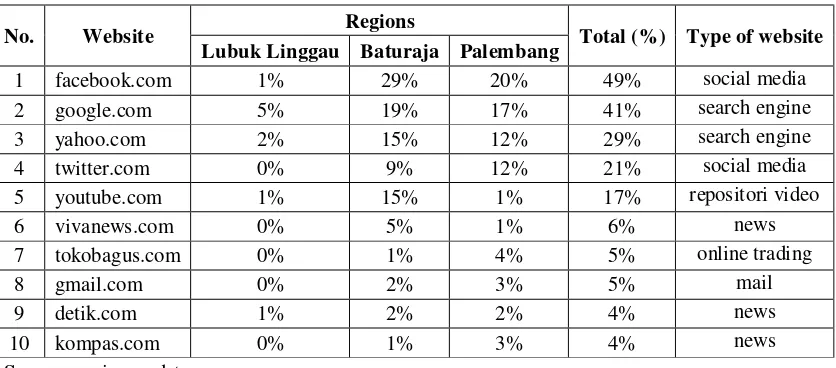
18 Table 6 The most popular website by city
No. Website Regions Total (%) Type of website
Lubuk Linggau Baturaja Palembang
1 facebook.com 1% 29% 20% 49% social media
2 google.com 5% 19% 17% 41% search engine
3 yahoo.com 2% 15% 12% 29% search engine
4 twitter.com 0% 9% 12% 21% social media
5 youtube.com 1% 15% 1% 17% repositori video
6 vivanews.com 0% 5% 1% 6% news
7 tokobagus.com 0% 1% 4% 5% online trading
8 gmail.com 0% 2% 3% 5% mail
9 detik.com 1% 2% 2% 4% news
10 kompas.com 0% 1% 3% 4% news
Sources: primary data
According to Table 6, Facebook, Google, Yahoo!, and YouTube user in Baturaja city more than user of these website in Palembang city and Lubuk Linggau city. In Palembang city, Twitter user, Kompas (newspaper) visitor, and TokoBagus.com (online trading site) more than user/visitor these website in Baturaja city and Lubuk Linggau city.
In Lubuk Linggau city, there is no respondent who used Twitter, visited news sites (vivanews.com, kompas.com), and participated in online trading site (TokoBagus.com), and used Gmail. The largest proportion of respondents in Lubuk Linggau city used Google as search engine. It indicates that the patterns of Internet usage in Palembang, Linggau Lubuk city and Baturaja city are still limited to social media, searching for information in search engines, watch/download/upload videos, read news, communication via email, and buying and selling online (online trading). It shows that the population began to connect with the virtual world and have unlimited access to the world's citizens and resources on the Internet.
19 In Lubuk Linggau city, respondent ever do all kinds of those activities, except distributed social activities and personal activities invitations. The largest proportion of respondents in Lubuk Linggau city is using social media and game online. In Baturaja city, the largest proportions of respondents in the Baturaja city are using social media. The next position is chatting and searching for news/information. Similar to these cities, respondent used internet to searching for news/information and social media in Palembang city is much more than another category.
In Baturaja city and Palembang city, the proportion of respondents who used internet for online shopping, online selling/buying, distributed social activities and personal activities invitations, receiving and sending email is larger than Lubuk Linggau city. This fact shows that Internet has begun to trigger productive activity among respondents in Palembang and Baturaja city.
However, in general, the above narrative shows that internet penetration in South Sumatra Province, particularly in Lubuk Linggau city, Baturaja city, and Palembang city, is not yet significant. If we compare it to others countries that move on to Voting, Learning, e-Government, e-Library, e-Business, and so forth, then internet development in South Sumatra has not been integrated into people's daily lives. Cyberspace (digital word/virtual world) is the world that has not been reflected people's lives in the real world (real world). Cyberspace is about entertainment. It is not about productivity.
b. Determinant of digital divide 1. Characteristic of ICT’s user
ICT user characteristics are personal traits possessed by internet users. It is measured on the following indicators: (a) age; (b) sex; (c) level of education; (d) monthly income; (e) occupation; (f) marital status, and (g) the amount of household members. Personal attributes of internet users is expected to produce respondent differences when accessing and using ICTs devices. Before proving the claim is true or false, the author will explain the characteristics of respondents in Lubuk Linggau city, Baturaja city, and Palembang city.
20 years old. This data show that in term of demographic structure, respondent’s distribution is quite diverse.
From total number of respondents (150 peoples), 60.4 percent are male and 39.6 percent are female. Male respondents in Baturaja city and Lubuk Linggau city are much more than female. While the composition of male and female respondent in Palembang city is balanced.
In terms of income, respondents in Baturaja city have monthly income to <Rp1 million. In Lubuk Linggau city, the largest proportion of respondents have monthly income to Rp1 million-Rp2 million. In Palembang city, respondents predominantly have incomes to Rp2 million-Rp3 million.
Meanwhile, in terms of education, the majority of respondents in Palembang city, Linggau Lubuk city, and Baturaja city was dominated by those who completed high school education or equivalent with high school. We found respondents who did not finish elementary school only in Lubuk Linggau city. Respondents graduated from university are found only in Palembang city.
In view of occupation, majority of respondents in Lubuk Linggau city are traders. In Baturaja city, respondents are students, civil servants, and employees of private companies. In Palembang city, the majority of respondents are students and civil servants.
In view of marital status, majority of respondents in Lubuk Linggau city are married. There are respondents who are not married and divorced but their proportion is less. In Baturaja city, majority of respondents are not married. There are respondents who were married, but it is not a bit. There are no respondents, who are divorced in Baturaja city. In Palembang city, majority of respondents are married. Small proportion of respondents is divorced.
Furthermore, in view of number of household members, majority of respondents in Lubuk Linggau city had three to four family members. In Palembang city, majority of respondents' household size reaches four. In Baturaja city, members of respondent household are five peoples.
21 predominantly computer and mobile phone ownership. However, all of aged group have computer and mobile phone in their home. This indicates that ICTs device owned and used by all age groups. Second, sex does not influence computer and mobile phone ownership. Although men have computer and mobile phone much more than women, but the gap proportions of ownership is not too wide. Third, social media and searching for news/information is favorite activity respondent in Palembang, Baturaja, and Lubuk Linggau city. If it were tabulated with the age group of respondent, then we found that young people (age groups 15-20 years old, 21-25 years old, 26-30 years old) most often do those two activities. The older respondent connected to internet rarely. This fact suggests that the age difference causes different patterns of internet usage in real life. Finally, in addition to age, level of education also affects patterns of internet usage. Field findings suggest that the higher level of education, the more likely a person to using internet.
2. Reason of ICT’s usage
ICTs usage among respondents who live in Palembang city, Linggau Lubuk city, and Baturaja city is not economic oriented. Only 10.7 percent (8.7 percent strongly disagreed and 2.0 percent strongly agree) of respondents who had economic motives when using ICTs. Meanwhile, 55.4 percent of respondents stated that they use information and communication technology without economic motives.
If respondents do not have economic motives, then do they have social motive when using ICTs devices? The answer is that they did not have a social motive too. Respondents who have social motives are only 8 per cent (6.7 per cent disagreed and 1.3 percent strongly agree). The largest proportion of respondents, reached 44 percent (0.7 percent strongly disagreed and 43.3 percent disagreed) states that they do not have social motives.
22 line to digital divide discourse on global level that more focused on ownership, access, and ICTs usage, and based on our finding, we suggest the gap meaning as part of digital divide concept.
3. Benefits of ICT’s usage
Although respondents did not have economic reasons and social reasons when using information and communication technology devices, but they get the benefits when using ICTs devices. We found that 40 percent (28.7 percent agreed and 11.3 percent strongly agree) of respondents agreed that ICTs provide economic benefits to its users. Only 35.4 percent (20.7 percent strongly disagreed, 14.7 percent disagreed) of respondents said that ICTs usage do not provide economic benefits. In line with these data, 40 percent (24 percent agreed and 16 percent strongly agree) of respondents stated that ICTs usage provide social benefits to them. Only 32 percent (20 percent strongly disagreed and 12.2 percent disagreed) of respondents said that ICTs usage do not provide social benefits to its users.
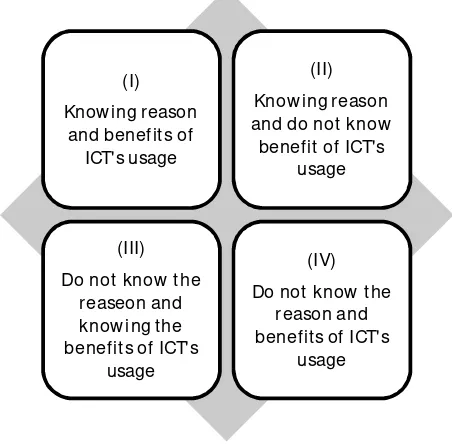
23 Figure 1 The gap meaning as component of digital divide
4. Constraints of ICT’s usage
A constraint in using information and communication technology was defined as perceived obstacles and hurdles by ICT users when accessing and using ICT equipment. This variable is measured on the following indicators: (a) the types of signals/networks available for respondent (LAN or wireless [GPRS, EDGE, 3G, HSDPA, CDMA]), (b) the affordability of internet services (credit price), and (c) the availability of ICT equipment owned by respondent.
Respondents who live in Palembang city are feeling strong signals for all types of existing mobile phone network only, namely: GPRS (general packet radio service), EDGE (enhanced data rates for GSM [global system for mobile communication] evolution), 3G (third generation technology), HSDPA (high-speed downlink packet access) and CDMA (code division multiple access). In Lubuk Linggau city, respondent perceptions on mobile phone network are very diverse. Numerous respondents said that it is strong, but another said that it is weak, or no signal. In Baturaja city, all kinds of mobile phone networks are strong, except CDMA networking. Difference in quality of mobile phone network will affect the quality of ICT usage that have internet feature.
In term of respondent expenditure on internet cost, they consider Speedy (internet service delivered by Telkom, Inc.) as affordable. Respondent feel the same thing when using internet
(I) Know ing reason
and benefit s of ICT's usage
(II) Know ing reason and do not know
benefit of ICT's usage
(III) Do not know t he
reaseon and know ing t he benefit s of ICT's
usage
(IV) Do not know t he
reason and benefit s of ICT's
24 through telecommunications provider. This situation shows that cost or price is not a significant obstacle for respondents to access internet through their ICT device. In other words, respondents have ability and willing to pay the costs incurred for using ICT devices.
In terms of availability of ICT divices, a few respondents in Lubuk Linggau city have one computer (desktop, laptop, notebooks). In Palembang and Baturaja city, the largest proportion of respondents has also one computer. However, in these two cities, numerous respondents have two and three computer. For mobile phones, respondents who live in Palembang, Baturaja, and Lubuk Linggau, have one to four mobile phones. If the nuclear family consisting of father, mother, and two children, then each member of the household most likely have their own mobile phones. Meanwhile, respondents who live in Palembang city and Baturaja city only use fixed telephone and Android mobile phone. In Lubuk Linggau, there is no respondent who using Android mobile phones. It is concluded that the ownership of ICTs device is not a serious problem contributing to digital divide in those cities.
V. CONCLUSION
There are several conclusions that have been produced by this research, namely: first, there are differences in the ownership of information and communication technology, and the way, place, type of activity when accessing the Internet, the simcard in mobile phones and to accessing internet, web pages visited between respondent in Palembang city, Linggau Lubuk city, and city Prabumulih. There are also respondents who use the Internet to conduct business online, although their proportion is small. It shows that Internet penetration in South Sumatra province, especially in Lubuk Linggau City, Baturaja City, and Palembang City, is not too significant. Cyberspace (digital word) is the word that has not been reflected people's lives in the real world (real world). Internet has begun to trigger a productive activity among respondents who live in Palembang city and Baturaja city.
25 symptoms indicate difference of meaning among users that should be seen as part of digital divide concept. Fifth, cost and ownership of ICTs does not constraint people to using it. Respondents have ability and willing to pay the costs incurred for utilizing ICTs devices.
REFERENCES Books
Barbara, Monroe Jean., 2004. Crossing the digital divide: race, writing, and technology in the classroom. New York, Teachers College Press.
Bellinger, William K. 2007. The Economic Analysis of Public Policy. New York, Routledge. Christensen, et.al., Tom. 2007. Organization Theory and the Public Sector: Instrument,
Culture, and Myth. New York, Routledge.
Denhart, Janet V., & Denhart, Robert B., 2007. The New Public Service: Serving, Not Steering. New York, M. E. Sharpe.
Dwight, James S., 2009. Digital divide, in E. Provenzo, & A. Provenzo (Eds.), Encyclopedia of the social and cultural foundations of education. California, SAGE Publications, Inc., page. 247-248.
Eriksen, Thomas Hylland. 2001. Small Places, Large Issues: An Introduction to Social and Cultural Anthropology. London, Pluto Press.
Hamilton, Mary R., 2007. Democracy and Public Services, in Box, Richard C., (eds.), 2007. Democracy and Public Administration. New York, M. E. Sharpe.
Harris, Robert., 2008. Digital divide, dalam V. Parrillo (Ed.), Encyclopedia of social problems. California: SAGE Publications, Inc., page. 236-237.
Hopkins, Terence K, dan Wallerstein, Immanuel., et.al., 1982. World-system analysis: theory and methodology. California, Sage Publication, Inc.
Kementerian Komunikasi dan Informatika (MENKOMINFO) Republik Indonesia, 2011. Indikator TIK Indonesia 2011. Jakarta, Kementerian Komunukasi dan Informatika Republik Indonesia.
Kementerian Komunikasi dan Informatika (MENKOMINFO) Republik Indonesia, 2011a. Laporan Tahunan 2011. Jakarta, Kementerian Komunikasi dan Informatika Republik Indonesia.
Levine, David P. 1995. Wealth and Freedom: An Introduction to Political Economy. Cambridge, Cambridge University Press.
O’Toole, Barry J., 2006. The Ideal of Public Service: Reflections on the higher civil service in Britain. London, Routledge.
Rainey, Hal G. 2009. Understanding and Managing Public Organizations. Californian, John Wiley & Sons, Inc.
Ritchie, Jane., & Spencer, Liz., 1994. Qualitative Data Analysis for Applied Policy Research, in Bryman, Alan., & Burgess, Robert G., (eds.), 1994. Analyzing Qualitative Data. London, Sage Publication.
Rogers, Everett M., 1983. Diffusion of Innovations. New York, The Free Press.
Schaefer, Peter D., 2008. Digital divide, in R. Schaefer (Ed.), Encyclopedia of race, ethnicity, and society. California, SAGE Publications, Inc., page. 389-390.
Thomas, Pradip., 2009. Digital divide, in S. Littlejohn, & K. Foss (Eds.), Encyclopedia of communication theory. California, SAGE Publications, Inc., page. 311-313.
26 Journals
Alampai, Erwin., 2006. Analysing socio-demographic difference in the access and use of ICTs in the Philippines using the capability approach, in The Electronic Journal on Information Systems in Developing Countries, Volume 27, Number 5, page. 1-39. Ani, Okon Edet., Uchende, Chika., Atseye, Emmanuel U., 2007. Bridging the digital divide in
Nigeria: a study of internet use in Calabar Metropolis, Nigeria, in Library Management, Volume 28, Number 6/7, page. 355-365.
Bagchi, Kallol., 2005. Factors contributing to global digital divide: some empirical results, in Journal of Global Information Technology Management, Volume 8, Number 3, page. 47-65.
Bjorn, Furuholt., and Wahid, Fathul., 2008. E-government Challenges and the Role of
Political Leadership in Indonesia: the Case of Sragen, in Proceedings of the 41st
Hawaii International Conference on System Sciences 2008.
Chinn, Menzie D., and Fairlie, Robert W., 2004. The determinants of the global digital divide: a cross-country analysis of computer and internet penetration. Center Discussin Paper No. 881, Economic Growth Center, Yale University.
Cullen, Rowena., 2001. Adressing the digital divide, in Online Information Review, Volume 25, Number 5, page. 311-320.
de Munster, Irene L., 2005. The digital divide in Latin America: a case study, dalam Collection Building, Volume 24, Number 4, page. 133-136.
Fink, Carsten., and Kenny, Charles J., 2003. W(h)ither the digital divide?, in Info: the Journal of Policy, Regulation and Strategy for Telecommunication, Information and Media, Volume 5, Number 6, page. 15-24.
Harwit, Eric., 2004. Spreading telecommunications to developing areas in China: telephones, the internet, and the digital divide, in The China Quarterly 2004.
Hilbert, Martin., 2011. The end justifies the defenition: the manifold outlooks on the digital divide and their practical usefulness for policy-making, in Telecommunications Policy, Volume 35, Number 8, page. 715-736.
Hubregtse, Sjaak. 2005. The digital divide within the European Union, in New Library World, Volume 106, No. 1210/1211.
Huh, Woo-kung., 2001. Computer and the Internet in Rural Areas: the Case of Hwangdun e-Village, in Journal of the Korean Geographical Society, Vol. 36, Number. 5, page. 501-515.
ITU, 2003. Gauging ICT potential around the world, in ITU News, No. 10.
James, Jeffrey., 2004. Recounstruing the digital divide from the perspective of a large, poor, developing countries, in Journal of Information Technology, Number 19, page. 172-177.
Laouris, Yiannis., and Laouri, Romina., 2008. Can information and mobile tchnologies serve to close the economic, educational, digital, and social gaps and accelerate development?, in World Future: The Journal of Global Education, Volume 64, Number 4, page. 254-275.
Lengsfeld, Jorn H. B., 2011. An econometric analysis of the sociodemografic topology of the digital divide in Europe, in The Information Society: An International Journal, Volume 27, Number 3, page. 141-157.
Mistry, Jamshed J., 2005. A conceptual framework for the role of government in bridging the digital divide, in Journal of Global Information Technology Management, Volume 8, Number 3, page. 28-46.
27 Samarajiva, Rohan., and Gamage, Sujata., 2007. Bridging the divide: building Asia-Pacific
capacity for effective reforms, in The Information Society, Nomor 23, page. 109-117. Sanz, Esteve., and Turlea, Geomina., 2012. Downloading inclusion: a statistical analysis of
young people’s digital communication inequalities, in Innovation – The European Journal of Social Science Research, Volume 25, Number 3, September 2012, page. 337-353.
Srinuan, Chalita., and Bohlin, Erik., 2011. What makes people go on line? An empirical analysis of the digital divide in Thailand, in proceeding Annual International Conference on Micro and Macro Economics (MME 2011). ISBN: 978-981-08-9514-3, doi: 10.5716/978-981-08-9514-3_MME14
Stevenson, Siobhan., 2009. Digital divide: a discursive move away from the real inequities, dalam The Information Society, Volume 25, Number 1, pagel 1-22.
Tipton, Frank B., 2002. Bridging the digital divide in Southeast Asia: pilot agencies and policy implementation in Thailand, Malaysia, Vietnam, and the Philippines, in ASEAN Economic Bulletin, Volume 19, Number 1, page. 83-99.
Valades, James R., and Richard, Duran., 2007. Redefining the digital divide: beyond access to computers and the internet, in The High School Journal, Volume 90, Number 3, page. 31-44.
Venkat, Kumar., 2001. Digital divide and poverty, dalam Journal of Poverty, Volume 5, Number 4, pag. 113-116.
Wahid, Fathul., 2008. Evaluation Focus and Quality of Indonesia e-Government Website.
Makalah disampaikan pada Seminar Nasional Aplikasi Teknologi Informasi 2008 (SNATI 2008), Yogyakarta, 21 Juni 2008.
Warschauer, Mark., 2003. Dissecting the “digital divide”: a case study in Egypt, in The Information Society: An International Journal, Volume 19, Number 4, page. 297-304. Zawawi, Azlyn Ahmad., et.al., 2011. Identifying gaps in digital divide: comparison between
localities in Sg. Petani, Kedah, Malaysia, in Interdisciplinary Journal of Contemporary Research in Business, Volume 3, Number 4, page. 556-562.
Zhao, Shanyang., and Elesh, David., 2007. The seconds digital divide: anequal access to social capital in the online world, in International Review of Modern Sociology, Volume 33, Number 2, page. 171-192.
Internet
http://statistik.kominfo.go.id/ http://fbdir.salingsilang.com
http://inet.detik.com/read/2012/08/07/185935/1985641/328/pengguna-internet-indonesia-tembus-80-juta-di-2014
http://mizan.com/news_det/indonesia-surga-industri-seluler.html
http://swa.co.id/listed-articles/apkomindo-summit-2010-pengguna-komputer-di-indonesia-baru-4
Kemp, Simon., 2011. Social, digital and mobile in Indonesia, dalam http://wearesocial.net/blog/2011/12/social-digital-mobile-indonesia/
Wiratno, Ongki., 2010. Evaluasi Implementasi E-Government Pada Layanan Perizinan Di Kementrian Pertanian RI. Masters thesis, Institut Pertanian Bogor. Diunduh dari http://repository.mb.ipb.ac.id/1508/.
28
Quina, Novi Nurul.,2009. Analisis Penerimaan e-Government dengan Menggunakan Technology Acceptance Model (TAM) pada Pegawai Negeri Sipil di Lingkungan