A BLENDING TECHNIQUE OF TOPOGRAHIC
AND HYDROGRAPHIC DEMs FOR RIVER ALIGNMENT MODELLING
Hairi Karima, Mohamad Ghazali Hashimb and Mohd Radhie bin Mohd Salleha
a
I Net Spatial Sdn. Bhd, 81300, Skudai, Johor, Malaysia - [email protected], [email protected] b
3D GIS Research Group, Faculty of Geoinformation and Real Estate, Universiti Teknologi Malaysia, 81310, Johor Bahru, Malaysia. - [email protected]
KEY WORDS: DEM, bathymetry mapping, topographic DEM, interpolation, and hydrography modelling.
ABSTRACT
Current practice in combining bathymetry and topographic DEM is based on overlaying and merging both datasets into a new DEM based on river boundary. Throughout a few sample of datasets from previous recent projects, authors realize that this method is not preserving the nature of natural river characteristic, especially at the slope in between riverbank and riverbed. Some arising issues were also highlighted; validity of the topographic DEM as well as the river boundary, limitations of DEMs and how bathymetry survey was carried out on field. To overcome these issues, a new technique called blending DEMs was proposed and tested to the project datasets. It is based on a fusion of two DEMs (with respective buffer, offset and fusion ratio from a validated river boundary) to produce riverbank slope and a merging of two different interpolation results to produce a best riverbed DEM. Simple riverbank ontology was prescribed to illustrate the model enhancement in accuracy and visualization provided by this technique. The output from three projects / DEM results was presented as a comparison study between the current practices with the proposed technique.
1. INTRODUCTION
A DEM is used as a means of 3D terrain modelling, which serves as a basic source of height information, analysis, visualization and a better model in understanding on real world phenomenon. Currently, DEMs are being generated by many methods, such as ground survey, photogrammetry, Light Detection and Ranging (LIDAR), and Interferometric Synthetic Aperture Radar (IFSAR) and others. IFSAR technology is very effective in the creation of accurate large-area elevation datasets. Leaders in the geo-spatial community are starting to accept airborne IFSAR as a complementary cost-effective 3-D mapping technology for many applications.
1.1 Topographic DEM and riverbed elevation
A digital elevation model is a regularly-spaced bare-earth model in raster form (grid) to store elevation of the ground/land surface with a referenced to a vertical datum. The method to capture and collect DEM model might differ according to the approach use and the nature of the area. For example, topographic DEM can be acquired using radar transmission technique from the satellite and plane, while drone and mobile vehicle are also possible nowadays by using laser scanning technique. However, radar from satellite and laser rays of a plane/dronecould not be used to measure the riverbed elevation as far as the DEM is concerned. Thus, a bathymetry data collection technique was introduced to measure the depth of the water using boat and sonar transmission. The depth is then being transferred to riverbed elevation after transferring the height of the land based station. Both topographic/land and riverbed elevation can be combine to prepare a DEM of a certain area.
Section 2 explains some study background, problems and how deriving the technique. The remaining sections describe the proposed blending technique, comparison of results based on three different projects and end up with conclusion section.
2. LITERATURE
This section is divided into three main sub-sections; current practice in merging bathymetry and available DEM, Malaysia river characteristics, and limitation of respective DEMs and processing tool.
2.1 Current practice
In preparing the based model of for hydrological modelling, two fundamental steps will be carried out; interpolation of the corrected bathymetry cross-section and overlay them with DEM of land surface. A vector of river boundary layer from Department of Irrigation and Drainage Malaysia (JPS) will act as a clipping boundary for the bathymetry riverbed.
2.1.1 Interpolation
There are many interpolation techniques available to produce continues surfaces (e.g. elevation) from a series of weighted point dataset. The most well-known interpolation techniques are Inverse Distance Weighted (IDW), Kriging, Nearest Neighbour, Spline, Topographic-based and others. Each interpolation technique produces different surface elevation as a result of preserving some elements (shape, better visualization, accuracy, mathematical etc) as well as the completeness of the input point data. Figure 1 a and b show some example of interpolation results.
Figure 1. Default interpolation methods derived from bathymetry cross-section (blue coloured line is river boundary).
2.1.2 Bathymetry overlay on top of DEM
One of the common advantages of using GIS in modelling is the ability to perform overlay between corresponding layers. Each features/information from any overlaid area capable in having spatial relationship with other layers, as well as producing unwanted errors. As for our case, overlaying and merging an interpolated bathymetry and topographic DEM (e.g. LiDAR) with different time (time of data collection) and water volume would produce the following possibilities (Table 1 and Figure 2):
Table 1. Possibilities on merging two set of DEMs
# LiDAR bathymetry Result/Error
1 a b Δab, a gap (error, nil data) 2 b a Δba, overlay (use either value) 3 a/b a/b a-a || b-b, matched (better)
Figure 2. Sampling figure edited from (Gasim et al., 2013), illustrate the water level before and after a monsoon –a and b
are the boundary area of LiDAR and Bathymetry.
Beside these errors, current practice on merging two different DEMs (matched/better result based on Table 1) between riverbed and topography elevation produces a bigger problem: a sudden drop in elevation as illustrated in Figure 3. A natural
river will be modelled as merely a concrete drainage of a big city.
2.2 River characteristic (Malaysia)
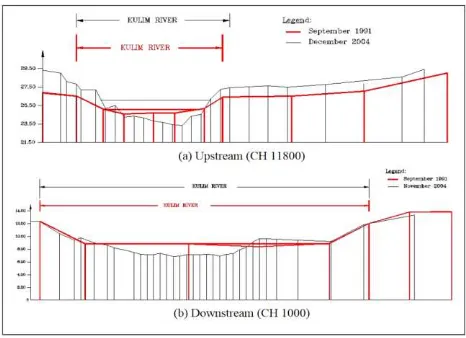
Most river channels in Malaysia are dynamic changes either by natural or man-made shape (or depth e.g. sand mining). The natural morphology processes is also actively occurs by the composition and erodibility of the bed and banks (e.g., sand, clay, bedrock), which directly affect the formation of the river's path/shape (refers to Figure 4). Kiat et al., (2005) discussed on riverbed sedimentation problem at Kulim river (based on cross-section sampling) exceeded 3.30 meter within 13 years period.
Figure 3. A typical cross profile result (current practice, possibility #2 and #3) in between two surveyed cross-sections.
Figure 4. Erosion (upstream) and sediment (downstream) problems at Kulim River, Malaysia -
(
Kiat et al., 2005).2.2.1 Riverbank ontology
Most of the rivers around the world are created almost with the same shape (except differs in lithology aspect and some cases such as mountainous/ ridged areas). However, the nature of river slope and riverbank itself may differ on upstream and downstream as illustrated in Figure 5.
a)IDW
b) Topographic-based
b a
Figure 5. A typical long and cross profiles river (ACE, 2017).
Thus, there is a need to make a details processing on merging two DEMs for this particular phenomenon. Parameters such as riverbank morphology (offset, priority of DEM value, manual editing, correctness, exact time of data captured and etc) should be considered before deriving a riverbank/riverbed ontology model as prescribed in Figure 6 and Figure 7 below.
Figure 6. Illustration of Cross-section for modelling purposes
Figure 7. Rotated angle form Figure 6 to illustrate riverbank (side a) in basic mathematical modelling.
2.3 Limitation of DEMs and processing tools
In general, there are some limitations of the DEMs for both topographic from radar system (e.g. LiDAR, ASTER, IFSAR and others) and bathymetry data collection technique. As for the processing tools, there are still no tools or software available in the market to enhance and correct these limitations. Recently, a new blending technique on two DEMs is introduced by Petrasova et al. (2017), covers general aspect of the merging process which not applicable for riverbed and riverbanks.
2.3.1 Bathymetry limitation
Based on dataset from three different projects, some of highlighted bathymetry limitations are:
Medium/big survey boat cannot access to the sloping riverbank (the closest is around 2-3 meters from riverbank because of the boat size, obstacle e.g. bush).
Survey team cannot give a well explanation regarding the shape of the river which slightly different when compared with river boundary and topographic DEM.
No validation for time different and river morphology between topographic DEM and river boundary.
2.3.2 DEM/LiDAR limitation
Since topographic DEM such as LiDAR, IFSAR, ASTER and SRTM are based on radar system; we cannot do much to tune up accuracy performance except some basic analysis. The main limitation of radar-based DEM is that, it cannot penetrate water body deeper than 1-2 meters; returning nil or flat value as elevation for water body area. However, classification analysis can be done easily to differentiate between river coverage/area and higher. The generated river boundary from DEM classification will then be compared with the actual schema (given river boundary) for offset calculation and planning.
3. PROPOSED BLENDING TECHNIQUE
Merging two or more DEMs is also possible to produce better results. The process is called DEM fusion; a technique capable to increases the accuracy of the fused DEM with respect to the individual DEM (Tannous & Le Goff, 1996; Reinartz et al., 2005). This only valid for possibility cases #2 and #3 (refers to Table 1). The proposed new technique is called blending since the main operation for these corrected models are the fusion of the individual offset buffer for each DEM in ratio decreasing/increasing form (Figure 8).
Figure 8. Blending technique only focuses on riverbank.
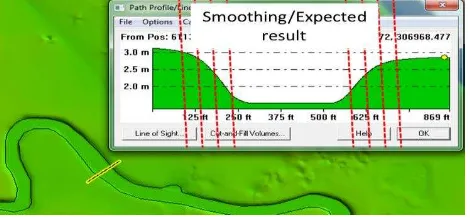
It almost the smoothing process in any DEM such as LiDAR for ridged/sink/sudden drop area (Figure 9), except this proposed blending technique involves two different DEMs and undergo manual tune-up based on appropriate ontology, offset and ratio fusion value between LiDAR and bathymetry river boundary. Side a
Figure 9. Expected result from blending technique (fussion between two DEMs – offset and ratio).
An integration method is suggested when a single data set is prior to the other ones, e.g. a new data acquisition is integrated into an already available DEM (D. Hoja et al., 2006). Thus, the latest data will be a priority factor in deciding which data as a schema for integration. For instance, LiDAR is more recent than the given river boundary and lastly the bathymetry dataset. LiDAR data will be a deciding factor in creating river boundary schema and ratio between blending DEMs (e.g. in Table. 2).
Table 2. An example of blending (fussion) ratio between DEMs
No Buffer offset LiDAR (%) BATHY (%)
1 10-15 90 10
2 5-10 75 25
3 0-5 55 45
4 0-(-5) 40 60
5 (-5)-(-10) 20 80
6 (-10)-(-15) 10 90
3.1 Process workflow
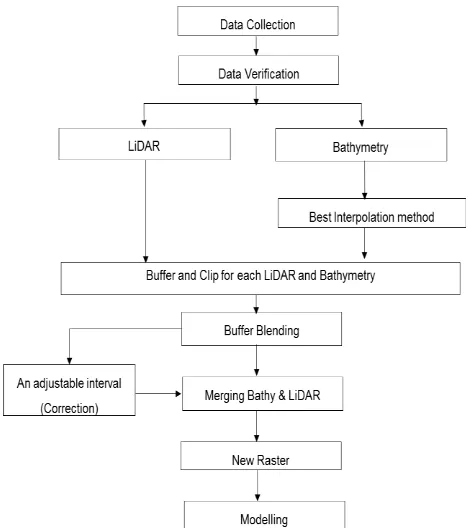
Figure 10 shows the general methodology on deriving a new DEM raster for river modelling. Since there is not available tools to work with, the process need to undergo testing and manual steps. The process start with data verification (interview surveying team if any, classification for topographic DEM (e.g. LiDAR) and selecting two best interpolations result for bathymetry DEM.
Figure 10. General methodology of blending technique.
Later, a series of buffers will be created geometrically according to the river offset from it boundary and cut through each DEM. Further, testing and correction will be made to find the best ratio in blending both DEMs and merged into a single new output DEM.
3.2 Variables (blending offset and ratio)
The value of the parameters or variables may differ from parts of the river (refers to Figure 5). Blending variables refer to the following adjustable variable:
DEM resolution
Number of offset buffer
Size of each buffer
Overlap between neighbour buffers
Ratio for blending Topographic DEM with Bathymetry DEM.
4. RESULT FROM PREVIOUS PROJECTS
This section will describe briefly on the blending result for three previous samples (based on previous works).
4.1 Batu Pahat shoreline
The first testing dataset was to reduce the elevation gaps in between topographic DEM (ASTER dataset) with onshore/river mouth bathymetry survey conducted recently by UTM group. Figure 11 shows classification of ASTER data in black (nill/flat elevation difference), purple (low-elevation ground) and grey (height ground area). Batu Pahat River (red line colour) shows the boundary of the river as well as shoreline covers only the higher ground or riverbank/higher shoreline. While the sand beach considered as water body. The latest dataset is bathymetry (deciding factor) for priority in blending ratio, was taken during high tide and thus there are some gap and intercept between both DEMs (case #1, #2 and #3). However, huge different in height (2.5 meter in Figure 12) was detected where it is not found on site; thus need to perform blending technique.
Figure 11. Available datasets
Figure 12. The sudden jump in elevation at DEMs meet line (overlay).
Figure 13. The result of blending technique at the same area (reduced gap of 2.0 meter to 0.5 meter)
4.2 Pontian river
The same scenario occurred for Pontian River, Pahang. Bathymetry survey work was carried out and well matched with the river boundary (only a few meters wider), which means less erosion (shape changes) took place for the river. However, when it is overlaid with the topographic DEM (in this project is IFSAR), mostly whole 25 km of Pontian River having sudden drop (Figure 14) in elevation between overlaid DEMs which is not valid based on natural river morphology/characteristic.
Figure 14. Sudden drop in riverbank/river boundary.
After blending technique was carried out, the results shown a quite positive improvement (Figure 15) except it is not that smooth (since IFSAR was in 5 meter resolution, while bathymetry in sub-meter accuracy-resolution).
Figure 15. Some of blending results.
4.3 Kelantan river
After a massive flood event in Kelantan at late of 2014, UTM received flood research grant. Some of the bathymetry surveyed data was collected and modelled using this blending technique. A fusion DEM was prepared between LiDAR with bathymetry and IFSAR with bathymetry at upstream level of Kelantan River. However most of bathymetry survey was carried out in drought season (summer water level at Figure 16 and Figure 17), leaving a huge unsurveys gap/no data along inner Kelantan River boundary (mid and upstream)–case #1 and case #3.
Figure 16. Kelantan flood and data collection situation at mid and upstream, producing no DEM data along inner river.
Figure 17. Drought season during bathymetry data collection, Tanah Merah.
This ‘no data’ areas illustrate in Figure 18 with classified LiDAR and river boundary layer. Blending is not only work on the process of fusion two DEMs, but it is also involve the interpolation (for smoothing the riverbank-riverbed, buffer offset). Two best interpolation results in Figure 1 will be blend to have better bathymetry DEM (Figure 19), which cover the ‘no data’ area before blending with LiDAR/IFSAR DEM.
Figure 18. ‘No data’ is in between the surveyed bathymetry points with light blue colour classified LiDAR.
-No data-
LiDAR Bathymetry
not accessible by boat
Figure 19. Result of combining two different interpolation methods with 70-30 ratio.
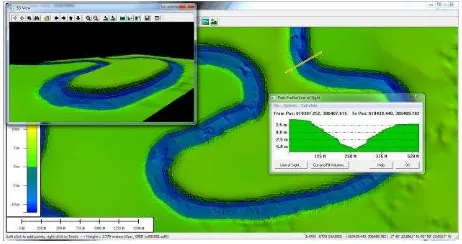
Figure 20, 21 and 22 show the state of the art from LiDAR, LiDAR + Bathymetry and the blending results respectively. The different in elevation for respective DEM, its fusion DEM and with shape enhancement (slope of riverbank).
Figure 20. LiDAR data with flat elevation (no riverbed elevation).
Figure 21. DEMs overlay result with river boundary saperation.
Figure 22. DEM blending result for Kelantan flood modelling.
Figure 23 and 24 show some comparison between normal practices with the new blending results. While Figure 25 and 26 show the 2.5D modelling with cross profile scene of the respective results.
Figure 23. Normal overlay method for single DEM.
Figure 24. DEM blending result for Kelantan flood modelling.
Figure 25. 3D DEM fusion with blended bathymetry interpolation.
Figure 26. 3D Blended riverbank as final DEM.
5. CONCLUSION
This paper introduced a new approach and technique to merge topographic DEM with riverbed from bathymetry survey for river alignment modelling. The proposed technique involves merging two bathymetry interpolation techniques as well as adapting basic natural river characteristics in between riverbed and riverbanks. The final modelling results (DEM) seem to have a better model, a step closer to the real world objects; Malaysia rivers.
Since there are still no available processing tools or software to rectify DEMs merging limitations, some suggested advices are listed below for a better modelling output:
Use a small UAV surveying boat (e.g. SHUMOO by Suhari et. al, 2017) to measure the depth in between riverbank and riverbed (1 – 4 meters from riverbank) as an alternative method.
Racky/observe the site before bathymetry data collection take place to verify the boundary of the river is still valid (caused by erosion).
Mark the area and offset which cannot be accessed by the surveying boat (too shallow or obstacle).
Do surveying at both riverbanks parallel with centreline (as was done in Figure 16) apart from cross-sections for cross checking result.
However, there are still a room for improvement to the technique in the future. Accuracy assessment on the model also should be carried out to investigate which interpolation techniques are most suitable for active and dynamic riverbed in Malaysia. We would like to extend this technique into a semi-automatic (more input from the users) or/and semi-automatic near the future such a processing tools for merging topographic and Conditions and Dynamic State Analysis of Pahang River. American Journal of Applied Sciences, 10 (1): 42-57, 2013. doi:10.3844/ajassp.2013.42.57
Hoja, D., P. Reinartz, M. Schroeder, 2006. Comparison of DEM Generation and Combination Methods using High Resolution Optical Stereo Imagery and Interferometric SAR Data. ISPRS Commission I,
WG I/5 - Conference Paper. Pg 4.
http://www.isprs.org/proceedings/XXXVI/part1/Papers/T07-29.pdf
HRS and SRTM data and estimation of forest heights. In: Global Development in Environmental Earth Observation from Space, Proc. of the 25th EARSeL Symposium, Porto, Portugal.
Kiat, C. C., A. A. Ghani, N. A. Zakaria and R. A,bdullah, 2005. Sediment Transport in Kulim River, Malaysia. XXXI IAHR CONGRESS 1397. September 11~16, 2005, Seoul, Korea.
Petrasova A., Helena Mitasova, Vaclav Petras and Justyna Jeziorska, 2017. Fusion of high-resolution DEMs for water flow modeling. Open Geospatial Data, Software and Standards. DOI 10.1186/s40965-017-0019-2
Reinartz, P., Lehner, M., Hoja, D., Müller, R., Schroeder, M., 2005. Comparison and fusion of DEM derived from SPOT-5.
Suhari, K. T., K. S. Apryandika, Rahmawati, M. Z. Hasan, H. Purwanto, 2017. The Small Hydrography Marine Boundary Boat (SHUMOO) for Mapping Bathymetry of Shallow Water Area. GEOICON 2016. DOI: 10.13140/RG.2.2.21326.46408.
Tannous, I., Le Goff, F., 1996. An integrated methodology for DEM computation through the fusion of interferometric, radargrammetric and Photogrammetric data. In: Proceedings of the ERS SAR Interferometry Workshop FRINGE 1996, Zurich.