THE EFFECT OF STIRRING TECHNIQUES ON
TiO
2NANOPARTICLE SIZE BY USING A WET
CHEMICAL METHOD
Y. E. Gunanto
1, K. Sinaga
1and Y. P. Pratala
2 1Faculty of Education - Pelita Harapan UniversityTangerang, Banten 15811
2The Center of Advanced Materials Science and Technology - BATAN
Kawasan Puspiptek, Serpong 15314, Tangerang Selatan E-mail: [email protected]
Received: 18 November 2015 Revised: 27 June 2016 Accepted: 22 September 2016
ABSTRACT
THE EFFECT OF STIRRING TECHNIQUES ON TiO2NANOPARTICLE SIZE BY USING A
WET CHEMICAL METHOD.The TiO2nanoparticles were synthesized by a wet chemical method. The
influence of stirring on the particle size was investigated. In the first technique, the stirring was done during the process of mixing, while in the second technique the stirring was done after the mixing process is finished. The particle size was characterised using XRD, TEM, and PSA, while the BET surface area used. The first technique, obtained a fairly small grain size of about 12-50 nm, while the second technique obtained particle sizes between 1300-1600 nm.
Keywords: Particle size, Stirring technique, Wet chemical method
ABSTRAK
PENGARUH TEKNIK PENGADUKAN PADA UKURAN NANOPARTIKEL TiO2 DENGAN
MENGGUNAKAN METODE KIMIA BASAH. Sintesis nanopartikel TiO2dengan metode kimia basah.
Telah dilakukan penelitian pengaruh pengadukan pada ukuran partikel. Teknik pertama, pengadukan dilakukan selama proses pencampuran, sedangkan pada teknik kedua pengadukan dilakukan setelah proses pencampuran selesai. Ukuran partikel dikarakterisasi dengan menggunakanXRD, TEM,danPSA, sedangkan karakterisasi luas permukaan digunakanBET. Pada teknik pertama, diperoleh ukuran partikel yang cukup kecil, yaitu sekitar 12 nm - 50 nm, sedangkan pada teknik kedua diperoleh ukuran partikel antara 1.300 nm - 1.600 nm.
Keywords: Ukuran partikel, Teknik pengadukan, Metode kimia basah
INTRODUCTION
In the last decade, there has been an intensive study of materials with well-doped and non-doped
nanostructure TiO2[1-13], such as the stability of the
structure of TiO2whose chemistry, physics, optics [1], the electrical quantities [1-2], and a promising material as a low cost semiconductor [3-5, 9-13].
Materials TiO2exist in three mineral forms, namely anatase, rutile, and brookite [15]. This type of anatase has a tetragonal crystal structure, and is used as a photocatalyst under ultraviolet irradiation. The rutile type also has a tetragonal crystal structure and isused as a white pigment in paint, while the brookite-type crystal
structure is othorombik [1]. Synthesis of nanostructure
TiO2 can be done through several methods, e.g
hydrothermal [3], sol-gel [3, 5, 9,10, 13], nonaqueous (non-sol-gel [2], sputtering thin films [7], and simple
colloidal crystal templating [11]. The research on the
effects of heat treatment on the particle size and surface area of TiO2as a solar cell material has been done, but the effect of stirring time yet many do [14,15].
In this work,we used wet chemical methods for
producing powders consisting of anatase TiO2
2 ) we used two stirring techniques. In the first, the solution
was still stirred during the mixing process; in the second, the stirring was stopped after the mixing of solutions
was finished. Thestirring of speed on both techniques
was 300 rpm. We would see how the stirring-time influences the technique to measure formed crystals.
EXPERIMENTAL METHOD
The synthesis oftitanium oxide TiO2powder used
MERCK standard materials, namely titanium tetrachloride and pH adjustment using ammonium hydroxide. Titanium tetrachloride was introduced into
the reactor at 4oC, and the stirring was set at a rate of 300
rpm. And then it was added to a solution of aquabidest while it was still being stirred. The level of acidity (pH) was set by using ammonium hydroxide to pH 9. The stirring was done without heating for 4 hours, followed
by heating at a temperature of 150oC until it dried. In the
second technique, the stirring was stopped after all the solutions were mixed.
The resulting dry powder was compacted to a diameter of 1.5 cm at a pressure of 3000 psi for 5 minutes,
then calcined at a temperature of 500oC - 700oC each for
2 hours using a heating furnace. The resulting samples were characterized by XRD (shimadzu 7000), BET (Quantachrome instrument V10.01), TEM (JEOL JEM 1400) and PSA (coulter LS 1000).
RESULTS AND DISCUSSION
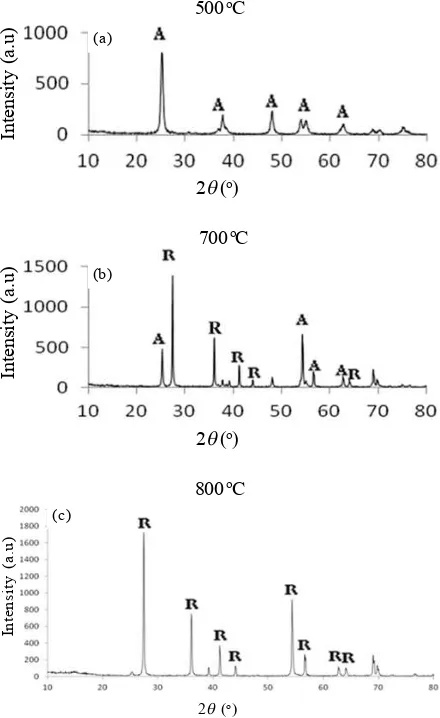
The XRD patterns of the nanoparticles with annealing at 500oCobtained by this method are shown
in Figure 1(a). All the peaks in the XRD patterns can be indexed as anatase phases of TiO2, and has a tetragonal crystalline structure and no existence of the rutile phase. The transition from anatase to rutile phase usually occurs at high temperature over 600oC[4], and this is shown in
the Figure 1(b) where the annealing process is performed at a temperature of 700oC. Similar results were obtained
by David O. Sanlon et al [6]. It explains that the temperature between 600oC-700oCis a phase transition
temperature of anatase to rutile phase. This was confirmed by the results of XRD samples when processed using the second technique and anneal temperature of 800oCwhich shows all the rutile phase.
See Figure 1 (c). The crystallite size was obtained by Debye-Scherrer’s formula, given by Equation (1).
... (1)
where:
D= The crystal size K = Usually taken as 0.89
λ = The wavelength of the X-ray radiation
for CuKα λ= 0.15406 nm
β = The line width at half-maximum height [3]
The crystallite size obtained using this formula is 53 nm. Meanwhile, the average size of the particles produced by the second technique is 1600 nm. The resulting particle size of the second stirring technique is larger than the size of the particles produced in the first stirring technique. This explains the process of diffusion of atoms occur first before stirring, so that the size of the particles formed is greater.
On the other hand, when the mixing process was done after mixing ammonium hydroxide complete, we got particle sizes between 1300 nm-1600 nm. It can be seen from the results of the characterization of particle system analysis, in which the particle size distribution is around that number, see Figure 2.
Theaddition of the solution of TiCl4aquabidest
stars the phase hydrolysis, namely the reaction as Equation (2).
TiCl4 (aq)+ H2O(l)
→
Ti(OH)4 (aq)+ H+(aq)+ Cl-(aq) ... (2)The NH4OH solutionionize slightly due to a weak alkaline solution.
Figure 1. The XRD patterns of TiO2(a) with anneal
500 oC, (b) with anneal 700 oC, and (c) The second
NH4OH(aq)
→
NH4+(aq)+ OH-(aq) ... (3)
This reaction is reversible and the amount of NH4OH that can be ionizedin solution is very slight.
The addition of NH4OH solution give the reaction of Cl
-ions derived from the hydrolysis reaction of TiCl4with
NH4+ions from the ionization reaction NH
4OH, which is
formulated as follows Equations (4).
NH4+
(aq)+ Cl-(aq)
→
NH4Cl(s) ... (4)The NH4Cl compounds experiencethat and form the core aggregation. Furthermore, this core is covered
by a shell composed of a mixture of TiO2 and NH4Cl
compounds. The compounds are derived from the
condensation reaction of TiO2, namely :
Ti(OH)4 (aq)
→
TiO2 (s)+ 2 H2O(l) ... (5)The addition of a solution of TiCl4/H2O with
NH4OH solution result in hydrolysis and condensation
reactions which take place continuously. The hydrolysis reaction leads to the formation of the original nuclei of titanium oxide, while the condensation reaction leads to the formation of the original network system nuclei.
The hydrolysis reaction equilibrium
condensation leads to the formation of TiO2 particles
which are likely to produce a rutile phase. The addition
of NH4OH(aq) for neutralization solves the phase
equilibrium of hydrolysis and condensation phase.
Hydrolysis reaction in this condition increases the formation of anatase phase. The formation of anatase
and rutile TiO2 is determined by hydrolysis and
condensation reactions. If the condensation reaction starts before the hydrolysis reaction is completed, then
the amorphous and anatase TiO2is formed. In addition
to the neutral or base conditions, the condensation reaction starts before the hydrolysis reaction is completed, whereas the acidic conditions would improve
the hydrolysis reaction and reduce condensation. We
argue if the strirring speed increases, the particle size decreases. With increasing stirring speed, the kinetic energy to melt disintegration increases this causes fragmentation of liquid droplets produce smaller particle size. Although we used the same stirring speed, but the first stirring technique has not resulted in agglomeration, so that the particle size obtained is smaller than the size of the particles produced by the second stirring technique.
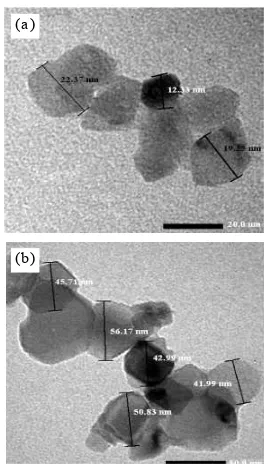
Based on the characterization results of XRD and PSA on samples produced from mixing the two techniques above, then we just do the TEM measurements on samples generated from the first stirring technique. The results we get through the mixing process is done simultaneously while mixing ammonium hydroxide. Transmission Electron Microscope (TEM) was used to study the morphologies of the sample. Figure 3 presents the TEM morphologies of the synthesized TiO2. The TEM characterization results, show that the particles have a size between 12 nm-50 nm.
Brunauer Emmett Teller (BET) was the method used to determine the suface area of each sample. An explanation of the physical adsorption of gas molecules on a solid surface is important in the Figure 2.The distribution of particle size with stirring
technique after mixing is complet.
Figure 3.A TEM image of TiO2nanoparticle (a). 500oC
and (b) 700oC.
(a)
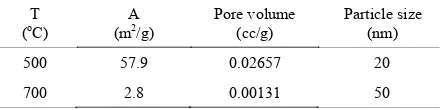
2 ) specified surface area. The results of BET measurements
were performed using temperatures of 500 oC and
700oC and can be seen in Table 1. The surface area
of TiO2 nanoparticles decrease from 57.9 m2/g to 2.8 m2/g with increasing annealing temperatures from 500oCto 700oC, so that it would cause an increase
of crystal size of the TiO2 nanoparticle from 20 nm to 50 nm.
Juntinget alargued that with a higher annealing temperature, the surface area decreases further and the pore volume shows a similar trend, suggesting that densification via grain boundary diffusion in addition to sintering through surface diffusion has occurred [4]. But we obtained somewhat different results. We suspect that the value of pore volume decreases with the increasing annealing temperature. The densification occurs not only through surface diffusion but also through the diffusion of grain boundaries. With increasing temperature and decreasing surface area, it may lead to a decreasing amount of dye adsorbed per unit area of photoelectrode. On the one hand we have to increase the motion of electrons, but this will result in reduced surface area. It is still a challenge to develop higher power efficiency.
CONCLUSION
In the two stirring technique processes used,
the resulting TiO2 nanoparticle size is 20 nm-50 nm
for the first technique, in which the mixing is done in conjunction with the mixing. As for the second technique, it obtained a larger nanoparticle size, i.e. 1300 nm-1600 nm. The XRD pattern data indicated clear peaks of anatase phase without those of the rutile
phase for the TiO2nanoparticles. The anatase phase of
TiO2 nanoparticles were produced with annealing of
500oC, while the rutile phase appeared with annealing
at 700oC.
ACKNOWLEDGMENTS
This work was supported by Pelita Harapan University through Research Proposal No : 2324/TC-FIP-UPH/XII/2013, Listrik Energi Surya Berbasis Nanopartikel Titanium, Yohanes Edi Gunanto.
REFERENCES
[1]. M. M. Byranvand, A. N. Kharat, L. Fatholahi, and. Z. M. Beiranvand. “A Review on Synthesis of
Nano-TiO2 via Different Methods”. Journal of Nanostructure, vol. 3, no. 1, pp. 1-9, 2013. [2]. S. Schattauer, B. Reinhold, S. Albrecht, C.
Fahrenson, M. Schubert, S. Janietz, and D. Neher, “Influence of Sintering on the Structural and Electronic Properties of TiO2Nanoporous Layers Prepared via a Non-sol-gel Approach”. Colloid Polym Sci., vol. 290, no. 18, pp 1843-1854, Dec. 2012.
[3]. R. Vijayalakshmi and V. Rajendran. “Synthesis and Characterization of Nano-TiO2 via Different Methods”.Arch. Appl. Sci. Res, vol 4 no. 2, pp. 1183-1190,2012.
[4]. J. Xi, N. A. Dahoudi, Q. Zhang, Y. Sun, G. Cao. “Effect of Annealing Temperature on the Performances and Electrochemical Properties of TiO2 Dye-Sensitized Solar Cells”. Science of Advanced Materials, vol. 4, no. 7, pp. 727-733(7), July 2012.
[5]. M.Abdennouri, R. Elmoubarki,A. Elmhammedi,A. Galadi, M. Baâlala, M. Bensitel,A. Boussaoud Y. El hafiane, A. Smith and N. Barka. “Influence of Tungsten on the Anatase-Rutile Phase Transition of Sol-gel Synthesized TiO2and on its Activity in the Photocatalytic Degradation of Pesticides”.
J. Mater. Environ. Sci.4 (6) pp. 953-960, Jun. 2013. [6]. David O. Scanlon, Charles W. Dunnill, John Buckeridge, Stephen A. Shevlin, Andrew J. Logsdail, Scott M. Woodley, C. RichardA. Catlow, Michael. J. Powell, Robert G. Palgrave, Ivan P. Parkin, Graeme W. Watson, Thomas W. Keal, Paul Sherwood,Aron Walsh andAlexeyA. Sokol. “Band Alignment of Rutile and Anatase TiO2”.Nature Materials,vol. 12, pp. 798-801, Jul. 2013.
[7]. M. Horprathum, J. Kaewkhao, P. Eiamchai, P. Chindaudom, and P. Limsuwan. “Investigation of Inhomogeneity of TiO2 Thin Films Using Spectroscopic Ellipsometry”.Journal of Physics: Conference Series, vol. 417 pp. 1-6, 2013. [8]. H. Pan, X. D. Wang, S. S. Xiao, L.G. Yu, and Z. J.
Zhang. “Preparation and Characterization of TiO2 Nanoparticles Surface-modified by Octadecyltrimethoxysilane”. Indian Journal of Engineering & Materials Sciences, vol. 20, pp. 561-567, Dec. 2013.
[9]. K. Gupta, R. P. Singh, A. Pandey and A. Pandey. “Photocatalytic Antibacterial Performance of TiO2 and Ag-doped TiO2 Against S. Aureus P. Aeruginosa and E. coli”.Beilstein J. Nanotechnol., vol. 4, pp. 345-351, Jun. 2013.
[10]. G. Zhou, W. Wang, B. Zheng, andY. Li. “Preparation and photocatalytic properties of Fe3+-doped TiO2 nanoparticles”.Eur. Chem. Bull., vol. 2. No.12., pp. 1045-1048, 2013.
[11]. C. Zhang, Q. Zhang, S. Kang, X. Li and Y. Wang. “Facile Synthesis of Hierarchically Porous Metal-TiO2/graphitic Carbon Microspheres by Colloidal Table 1.BET results for the TiO2photoelectrodes annealed at
temperatures 500oC and 700 oC.
T
(oC) (mA2/g) Pore volume(cc/g) Particle size(nm)
Crystal Templating Method”.Int. J. Electrochem. Sci., 8, pp. 8299-8310, Jun. 2013.
[12]. Z. Wen, S. Ci, S. Mao, S. Cui, G. Lu, K.Yu, S. Luo, Z. He and J. Chen. “TiO2 nanoparticles-decorated carbon nanotubes for significantly improved bioelectricity generation in microbial fuel cells”.
Journal of Power Sources,vol. 234, pp. 100-106, Feb. 2013.
[13]. H.-J. Jung. “Characterization of TiO2 Nanocrystalline Films for High Performance Dye-Sensitized Solar Cells”.Transactions on Electrical and Electronic Materials, vol. 12, no. 3, pp. 123-126, Jun. 2011.
[14]. M.C. Kao, H.Z. Chen, and S.L. Young. “Dye-Sensitized Solar Cells with TiO2Nanocrystalline Films Prepared by Conventional and Rapid Thermal Annealing Processes”.Thin Solid Films, vol. 519, no. 10, pp. 3268-3271, Mar. 2011.
[15]. K. Park, J. Xi, Q. Zhang, and G. Cao. “Charge Transport Properties of ZnO Nanorod Aggregate Photoelectrodes for DSCs”. J. Phys. Chem. C,