MICROALLOYING OF FE-CR BY USING ULTRASONIC IRRADIATION
Marzuki Silalahi1,2, Arbi Dimyati2, Sri Harjanto*1, Pudji Untoro2, Bambang Suharno1
1
Metallurgy and Materials Engineering Department, Faculty of Engineering, Universitas Indonesia, Kampus Baru UI Depok 16424, Indonesia
2Center for Technology of Nuclear Industry Material, National Nuclear Energy Agency, Kawasan
Puspitek, Setu, Tangerang Selatan 15314, Indonesia
(Received: August 2013 / Revised: M arch 2014 / Accept ed: June 2014)
ABSTRACT
In this work the formation of Fe-Cr microalloy by ultrasonic irradiation at a frequency of 20 kHz is presented. Two sample series were produced with different ultrasonic irradiation procedures. For the first sample, Fe and Cr powder were each separately brought into the ultrasonic device before they were mixed in 7:1 weight ratio and then together retreated using the ultrasonic method. Secondly, Feand Cr powder with same weight ratio were mixed and directly ultrasonically irradiated. During the ultrasonic irradiation process both samples were put in a toluene solution of 99%. The formation of theFe-Cr microstructure in conjunction with ultrasonication time were investigated by using Scanning Electron Microscopy (SEM ), X-ray Diffraction (XRD) and Transmission Electron Microscopy (TEM). After 40 hours of ultrasonic irradiation the particle sizes of the Fe powder of the first samples became significantly smaller; some particles were also fused together. However, with the exception of smaller-sized particles no fused Cr powders can be found even after 63 hours of ultrasonic irradiation. After both experiments Fe and Cr were mixed and again ultrasonically irradiated for 20 hours. Some particles indicated as Fe-Cr alloys containing 24.34 wt.% Fe and 67.43 wt.% Cr were observed. In the sample produced from the second procedure in which both Fe and Cr powders were irradiated together byan ultrasonic method for 50 hours, some powder particles formed a Fe-Cr microalloy with the composition of 96.27 wt.% Fe and 3.73 wt.% Cr. The XRD analysis revealed that the Fe-Cr alloy from the first samples has a BCC structure with a mass fraction of Fe:Cr:Fe-Cr which is equal to 0.836:0.0294:0.135, while the mass fraction of the Fe-Cr alloy from the second sample series is equal to 0.736:0.0808:0.183, respectively. Analysis of the TEM selected area diffraction patterns (SAED) confirmed that the Fe-Cr microalloy occured originaly from the precursor Fe and Cr particles of size smaller than 2 µm. The Fe-Cr microalloy has been successfully synthesized by using an ultrasonic process.
Keywords: Diffusion; Fe-Cr microalloy; SEM; TEM; Ultrasonic; XRD
1. INTRODUCTION
Fe based alloys such as Fe-Cr have several advantages in replacing the traditional ceramic based materials as interconnecting materials for solid oxide fuel cells (SOFC) due to their suitable and excellent physical properties, such as thermal expansion and high corrosion resistance at elevated temperatures (Willem et al., 2004; Greiner et al., 1995; Badwal, et al., 1997).
*
Crucial properties to be fulfilled by the SOFC materials are a high oxidation resistance in both an air and anode environment, low electrical resistance of the oxide scales formed on the alloy surface as well as good compatibility with the contact materials. In addition, the value of the thermal expansion coefficient should match with those of the other cell components (Malkow et al., 1997). These requirements can potentially be achieved with high chromium ferritic steels (Quadakkers et al., 2000). However, a previous study (Malkov et al., 1998) has shown that none of the commercially available ferritic steels seem to possess the suitable combination of properties required for long-term reliability for cell performance.
In order to obtain Fe-Cr alloys, excavated raw materials are extracted to get nearly pure elements and then mix them together. Atomic scale mixing is a necessary step for making Fe-Cr alloys and the most common and fundamental process is heating to a temperature above the melting point and mixing in the liquid state (Zurek & Gawel, 1993; Shen et al., 1998). Another important method developed so far is a mechanical alloying technique, in which the mixture of the raw material powders is milled in the solid state using a high energy ball mill (Suryanarayana, 2001; Darwin et al., 2010). Alloy powders and/or bulk are then formed into the proper shape for the applications. However, both alloying techniques of melting and mechanical alloying have an intrinsic problem mainly stemming from the use of containers such as a crucible, jar, balls and so on (Choong-Hwan, 2003).
It is not possible to sinter chromium alloyed powders in non-inert atmosphere without causing oxidation. Prealloyed powders with an homogenous alloy concentration are less sensitive to oxidation than mixed powders with an inhomogenous alloy concentration (Arvidsson, 1998). So, to minimize these problems, it is important to merge the microalloy of Fe-Cr as a feed for the further sintering process. The main challenge has been in the ability of evaluating and predicting the progress of an ultrasonic process as a microalloying material processing technique. Ultrasound with a high intensity frequency (or ultrasonic) has become an important synthetic technique for many heterogeneous organic and organometallic reactions. It could enhance the reactivity of metals as stoichiometric reagents. The chemical effects of high intensity ultrasound result primarily from acoustic cavitation: the formation, growth, and implosive collapse of bubbles in liquids. The shock waves generated through this implosion can cause small particles to collide into one another with great force, producing interparticle melting (Stephen et al., 1990; Kenneth, 1980) and feasibility for particle-size reduction (Franco et al., 2004).The mechanism of rate enhancement in reactions of metals has been unveiled by monitoring the effect of ultrasonic irradiation on the kinetics of the chemical reactivity of the solids, examining the effects of irradiation on surface structure and size distributions of powders and solids, and in determining depth profiles of the surface elemental composition (Kenneth, 1989; Suslick et al., 1986; Timothy & John, 2002; Parag et al., 2006).
2. METHODOLOGY 2.1. Materials
In this work, pure Fe (325 mesh) and Cr (325 mesh) powders from the Aldrich Company with a
99.9% high purity were used as precursor materials. Toluene liquid of 90% purity was used as
the processing medium for the ultrasonic irradiation method (Ando et al., 1984; Luche, 1993).
2.2. Experimental method
The ultrasonic alloying method was carried out to synthesize microalloys from a powder mixture of 80 wt.% Fe and 20 wt.% Cr as starting materials. In this work, ultrasonic treatment was applied to two powder mixture samples. The ultrasonic process was performed using the instrument namely, Sonics & Material, INC., USA, Model VCX 750, Ti Horn, 20 kHz. Treatment methods of the samples are summarized in Table 1. Duration of treatments were determined based on preliminary studies which give the most significant results.
Table 1 Summary of the treatments of powder samples
Sample Fe Cr Fe+Cr
A - - Ultrasonic for 50 hours
B Ultrasonic for 40 hours Ultrasonic for 63 hours Ultrasonic for 20 hours
O - - Manual mixture method
For the first sample, both the Fe and the Cr powders were directly mixed and immersed in toluene solute and processed by ultrasonic method. The Fe and Cr powders were mixed with a composition of 80 wt.% and 20 wt.% Cr respectively. The mixture was immersed in a toluene solution with a 1:7 volume ratio in a glass tube. The mixture was loaded into a glass tube, and then poured into a water-filled beaker glass. Afterwards, the ultrasonic process was run with a frequency of 20 kHz while the amplitude was set at 40% of the maximum. The process lasted for 50 hours, hereinafter referred to as Sample A.
The second sample, which was synthesized using Fe and Cr powder as a precursor was processed separately by ultrasonic method before mixing. The ultrasonic method treatment of Fe and Cr powder precursors is needed in order to obtain powders having particles of uniform size. Fe powder was immersed in a toluene liquid solution with a 1:7 volume ratio in a glass tube. Then the solution was transferred into a glass beaker filled with water. The ultrasonic instrument was then operated to run at a frequency of 20 kHz and an amplitude of 40% of the maximum power. The process lasts up to 40 hours. The same process for Cr powder up to 63 hours was also performed. Both of the Fe and Cr powders were then mixed together and ultrasonically processed for 20 hours, hereinafter referred to Sample B.
Both samples are then compared to the third sample, which is a mixture of Fe and Cr powders prepared by a manual mixing method in the mortar (without the ultrasonic treatment). The third
sample was named as Sample O.
2.3. Characterizations
The evolution of the microstructure of Fe-Cr microalloy was observed by using the Scanning Electron Microscopy (SEM) apparatus equipped with the Energy-Dispersive Spectrometry (EDS) in order to identify the elemental composition of the samples. SEM analysis was taken on a JEOL JSM-6510LA at an accelerating energy rate of 20 keV.
= (1)
= (2)
where is the wavelength of incident wave, a is the atomic spacing of unit cell, h, k, and l are
the diffraction plane indices, n is an integer, d is the crystal lattice spacing between atomic
planes, and θ is the angle between the incident ray and the diffraction planes.
To obtain the lattice parameter, the mass fraction of the compound and the structure of crystallites, a refinement of the X-ray diffraction pattern by using RIETAN Software was based on the Rietveld refinement technique (Izumi & Ikeda, 2000). The Rietveld refinement technique is used to fit the reflection intensity by fitting the initial structure parameters to the structural model of a particular crystal belonging to a specific crystal symmetry group. The ideal minimum requirement for a good refinement result is considered to be achieved when the value of the as defined goodness of fit (G) or (S) is ≤ 1.200, with unity being a perfect ideal
number. Here, S is defined by (Franco, 2004; Young, 2000) as follows:
S = Rwp/ Rexp (3)
where Rwpis the weighted profile reliability-factor and Rexp is the expectedreliability-factor. For the Transmission Electrons Microscopy (TEM) characterization method, a Selected Area Electron Diffraction (SAED) image of the samples was additionally used for phase characterization. For this purpose TEM JEOL JEM-1400 with an accelerating voltage of 120 keV was used. For the TEM-investigation a small amount of the sample powder was poured into acetone and mixed in an ultrasonic bath. A small drop of the solution was put on the TEM copper grid covered by thin carbon layer as a sample carrier and subsequently dried in air.
3. RESULTS
3.1. Ultrasonic irradiation of individual precursor powders
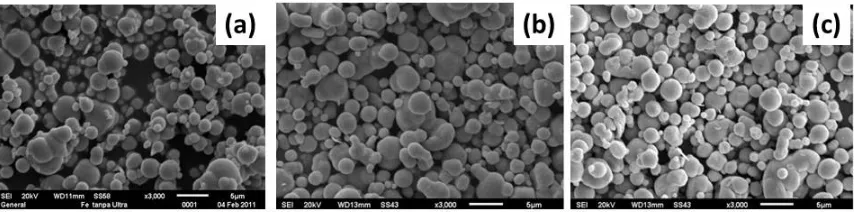
Figure 1 shows SEM micrographs of Fe powder before and after irradiation with ultrasonic waves. It is obvious that as it received the Fe sample, there are nearly spherical structures with sizes ranging from 0.5 to 7 µm, respectively, as shown in Figure 1(a). Figure 1(b) shows the particles after ultrasonic irradiation for 36 hours. The particle size has slightly decreased and has become more homogenous. It seems that some agglomerates have broken up to become separate particles and some have regrouped to form larger agglomerates. After longer ultrasonic irradiation treatment for 40 hours, SEM images of the samples revealed that larger particles seem to be composed from the smaller particles or from melted agglomerate pairs, as shown in Figure 1(c).
SEM images in Figure 2 demonstrate the microstructural change of the precursor Cr powders after ultrasonication. The commercially obtained Cr powder as received shows a large agglomeration containing small Cr particles (Figure 2(a)). Agglomerates have sizes ranging between 20 µm and 50 µm, respectively, and obviously these are formed from small particles of about 2 µm in size (Figure 2(a)). After ultrasonic irradiation for 30 hours the majority of the large agglomerates have dissociated into many smaller particles (Figure 2(b)). However, after 63 hours of undergoing the ultrasonic procedure they are entirely disassociated into many smaller particles having a homogenous size distribution, as shown in Figure 2(c). The average size is about 2 µm.
Figure 2 SEM micrographs of Cr powders: (a) before; (b) after ultrasonic irradiation for 30 h; (c) 63 h
3.2. Ultrasonic irradiation of the precursor powders mixture
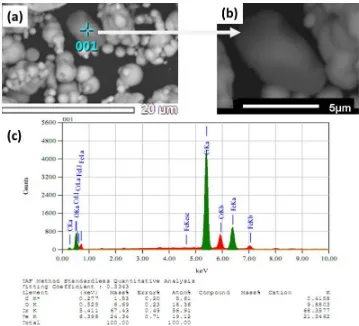
The SEM image of Sample B in Figure 3(a) shows that some particles have formed agglomerates after 20 hours of ultrasonic irradiation as detected using the back scattered electrons BSE method.
However, under the BSE method, it seems that samples of different compositions would appear differently depending on their composition. Figure 3(b) is a magnified image of a particle as indicated in Figure 3(a). The EDS analysis in Figure 3(c) obviously reveals that this particle has to be composed of Fe-Cr. The atomic Fe/Cr ratio is calculated to be 1:3.
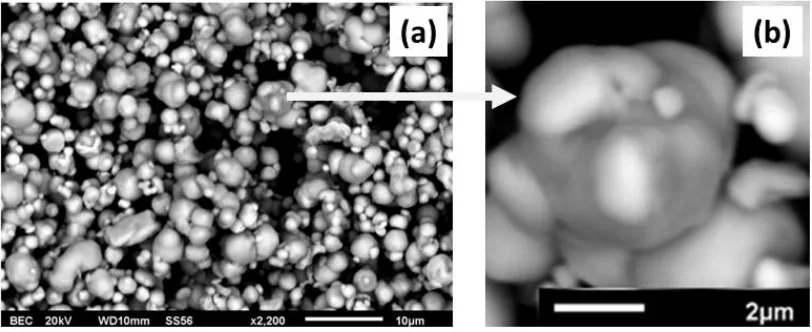
Figure 4(a) shows particles of Sample A, after undergoing the ultrasonic irradiation for 50 hours. The particles, in general, exhibit both the rectangular- and spheroidal-like morphology. The image also shows an agglomeration of some particles which appears to be homogenous at first, however, after closer inspection, there are additional agglomerates that are still heterogeneous, revealing an incomplete fusion of particles, as shown in Figure 4(b).
Figure 4 SEM micrographs of Sample A after ultrasonic irradiation for 50 h: (a) overview; (b) detail
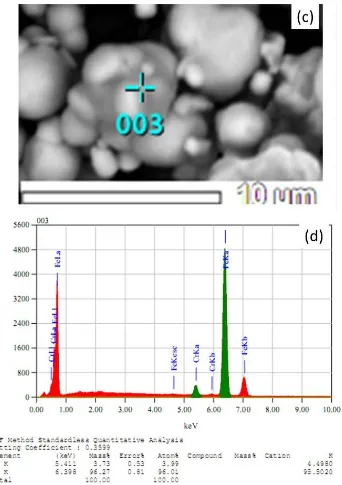
Figures 5(a), 5(b), 5(c) and 5(d) show SEM observation and EDS measurements for Sample A at two representative particles (See also Figure 4(a)). It is clear from Figures 5(a) and 5(c) that the particle morphology has changed from their respective precursors, which indicates that the ultrasonic treatment has caused transformation of the particle morphology. It can be observed also from Figure 5(c) that agglomerization of some particles still takes place leading to alloying of different element particles.
Figure 5(b) illustrates spot analysis of the particle shown in Figure 5(a). It was observed that the particle (spot 002) is composed of 99.1% Fe and 0.9% Cr. In addition, Figure 5(d) shows another spot analysis of the particle after ultrasonic treatment (See also Figure 4(a)). The composition analysis of spot 003 of the particle gives a higher composition of Cr, that is 4.0% Cr, in the Fe-Cr alloy. It means that alloying of Fe-Cr may take place during ultrasonic treatment in the particles.
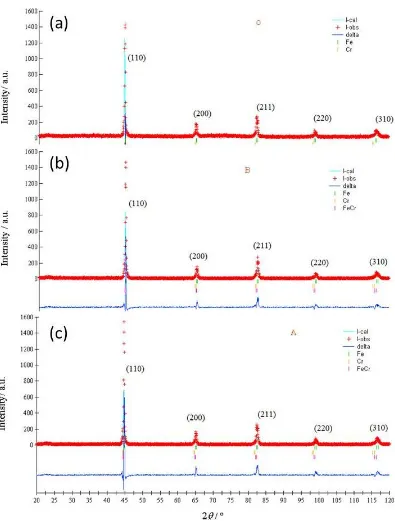
Figures 6(a), 6(b) and 6(c) show a plot of the observed X-ray diffraction patterns for Samples O, B, and A, the Rietveld refinement results of the powder diffraction data for Samples O, B, and A with a (2θ) angular measurement range of 20-120°. Figures 6(a), 6(b) and 6(c) indicate that the angular position of the peaks of the observed X-ray diffraction data are almost the same for all three samples (O, B, and A); they are consistent with the data given in the JCPDF that are the angular positions for each diffraction angle for the (Fe, Cr or FeCr) phases of the same crystal plane that are almost similar. Therefore, it is essential to elucidate on the phases contained in a sample with the Rietveld refinement.
4. DISCUSSION
Figure 5 theSEM-EDS analysis of ultrasonic irradiation of Sample A for 50hours: (a) rectangle particle morphology of Figure 4(a) (of spot 002); (b) EDS spectra spot (of spot 002) of Figure 5(a); (c) incomplete unity particle of Figure 4(a) (of spot 002); (d) EDS spectra of spot 003 of Figure 5(c)
Figure 6 X-ray diffraction pattern for Samples: (a) O; (b) B; (c) A. Observed (+) and calculated (-)
On the other hand, for up to 63 hours in the ultrasonically irradiated Cr particles, the energy microjets and shock waves would result in the propelling of Cr particles from their bonding in the agglomerates as is clearly shown in Figures 2(b) and 2(c). The reduction in the Cr particle size could be caused by the shock wave which produces sufficient energy to cause fragmentation as was reported in other work (Parag et al., 2006).
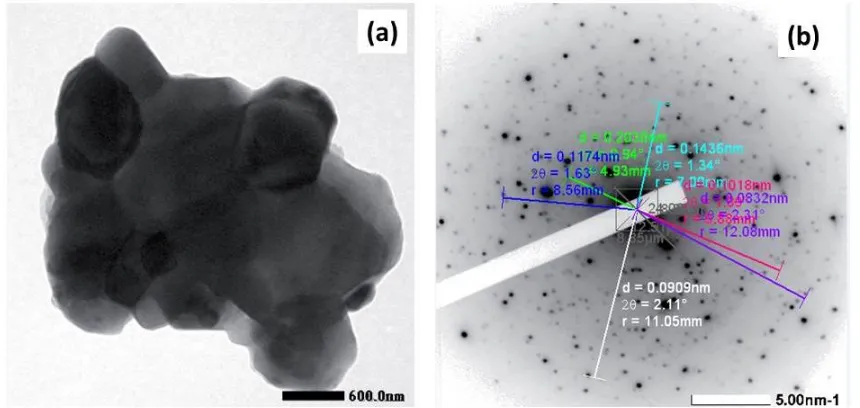
Figure 7 shows the TEM image of Sample B after ultrasonic irradiation. The powder particle has the polygonal type morphology with the size of ca. 600 nm (Figure 7(a)). Figure 7(b) presents SAED pattern showing the polycrystalline nature of the sample.
Figure 7 TEM micrograph of the Fe-Cr powder obtained after the ultrasonic irradiation: (a) Bright Field; (b) indexed SAED pattern
The EDS analysis on the particles in Figure 5(a) (dot 002) indicates that the particles with the rectangular-shaped morphology are actually Fe particles (as indicated in Figure 5(b)). This result shows that the rectangular particle is an agglomerate of several spheroidal Fe particles, obtained after 50 hours of ultrasonic irradiation. Meanwhile, the EDS spot (dot 003) of Figure 5(c) (as in Figure 5(d)) indicates that the particles having the spheroidal-shape morphology consist of Fe with a distribution of Cr particles. The particle showing a neck formation implies that the particle partially alloyed in the melted neck joins the other particles. This result shows that the spheroidal-shaped particle within the necking particle is a partial Fe-Cr alloy.
Reactivity in and around a cavitation site can be described by three zones. The first zone of reactivity is inside the cavitation bubble. Gases and vapors are subjected to high temperatures and pressure in this zone. The second zone is the interface between the bubble and the solution. As the bubble collapses, thermal energy is released into the solution. This heats the immediate area and its surrounding substituents. Estimates of this temperature were made using the Arrhenius equation and the activation parameters of the sonochemically-induced metal carbonyl substitution reactions (Suslick et al., 1986). The temperature in the interfacial region has been estimated to be between 6001500 K. The third zone is the bulk solution. The bulk solution constitutes any region beyond the interface zone. This region experiences the effects of the shock waves.
The shock waves generated from cavitation collapse cause small particles to collide into one another with great force, producing both cohesive interparticles melting and adhesive interparticles melting, as illustrated in Figures 3, 4 and 5. The shock waves produce enormous localized shearing forces which are sufficient in energy for cohesive particles Fe with a particle size < 2 µm to agglomerate to a greater size as was reported by other authors (Franco et al., 2004), and these particles are even able to fuse together to form a singular particle with a new geometry or morphology such as the rectangular shape (see Figures 3(a) and 4(a)). The similar agglomerate results have also been observed in Ni particles (Kenneth & Dominick, 1987). The shock waves energy is also sufficient for particles (Fe and Cr) with a size < 2 µm in order to form adhesive particles of a Fe-Cr microalloy (partially and even completely).
microalloy, it is assumed that this situation materializes when both precursor (Fe and Cr) particles are positioned close together at or near the core of the cavitation at the moment of bubble implosion. Meanwhile, the authors believe that the neck formation of adhesive particles (Fe with melting point 1538oC, and Cr with melting point 1907oC) are joined together, a situation which originates from the effect of the collision of adhesive particles because of the shock energy and therefore this reaction immediately fuses these particles close together by compression pressure with rapid cooling.
Ultrasonic irradiation of Sample B for 20 hours in a toluene solution (with a mixture of Fe (ultrasonically irradiating for 40 hours) and Cr (ultrasonically irradiating for 63 hours)) resulted in the complete Fe-Cr microalloy. On the other hand, ultrasonic irradiation at 20 kHz of Sample A (a mixture of Fe and Cr) for 50 hours in a toluene solution resulted in the partial Fe-Cr microalloy. The irradiation of Sample A took a longer time than that of Sample B because the particle size of the precursor is different. Microalloying of Fe-Cr begins at the precursor particle size of less than 2 µm. The ultrasonic irradiation increases the chemical reactivity of the Fe and Cr metal powders and could be used to produce a Fe-Cr microalloy.
The Rietveld refinement is acceptable for the ideal model according to the criteria required by the goodness of fit (S) parameter (Equation 3) (Young, 1993). Thus, refined parameters could be extracted and further analysis could be carried out. The goodness of fit (S) of the Rietvield refinement results for Samples O, B and A are presented in Table 2. Also, from Figure 6 it seems that the reflection peaks’ fitting between the observed intensity data and the calculated intensity is highly satisfactory, as is evidenced from the almost flat residual plots of the difference (delta) between the observed data and the calculated result. Furthermore, Table 2 shows that the Rietveld refinement is acceptable according to the criteria quoted in the literature (Young et al., 2000), S = 1 for an ideal model. Table 3 listed the Rietveld refinement parameters for Samples O, B, and A.
Table 2 Goodness of fit (S) from Rietvield refinement for Samples O, B and A of Figure 6
O B A
S 1.868 1.914 2.023
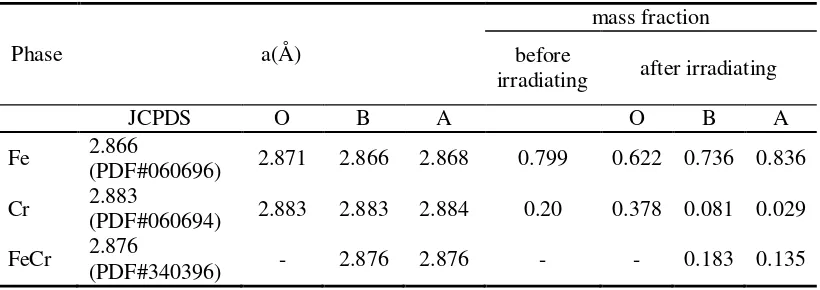
Table 3 Rietveld parameters of Two Phases Rietveld refinements of Sample O, Three Phase Rietveld refinements of Sample B and Three Phase Rietveld refinements of Sample A
The Rietvield refinement analysis of the X-ray diffraction patterns of all samples confirmed the formation of a cubic (bcc) structure for all the samples O, B, and A. These analyses results are in accordance with the PCPDF data (PDF#060696 for Fe, PDF#060694 for Cr, and PDF#340396 for FeCr). The Rietveld Refinements results also show that Sample B contains three phases with the relative fractional mass of each phase for Fe:Cr:FeCr recorded as 0.736:0.081:0.183 and Sample A also contains three phases with the relative fractional mass of each phase for Fe:Cr:FeCr recorded as 0,836:0.029:0.135. The results of the lattice parameters obtained from refinement analysis of the structures are listed in Table 3.
Table 3 also contains Rietveld refinements results of the mass fraction of the phases in each sample. Sample B has a higher indication of the Fe-Cr alloy. Ultrasonically irradiating in a toluene solution for Sample B resulted in an indication of a Fe-Cr microalloy occuring in greater frequency than in Sample A.
The Rietveld Refinements confirmed that the Fe-Cr microalloy could be obtained by applying an ultrasonic irradiation method to the solution Fe, Cr in a toluene liquid for 50 hours or of mixture of Fe (irradiated for 40 hours) and Cr (irradiated for 63 hours) in a toluene liquid for 20 hours. The SAED pattern as presented in Figure 7b is analyzed and the results are plotted in Table 4.
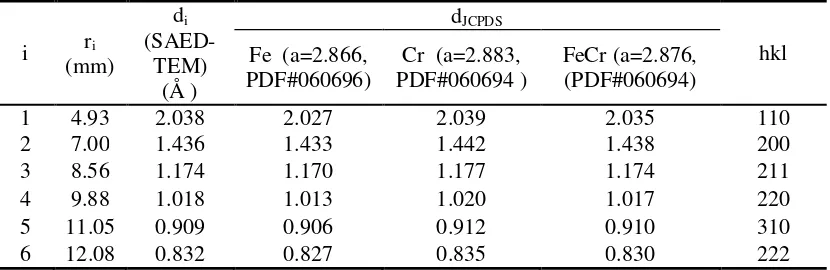
Table 4 SAED pattern analysis parameters including lattice (dJCPDS) and plane (hkl) parameters from JCPDS database
Table 4 contains the lattice parameters (di) of powder particle of the FeCr microalloy obtained
by using an application software (Simple Measure 2) analysis of SAED pattern and also lattice (dJCPDS ) parameters of JCPDS database which correspond to the crystal planes (hkl) of Fe, Cr
and FeCr cubic (bcc) structure. It was shown that the parameter di (obtained from SAED pattern
software analysis) did not really correspond to parameter d (obtained from JCPDS database); there is little difference of the two d data. But, the values of di are all lying between the d values
of Fe and Cr (obtained from JCPDS database). This finding confirms that the experimental or observed di values belong to the new phase, i.e. Fe-Cr, as is already stated by Vegard’s Law as
in (Cullity, 1998). This result is also in accordance with the Rietveld analysis result. The TEM image (Figure 7(a)) shows that the formed FeCr microalloy has a particle size of 600 nm. This confirms that the Fe-Cr microalloy was originaly formed from the precursor particles Fe and Cr with a < 2 µm size as indicated in the SEM image in Figures 3(b) and 4(b).
5. CONCLUSION
have increased the reactivity of the Fe and Cr particles. It then caused dramatic changes in the particles’ morphology and size, fragmentation and agglomeration. The ultrasonic irradiation resulted in the formation of both a partial- (incomplete) and a complete Fe-Cr microalloy. However, the microalloying of Fe-Cr starts with the precursor particles having less than a 2 µm size. Finally, it could be concluded that ultrasonic treatment could be further endorsed and disseminated as a novel method for microalloying of Fe-Cr powders.
6. ACKNOWLEDGEMENT
The authors would like to thank The Indonesian National Nuclear Energy Agency (BATAN) for financial support and Head of the Nuclear Industrial Materials Technology Centre (PTBIN) - BATAN for permission to use their laboratory facilities. We are also very grateful to Mr. Parikin for valuable XRD analysis, Mr. Bambang Sugeng for XRD characterization and discussion, Mr. Rohmad Salam and Mr. Agus Sujatno for sample preparation.
7. REFERENCES
Ando, T., Sumi, S., Kawate, T., Ichihan, J., Hanafusa, T., 1984. J. Chem. Soc., Chem.
Commun., pp. 439
Arvidsson, J., 1998. Proceeding of the PM World Conference. Granada, Spain.
Badwal, S.P.S., Deller, R., Foger, K., Ramprakasih, Y., Zhang, J.P., 1997. Solid State Ionics V
Volume99, pp. 297310
Bais, P., 2000. Control of Protective Atmosphere during Sintering. Proceeding Euro PM200-
sintering and Equipment . Munich. pp 147157
Choong-Hwan, J., Hee-Gyoun L., Chan-Joong K., Bhaduri, S.B., 2003. Synthesis of Cu–Ni Alloy Powder Directly from Metal Salts Solution. Journal of Nanoparticle Research,
Volume 5. pp.383–388
Cullity, B.D., 1998. Introduction to X-Ray Diffraction. Prentice Hall London
Darwin, S., Deni, S.K., Saryanto, H., Sulaiman, H., Othman, M.A., Pudji, U., 2010. Oxidation Resistance of Fe80Cr20 Alloys Treated by Rare Earth Element Ion Implantation. AIP
Conference Proceeding, Volume 1394, pp. 90102
David, B., Williams, C., Barry, C., 2009. Transmission Electron Microscopy A Textbook for Materials Science Springer Science Business Media
Elisabeth, W., Birgitte, N., 2008. Metallographic Preparation of Powder Metallurgy Parts.
Struers A/S, Copenhagen, Denmark Judy Arner, Struers, Inc., Westlake, OH, USA, 02.2008/62140805 Printed in Denmark by Rosendahls Bogtryk 50
Franco, F., Maqueda, P.L.A., Perez-Rodriguez, J.L., 2004. The Effect of Ultrasound on the Particle Size and Structural Disorder of a Wellordered Kaolinite. Journal of Colloid and
Interface Science,Volume274, pp. 107117
Greiner, H., Grogler, T., Kock, W., Singer, R.F., 1995. In:Proc. 4th International Symposium
Solid Oxide Fuel Cell (SOFC IV). Yokohama , Japan. 18-23 June 1995. Edts, Dokiya, M.,
Yamamoto, O., Tagawa, H., Singhal, S., The Electrochem Society, Pennington, NJ, USA, pp. 841-849
Holm, T., 2005. Furnace Atmosphere No. 4. Brazing, Linde Gas Special Edition, Linde Gas,
Munich
Izumi, F., Ikeda, T., 2000. A Rietveld-Analysis Program RIETAN-98 and its Application to Zeolites. Materials Science Forum. pp. 32132; 198203
Kenneth, S.S., 1989. The Chemical Effects of Ultrasound. Scientific American. February
Kenneth, S.S., Dominick J.C., 1987. Heterogeneous Sonocatalysis with Nickel Powder. J. Am.
Chem. Soc., Volume 109(11), pp. 34593461
Luche, J.L., 1993. Sonochemistry from Experiment to Theoretical Considerations. Advances in
Malkov, Th., Quadakkers, W.J., Singheiser, L., Nickel, H., 1998. Report Forschungszentrum
Jülich. Jül-3589, ISSN 0944-2952, October
Malkow, Th., Crone, U.V.D., Laptev, A.M., Koppitz,T., Breuer, U., Quadakkers, W.W., 1997.
In: The Proceedings of The 5th International Sympotium on Solid Oxide Fuel Cell
(SOFC-V), Aachen, Germany, 2-5 June. Ed. Stimming U., Singhal S. C., Tagawa H., Lehen W.,
Electrochemical, Society Inc., Penn., pp. 12441252
Mc.Cusker L.B., Von Dreele, R.B., Cox, D.E., Louer., D., Scardi, P., 1999. Rietveld Refinement Guidelines. Journal of Applied Crystallography, Volume 32, pp. 3650
Parag, R.G., Tayal, R.J., Pandit, A.B., 2006. Cavitation: A Technology on the Horizon. Current
Science,Volume 91(1), pp. 3546
Quadakkers, W.J., Malkov, Th., Pirón-Abellán, J., Flesch, U., Shemet, V., Singheisher, L., 2000. 4th European SOFC Forum. 10-14 July 2000. Luceme CH., Proceedings, Edt. A.
McEvoy. pp. 827836
Shen, J., Xhou, L., Li, T., 1998. Effects of Surfaceapplied Ceria on the Stability of Thermally Growing Chromia Scale of FeCr Alloys and 310 Steel. Journal of Materials Science,
Volume 33, pp. 58135819
Stephen, J.D., Kenneth S.S., 1990. Interparticle Collision Driven by Ultrasonic. Science,
Volume 247, pp. 10671069
Suryanarayana, C., 2001. Mechanical Alloying and Milling. Pergamon, Progress in Materials
Science, Volume 46, pp. 1184
Suslick, K.S., Cline, Jr., R.E., Hammerton, D.A., 1986. Journal of the American Chemical Society, pp. 108
Timothy, J.M., John, P.L., 2002. Applied Sonochemistry the Uses of Power Ultrasound in
Chemistry and Processing. Wiley-CVH Verlag GmbH & Co. KgaA
Torsten, H., Akin, M., Soren, W., 2011. Furnace Atmosphere No.8 Sintering of Steel. Linde
Gas Division, Germany
Willem, J.Q., Piron-Abellan, J., Vladimir, S., 2004. Metallic Materials in Solid Oxide Fuel Cells. Materials Research, Volume 7(1), pp. 203208
Young, R.A., Larson, A.C., Paiva-Santos, O., 2000. User’s Guide to Program dbws-9807a for Rietveld Analysis of X-ray and Neutron Powder Diffraction Patterns with a PC and
Variation Other Computers. School of Physics, Georgia Institute of Technology, Atlanta,
GA, E.U.A
Zurek, Z., Gawel, J., 1993. Sulfidation of Fe-Cr Binary Alloys in Hz/H2S Atmosphere at 873-1073 K. Journal De Physique IV 327. Colloque C9, supplement au Journal de Physique