Zabbix 1.8 Network Monitoring
Monitor your network's hardware, servers, and
web performance effectively and efficiently
Rihards Olups
Copyright © 2010 Packt Publishing
All rights reserved. No part of this book may be reproduced, stored in a retrieval system, or transmitted in any form or by any means, without the prior written permission of the publisher, except in the case of brief quotations embedded in critical articles or reviews.
Every effort has been made in the preparation of this book to ensure the accuracy of the information presented. However, the information contained in this book is sold without warranty, either express or implied. Neither the author, nor Packt Publishing, and its dealers and distributors will be held liable for any damages caused or alleged to be caused directly or indirectly by this book.
Packt Publishing has endeavored to provide trademark information about all of the companies and products mentioned in this book by the appropriate use of capitals. However, Packt Publishing cannot guarantee the accuracy of this information.
First published: April 2010
Production Reference: 1220310
Published by Packt Publishing Ltd. 32 Lincoln Road
Olton
Birmingham, B27 6PA, UK. ISBN 978-1-847197-68-9 www.packtpub.com
Credits
Author
Rihards Olups
Reviewers Kris Buytaert
Renard Philippe
Acquisition Editor Rashmi Phadnis
Development Editors Amey Kanse
Rakesh Shejwal
Technical Editor Vinodhan Nair
Indexer Rekha Nair
Editorial Team Leader Gagandeep Singh
Project Team Leader Lata Basantani
Project Coordinator Joel Goveya
Proofreader Lesley Harrison
Graphics
Geetanjali Sawant
Production Coordinator Aparna Bhagat
About the Author
Rihards Olups has over 10 years of experience in IT. He has had a chance to
work with various systems, and most of that time has been spent with open source solutions. Exposure to Zabbix, one of the leading open source enterprise class monitoring solutions, was with the first public releases more than nine years ago, which has allowed to gain practical knowledge on the subject.Previously employed by a government agency, Rihards was mostly involved in open source software deployments ranging from server to desktop grade software, with a big emphasis on Zabbix. More recently the author has joined Zabbix SIA, the company behind the software that this book is about, which has allowed him to gain even more experience with the subject.
Huge thanks to my mother, grandmother, and brother for being there, and to my Bumblebee for enduring through the process of writing the book.
Of course, thanks to the whole Zabbix team and community—there would be no subject of this book without them. Special kudos go to Alexei, who started this whole thing called Zabbix.
About the Reviewers
Kris Buytaert is a long time Linux and Open Source Consultant working on Linux
and open source projects in Belgium, Europe, and the rest of the universe. He is currently working for Inuits.Kris is the co-author of Virtualization with Xen, used to be the maintainer of the openMosix HOWTO, and is the author of different technical publications. He is a frequent speaker at different international conferences.
He spends most of his time working on Linux Clustering (both High Availability, Scalability, and HPC), Virtualization, and Large Infrastructure Management projects hence trying to build infrastructures that can survive the 10th floor test, better known today as "the cloud".
His blog titled "Everything is a Freaking DNS Problem" can be found at http://www.krisbuytaert.be/blog/.
Renard Philippe has traveled extensively during his youth, due to which he
has had the opportunity to make his primary and secondary education in many countries (mostly in the Middle East, north Africa, and Europe).The choice of higher education has brought him to the field of IT, for which he always had a passion.
Table of Contents
Preface
1
Chapter 1: Getting Started with Zabbix
7
First steps in monitoring 7
Zabbix features and architecture 9
Installation 10
Server and agent 12
Software requirements 13
Hardware requirements 13
Getting the source 14
Compilation 14
Initial configuration 15
Creating and populating the database 16
Starting up 17
SUSE Linux Enterprise Server 18
Slackware 27
Verifying the service's state 31
The Web frontend 32
Prerequisites and setting up the environment 32
Installation of the web frontend 33
Step 1 – Welcome 33
Step 2 – Licence 34
Step 3 – PHP prerequisites 34
Step 4 – Database access. 36
Step 5 – Zabbix server details 37
Step 6 – Summary 38
Step 7 – Writing the configuration file 38
Step 8 – Configuration file in place 40
Step 9 – Finishing the wizard 40
Step 10 – Logging in 41
Chapter 2: Getting Your First Notification
45
Information flow in Zabbix 63
Let's create some load 64
Basic item configuration 66
How items can be monitored 70
Summary 72
Chapter 3: Monitoring with Zabbix Agents and Basic Protocols
73
Using Zabbix agent 73
Setting up ICMP checks 95
Tying it all together 97
Positional parameters for item descriptions 97
Using mass update 98
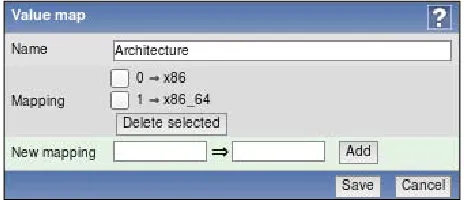
Value mapping 100
Copying items 102
Summary 106
Chapter 4: Monitoring SNMP and IPMI Devices
107
Simple Network Management Protocol 107
Using Net-SNMP 108
Using SNMPv3 with Net-SNMP 112
Adding new MIBs 113
Working with SNMP items in Zabbix 115
Dynamic indexes 119
Receiving SNMP traps 123
Trap handling schemes 129
Intelligent Platform Management Interface 136
Dell Remote Access Controller 136
Preparing Zabbix for IPMI querying 136
Configuring DRAC IPMI access 137
Setting up IPMI items 138
Card attached to one of the already monitored hosts 139
Card attached to a different host 139
Creating IPMI item 140
Summary 142
Chapter 5: Managing Hosts, Users, and Permissions
143
Host and host groups 143
Users, user groups, and permissions 149
Authentication methods 149
Creating a user 150
Creating user groups 156
Summary 164
Chapter 6: Acting Upon Monitored Conditions
165
Triggers 165
Trigger dependencies 168
Constructing trigger expressions 173
Triggers that time out 177
Human-readable constants 177
Event details 177
Event generation and hysteresis 178
Actions 180
Limiting conditions when actions are sent 180
Additional action conditions 182
Integration with issue management systems 196
Bugzilla 196
CA Unicenter Service Desk 197
Using scripts as media 197
Remote commands 199
Chapter 7: Simplifying Complex Configuration with Templates
203
Identifying template candidates 203
Creating a template 204
Linking templates to hosts 206
Changing configuration in template 211
Macro usage 212
Using multiple templates 214
Unlinking templates from hosts 216
Nested templates 217
Summary 220
Chapter 8: Visualizing the Data
221
Visualize what? 221
Showing data on a big display 257
Challenges 257
Non-interactive display 257
Information overload 258
Displaying a specific section automatically 258
Recent change flashing 259
Summary 260
Chapter 9: Creating Reports
261
Simple reports 261
Status of Zabbix 261
Availability report 263
Most busy triggers top 100 264
Bar reports 265
Distribution of values for multiple periods 266
Distribution of values for multiple items 269
Comparing values for multiple periods 273
Chapter 10: Advanced Item Monitoring
279
Aggregate items 279
External checks 282
User parameters 287
Just getting it to work 287
Querying data that Zabbix agent does not support 288
Flexible user parameters 289
Level of the details monitored 291
Environment trap 293
Things to remember about user parameters 296
Wrapper scripts 296
Other methods to gather data 297
Sending in the data 297
Using custom agents 300
Summary 301
Chapter 11: Monitoring Windows and Web Pages
303
Monitoring web pages 303
Creating web monitoring scenario 303
Windows-specific monitoring 310
Installing Zabbix agent for Windows 310
Querying performance counters 314
Using numeric references to performance counters 315
Using aliases for performance counters 318
Monitoring Windows services 318
Checking whether an automatic service has stopped 320
Summary 321
Chapter 12: Using Proxies to Monitor Remote Locations
323
When proxies are useful 323
Setting up the proxy 325
Monitoring a host through a proxy 327
Proxy benefits 329
Proxy reliability 331
Tweaking proxy configuration 333
Summary 334
Chapter 13: Working Closely with Data
335
Getting raw data 335
Extracting from the frontend 335
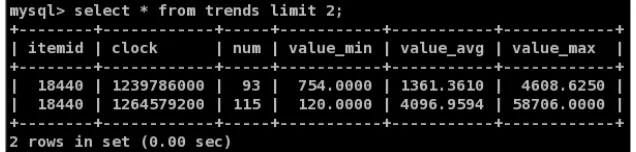
Querying the database 337
Diving further in the database 342
Managing users 342
Converting a host to a template 345
Changing existing data 346
Finding out "when" 347
"When" in computer language 347
Finding out what 347
Performing the change 347
Using XML import/export for configuration 348
Exporting initial configuration 348
Modifying configuration 348
XML export format 349
Script around the export 350
Importing modified configuration 351
Summary 352
Chapter 14: Upgrading Zabbix
353
General policy 353
Minor or major level upgrades 357
Patching the database 358
Frontend configuration file 361
Compatibility 361
Summary 362
Chapter 15: Taking Care of Zabbix
363
Internal items 363
Performance considerations 368
Reducing the query count 369
Increasing write performance 370
Who did that? 372
Real men make no backups 374
Backing up the database 374
Restoring from backup 376
Separating configuration and data backups 377
Appendix A: Troubleshooting
381
Installation 381
Compilation 381
Frontend 383
Starting services 383
Frontend 383
Locked out of the frontend 385
Problems with monitoring 386
General monitoring 386
Monitoring with Zabbix agent 386
User parameters 388
Problems with SNMP devices 388
Problems with IPMI monitoring 389
Problems with ICMP checks 389
General issues 389
Triggers 390
Actions 390
Appendix B: Being Part of the Community
391
Community and support 391
Using the Zabbix forum 392
Editing the wiki 392
Chatting on IRC 393
Filing issues on the tracker 394
Following the development 394
Getting the source 395
Daily snapshots 395
Accessing the version control system 396
Commercial support options 400
Summary 401
Preface
Imagine you're celebrating the start of the weekend with Friday-night drinks with a few friends. And then suddenly your phone rings—one of the servers you administer has gone down, and it needs to be back up before tomorrow morning. So you drag yourself back to the office, only to discover that some logfiles have been growing more than usual over the past few weeks and have filled up the hard drive.
While the scenario above is very simplistic, something similar has happened to most IT workers at one or another point in their careers. To avoid such situations this book will teach you to monitor your network's hardware, servers, and web performance using Zabbix - an open source system monitoring and reporting solution.
What this book covers
In Chapter 1, Getting Started with Zabbix, we'll cover Zabbix installation from scratch, including the initial database, server and agent daemons, and web frontend, all running on the same machine and configure the Zabbix web frontend, using PHP to access the database.
Chapter 2, Getting Your First Notification, will cover configuring Zabbix using the frontend to set up data gathering, triggering upon specified conditions, and informing us by sending an e-mail for a single data source.
In Chapter 3, Monitoring with Zabbix Agents and Basic Protocols, we'll set up the most widely used and basic data gathering methods—Zabbix agents and simple checks such as ICMP ping and direct TCP service checking.
Chapter 5, Managing Hosts, Users, and Permissions, will cover hosts, users, and permissions, including host and user group functionality and their impact on permissions.
In Chapter 6, Acting Upon Monitored Conditions, we'll look at ways to define which conditions are noteworthy by configuring triggers and how to react to such conditions by sending e-mail, launching an external script, opening a report in a separate bug tracker, or even restarting a faulty service. We will also learn to configure escalations in Zabbix and figure out how hysteresis works.
In Chapter 7, Simplifying Complex Configuration with Templates, we'll learn that we did it all wrong before and improve our configuration by using templates that allow us to apply uniform configuration to a bunch of hosts. We'll also explore template nesting which allows creating very flexible configuration in a large and mixed environment.
In Chapter 8, Visualizing the Data, we'll create visual elements to display the gathered data, including several types of graphs, interactive network maps, screens that collect various types of elements to display, and slideshows that allow cycling through several screens in an automated fashion.
In Chapter 9, Creating Reports, we'll use the built-in reporting capabilities of Zabbix such as status of Zabbix, availability reports, most often happening problems reports, and the heavily configurable bar reports.
In Chapter 10, Advanced Item Monitoring, we'll find out about more advanced ways to gather information by using external, aggregate, and custom item types to retrieve basically any information.
In Chapter 11, Monitoring Windows and Web Pages, we'll set up some Windows monitoring by installing Zabbix agent and using performance counters, as well as get to monitoring accessibility, performance, and availability of web pages. In Chapter 12, Using Proxies to Monitor Remote Locations, we'll explore usage of proxies that collect the data on behalf of the Zabbix server and then transmit it back to the server, which helps with remote locations that can't be accessed directly because of firewall concerns and also reduces load on the Zabbix server.
In Chapter 14, Upgrading Zabbix, we'll learn about the Zabbix upgrade procedure, how different components of various versions can interact and what database patching between versions involves.
In Chapter 15, Taking Care of Zabbix, we'll look in more detail at the Zabbix setup itself and check out what internal health and performance metrics we can use, what simple first steps we can take to improve performance, and what internal logging and auditing options are available.
In Appendix A, Troubleshooting, we'll look at common pitfalls with installation, connectivity, configuration, and other areas.
In Appendix B, Being Part of the Community, we'll find out that we are not alone and there's a community around the Zabbix monitoring solution, which we can reach via forums, IRC, and the wiki.
Who this book is for
This book assumes no experience with Zabbix and minimal experience with Linux. The knowledge provided by this book, will be useful if:
You are responsible for managing in-house IT infrastructure such as network hardware, servers, and web pages
You are responsible for managing a non-IT infrastructure that provides data such as temperature, flow, and other readings
You have clients with strict accessibility requirements and want to monitor the hardware that provides services to them
You are a system administrator who wants to monitor their network hardware, servers, and web performance
Conventions
In this book, you will find a number of styles of text that distinguish between different kinds of information. Here are some examples of these styles, and an explanation of their meaning.
Code words in text are shown as follows: "If you see a file and directory listing instead of the installation wizard, make sure you have added index.php to DirectoryIndex directive."
A block of code will be set as follows zagent_start() {
if [ -x $BINLOCATION/zabbix_agentd ]; then if processcheck zabbix_agentd; then
echo "Zabbix agent daemon already running" else
echo "Starting zabbix agent daemon: $BINLOCATION/zabbix_agentd" $BINLOCATION/zabbix_agentd
fi else
echo "Executable $BINLOCATION/zabbix_agentd not present" fi
}
Any command-line input and output is written as follows:
# useradd -m -s /bin/bash zabbix
New terms and important words are shown in bold. Words that you see on the screen, in menus or dialog boxes for example, appear in the text like this: "clicking the Next button moves you to the next screen".
Warnings or important notes appear in a box like this.
Tips and tricks appear like this.
Reader feedback
Feedback from our readers is always welcome. Let us know what you think about this book—what you liked or may have disliked. Reader feedback is important for us to develop titles that you really get the most out of.
If there is a book that you need and would like to see us publish, please send us a note in the SUGGEST A TITLE form on www.packtpub.com or e-mail
If there is a topic that you have expertise in and you are interested in either writing or contributing to a book on, see our author guide on www.packtpub.com/authors.
Customer support
Now that you are the proud owner of a Packt book, we have a number of things to help you to get the most from your purchase.
Downloading the example code for the book
Visit http://www.packtpub.com/files/code/7689_Code.zip to directly download the example code.
The downloadable files contain instructions on how to use them.
Errata
Although we have taken every care to ensure the accuracy of our content, mistakes do happen. If you find a mistake in one of our books—maybe a mistake in the text or the code—we would be grateful if you would report this to us. By doing so, you can save other readers from frustration and help us improve subsequent versions of this book. If you find any errata, please report them by visiting http://www. packtpub.com/support, selecting your book, clicking on the let us know link, and entering the details of your errata. Once your errata are verified, your submission will be accepted and the errata will be uploaded on our website, or added to any list of existing errata, under the Errata section of that title. Any existing errata can be viewed by selecting your title from http://www.packtpub.com/support.
Piracy
Please contact us at [email protected] with a link to the suspected pirated material.
We appreciate your help in protecting our authors, and our ability to bring you valuable content.
Questions
Getting Started with Zabbix
It's Friday night, and you are at a party outside the city with old friends. After a few beers it looks like this is going to be a great party, when suddenly your phone rings. A customer can't access some critical server that absolutely has to be available as soon as possible. You try to ssh in the server, only to discover that customer is right—it can't be accessed.
As driving after those few beers would quite likely lead to inoperable server for quite some time, you get a taxi (expensive because of the distance. While many modern systems have out-of-bands management cards installed that might have helped a bit in such a situation, our hypothetical administrator does not have one available). After arriving at the server room, you find out that some logfiles have been growing more than usual over the past few weeks and have filled up the hard drive.
While the scenario above is very simplistic, something similar has probably happened to most IT workers at one or another point in their careers. Most implemented a simple system monitoring and reporting solution soon after that.
We will learn to set up and configure one such monitoring system—Zabbix.
First steps in monitoring
One of the first monitoring solutions most administrators implement is a simple shell script, invoked from crontab, that checks some basic parameters like disk usage or some service state, like Apache server. As the server and monitored parameter count grows, a neat and clean script systems starts to grow into a performance-hogging script hairball that costs more time in upkeep than it saves. While do-it-yourself crowds claim that nobody needs dedicated software for most tasks (monitoring included), most administrators will disagree as soon as they have to add switches, UPSes, routers, IP cameras, and a myriad of other devices to the swarm of monitored objects.
So what basic functionality can one expect from a monitoring solution? They are as follows:
Data gathering: This is where everything starts. Usually data will be
gathered using various methods, including SNMP, agents, IPMI, and others. Alerting: Gathered data can be compared to thresholds and alerts sent out when needed using different channels, like e-mail or SMS.
Data storage: Once we have gathered the data it doesn't make sense to throw it away, so we will often want to store it for later analysis.
Visualization: Humans are better at distinguishing visualized data than raw numbers, especially when there are huge amounts of them. As we have data already gathered and stored, it is trivial to generate simple graphs from it. Sounds simple? That's because it is. But then we start to desire more features like easy and efficient configuration, escalations, permission delegation, and so on. If we sit down and start listing the things we want to keep an eye out for, it may turn out that area of interest extends beyond the network—for example, a hard drive that has SMART errors logged, an application that has too many threads, or a UPS that has one phase overloaded. It is much easier to manage monitoring of all these different problem categories from a single configuration point.
In the quest for a manageable monitoring system wondrous adventurers stumbled upon collections of scripts much like the way they implemented themselves, obscure and not so obscure workstation-level software, and heavy, expensive monitoring systems from big vendors.
Another group is open source monitoring systems that have various sophistication levels, one of which is Zabbix.
Zabbix features and architecture
Zabbix provides many ways to monitor different aspects of your IT infrastructure and indeed, almost anything one might want to hook to it. It can be characterized as a semi-distributed monitoring system with centralized management. While many installations have a single central database, it is possible to use distributed monitoring with nodes and proxies, and most installations will use Zabbix agents. So what features does Zabbix provide? They are:
Centralized, easy to use web interface
Server that runs on most Unix-like operating systems, including Linux, AIX, FreeBSD, OpenBSD, and Solaris
Native agents for most Unix-like operating systems and Microsoft Windows versions
Ability to directly monitor SNMP (v1, 2, and 3) and IPMI devices Built-in graphing and other visualization capabilities
Notifications that allow for easy integration with other systems Flexible configuration, including templating
And a lot of other features that would allow you to implement a sophisticated monitoring solution
If we look at a simplified network from the Zabbix perspective, placing Zabbix server at the center, the communication of the various monitoring aspects matters. The following image depicts a relatively simple Zabbix setup with several of the monitoring capabilities used and different device categories connected.
Our central object is the Zabbix database, with several backends supported. Zabbix server, written in C, and web frontend written in PHP, can both reside on the same machine or on another server. When running each component on a separate machine, both the Zabbix server and the frontend need access to the database, and frontend optionally needs access to Zabbix server to show server status. Required connection directions are depicted by arrows in the following image.
Zabbix Server Zabbix Frontend
Zabbix server directly monitors multiple devices, but a remote location is separated by a firewall, so it gathers data through a Zabbix proxy. Zabbix proxy and agents, just like the server, are written in C.
While it is perfectly fine to run all three server components on a single machine, there might be good reasons to separate them, like taking advantage of an existing high performance database or web server.
In general, monitored devices have little control over what is monitored—most of the configuration is centralized. Such an approach seriously reduces the capabilities of single misconfigured system to bring down the whole monitoring setup.
Installation
The frontend will provide various options for visualizing data, starting from problem lists and simple graphs ending with network maps and reports, while backend will work hard to provide information that this visualization is based on and send out alerts. All of this will require some configuration that we will learn to perform along the course of this book.
Before we can configure Zabbix, we need to install it. Usually you'll have two
choices—either installing from distribution packages, or setting it up from the source code. Unless you highly value distribution packaging and are not ready to roll your own packages, it is suggested to set up the latest version from sources, because Zabbix is being developed at a relatively noticeable pace and there's always some neat feature in the next version that makes life easier.
At first we will set up Zabbix server, database, and frontend, all running on the same machine and using a MySQL database.
If you decide to install Zabbix from your distribution packages, installation procedure and package naming schemes will differ. Refer to your distribution's documentation for that information.
There are a few benefits to using distribution packages. These include:
Automated installation and updating Dependencies usually sorted out
Compiling from source also has its share of benefits. They are:
Newer versions with more features and improvements More fine-grained control over compiled-in functionality
Server and agent
The most widely-used Zabbix architecture is a server that queries agents. That's what we will learn to set up so that we can monitor our test system.
As with most software, there are some prerequisites that we will need to run Zabbix components. That includes requirements for hardware and other software that the Zabbix server and agent depend on. For the purpose of these instructions, we will settle on running Zabbix on Linux, using a MySQL database. The specific Linux distribution does not matter much—it's best to choose the one you are most familiar with.
• •
Software requirements
Now we should get to compiling the various components of Zabbix, so make sure to install the minimum required packages to get Zabbix working with MySQL. They are:
GCC Automake
MySQL (http://www.mysql.com/)
Depending on your distribution and the desired functionality you might also need some or all of the following packages:
zlib-devel
mysql-devel (for MySQL support) glibc-devel
curl-devel (for web monitoring)
libidn-devel (curl-devel might depend on it) openssl-devel (curl-devel might depend on it) net-snmp-devel (for SNMP support)
popt-devel (net-snmp-devel might depend on it) rpm-devel (net-snmp-devel might depend on it) OpenIPMI-devel (for IPMI support)
libssh2-devel (for direct SSH checks)
Hardware requirements
Hardware requirements vary wildly depending on the configuration. It is impossible to give definite requirements, so any production installation should evaluate them individually. For our test environment, though, even as little RAM as 128 MB should be enough. CPU power in general won't play a huge role; Pentium II class hardware should be perfectly capable of dealing with it, although generating graphs with many elements or other complex views can require more powerful hardware to operate at an acceptable speed. You can take these as a starting point as well when installing in a virtual machine.
Getting the source
There are several ways to download the source of Zabbix. You can get the source code from a SVN repository, which will be discussed in Appendix B, however for this installation procedure it is suggested to download version 1.8.1 from the Zabbix homepage; http://www.zabbix.com/. While it should be possible to use latest stable version, using 1.8.1 will allow to follow instructions more closely. Go to the Download section and grab the compressed source package. Usually only the latest stable version is available on the downloads page, so you might have to browse the source archives, though do not take development or beta version, which might be available.
To ease further references, it is suggested that you choose a directory to work in, for example, ~/zabbix (~ being your home directory). Download the archive into this directory.
Compilation
Once the archive has finished downloading, open a terminal and extract it:
$ cd ~/zabbix; tar -zxvf zabbix-1.8.1.tar.gz
It is suggested that you install the requirements and compile Zabbix with external functionality right away so that you don't have to recompile as we progress. For the purpose of this book, we will compile Zabbix with server, agent, MySQL, curl, SNMP, and IPMI support.
To continue, enter the following in the terminal:
$ cd zabbix-1.8.1
$ ./configure --enable-server --with-mysql --with-net-snmp --with-libcurl --with-openipmi --enable-agent
In the end, a summary of compiled components is printed. Verify that you have the following enabled:
If configure completes successfully, it's all good. If it fails, check the error messages printed in the console and verify that all prerequisites are installed. A file named config.log might provide more detail on the errors. If you can't find out what's wrong, check Appendix A, Troubleshooting, which lists some common compilation problems.
To actually compile Zabbix, issue the next command.
$ make
You can get a cup of tea, but don't expect to have much time—Zabbix compilation doesn't take too long, even an old 350 MHz Pentium II compiles it in approximately five minutes. After the make process has finished, check the last lines for any error messages. If there are none, congratulations, you have successfully compiled Zabbix. Now we should install it. Despite the output of configure and many How Tos suggesting so, do not run makeinstall. It unnecessarily complicates package management and can lead to weird problems in future. Instead, you should create proper packages for your distribution. This process is package system specific, learning them all would be cumbersome, but there's a universal solution—software named CheckInstall (http://www.asic-linux.com.mx/~izto/checkinstall/). Packages should be available for most distributions, and it supports the creation of Slackware, RPM, and Debian packages.
To create a proper Zabbix package make sure that CheckInstall is installed and execute as root:
# checkinstall --nodoc --install=yes -y
This will create and install a package that you will later be able to remove using your system's package management tool. The created package's location depends on your distribution—for Slackware, it's the directory you executed CheckInstall from, for RPM-based distributions it is usually /usr/src/packages/RPMS/<architecture>.
Initial configuration
After compilation, we have to configure some basic parameters for the server and agent. There are example configuration files provided with the Zabbix package, so let's use those. Again, as root execute:
# mkdir /etc/zabbix
# cp misc/conf/{zabbix_server.conf,zabbix_agentd.conf} /etc/zabbix
For the server we will need to make some changes. Open /etc/zabbix/zabbix_ server.conf in your favorite editor (you will need to run it as root) and find the following entries in the file:
DBName DBUser DBPassword
DBName should be zabbix by default, and we can leave it as is. DBUser is set to root, and we don't like that, so let's change it to zabbix. For DBPassword, choose any password. You won't have to remember it, so be creative.
After we insert a password into this configuration file, we should restrict the file's permissions so that the password is not that easy to obtain. This is done as shown below:
# chmod 400 /etc/zabbix/zabbix_server.conf # chown zabbix /etc/zabbix/zabbix_server.conf
Creating and populating the database
For the Zabbix server to store data, we have to create a database. Start a MySQL client.
$ mysql -u root -p
Enter the root user password for MySQL (you would have set this during the installation of MySQL, or the password could be something that is the default for your distribution). If you do not know the password, you can try omitting -p. This switch will tell the client to attempt to connect with an empty password.
Now let's create the database. Add the user that Zabbix would connect to the database as, and grant necessary permissions to this user:
mysql> create database zabbix character set utf 8;
Query OK, 1 row affected (0.01 sec)
mysql> grant all privileges on zabbix.* to 'zabbix'@'localhost' identified by 'mycreativepassword';
Query OK, 0 rows affected (0.12 sec)
Use the same password you set in zabbix_server.conf file instead of mycreativepassword.
Quit the MySQL client by entering the following command:
mysql> quit
Let's populate the newly-created database with Zabbix schema and initial data.
$ mysql -u zabbix -p zabbix < create/schema/mysql.sql $ mysql -u zabbix -p zabbix < create/data/data.sql
Next, let's insert the images to be used in network maps. While these images are not required for basic functionality, we'll want to create some nice looking network maps later.
$ mysql -u zabbix -p zabbix < create/data/images_mysql.sql
All three importing processes should complete without any messages. If there are any errors, review the messages, fix the issue, and retry the failed operation. Note, if the import is interrupted in the middle of the process, you might have to clear the database—easiest way to do that is deleting the database by typing:
mysql> drop database zabbix;
Query OK, 0 rows affected (0.00 sec)
Be careful not to delete any database with important information! After deleting the Zabbix database recreate it and assign the correct user permissions, as indicated above.
By now we should have Zabbix server and agent installed, and ready to start.
Starting up
You should never start the Zabbix server or agent as root, which is common sense for most daemon processes, so let's create user to run these processes. You can use tools provided by distribution, or the most widely available command— useradd, which we need to execute as root:
# useradd -m -s /bin/bash zabbix
This will create user named zabbix with a home directory in the default location (usually /home/zabbix) and shell at /bin/bash, which will be needed for advanced parameters later on.
For the first startup of both server and agent let's try the direct approach— as root execute:
This will start the Zabbix agent daemon, which should start up silently and daemonize. If the above command produces errors, resolve those before proceeding. If it succeeds, continue by starting the Zabbix server.
# /usr/local/sbin/zabbix_server
We are using zabbix_agentd that runs as a daemon. While there's also the zabbix_agent executable that provides an option to be run within inetd, it does not support active items and in most cases will have worse performance than the agent daemon.
If you decided to install distribution packages of Zabbix above binaries will most likely be located in a different directory, but they should be in your path—so try running the agent and server without specifying a directory name.
The latest versions of Zabbix, including 1.8, automatically drop root privileges on startup and run as the zabbix user.
While it's nice to have Zabbix running, that's hardly a process one expects to do manually upon each system boot, so the server and agent should be added to your system's startup sequence. This is fairly distribution specific, so all possible variations can't be discussed here. Instead, examples for SUSE Linux Enterprise Server and Slackware startup scripts will be provided.
SUSE Linux Enterprise Server
The Zabbix package provides example startup scripts, but they are somewhat outdated. Here are init scripts for Zabbix server and agent daemons, based on the SUSE Linux Enterprise Server 10 SP2 skeleton file. It should be possible to use these files on most other distributions that have SysV-style init scripts. For Zabbix server, place the following in the /etc/init.d/zabbix_server file:
# This library is distributed in the hope that it will be useful, # but WITHOUT ANY WARRANTY; without even the implied warranty of # MERCHANTABILITY or FITNESS FOR A PARTICULAR PURPOSE.
# See the GNU Lesser General Public License for more details.
# You should have received a copy of the GNU Lesser General Public # License along with this library; if not, write to the
# Required-Start: $network $remote_fs $local_fs # Should-Start: mysql postgresql
# Required-Stop: $network $remote_fs $local_fs # Should-Stop: mysql postgresql
# Default-Start: 3 5 # Default-Stop: 0 1 2 6
# Short-Description: Zabbix monitoring server daemon
# Description: This is a server daemon for the monitoring system Zabbix
# For more information see http://www.zabbix.com ### END INIT INFO
ZABBIX_CONFIG="/etc/zabbix/zabbix_server.conf"
test -r $ZABBIX_CONFIG || { echo "$ZABBIX_CONFIG missing"; if [ "$1" = "stop" ]; then exit 0;
else exit 6; fi; }
ZABBIX_BIN="/usr/local/sbin/zabbix_server"
test -x $ZABBIX_BIN || { echo "$ZABBIX_BIN not installed"; if [ "$1" = "stop" ]; then exit 0;
else exit 5; fi; }
. /etc/rc.status
NAME="Zabbix server daemon"
ZABBIX_PID=/var/tmp/zabbix_server.pid
case "$1" in
start)
echo -n "Starting $NAME "
## Start daemon with startproc(8). If this fails ## the return value is set appropriately by startproc. /sbin/startproc -t 1 -p $ZABBIX_PID $ZABBIX_BIN
# Remember status and be verbose rc_status -v
;; stop)
echo -n "Shutting down $NAME "
## Stop daemon with killproc(8) and if this fails ## killproc sets the return value according to LSB.
/sbin/killproc -TERM $ZABBIX_BIN
# Remember status and be verbose rc_status -v
;;
try-restart|condrestart)
## Do a restart only if the service was active before. ## Note: try-restart is now part of LSB (as of 1.9). ## RH has a similar command named condrestart. if test "$1" = "condrestart"; then
echo "${attn} Use try-restart ${done}(LSB)${attn} rather than condrestart ${warn}(RH)${norm}"
# Remember status and be quiet rc_status
;;
restart)
## Stop the service and regardless of whether it was ## running or not, start it again.
$0 start
# Remember status and be quiet rc_status
;;
force-reload)
## Zabbix server daemon does not support configuration reloading, thus it is restarted, if running.
echo -n "Reload service $NAME "
$0 try-restart rc_status ;;
reload)
## Zabbix server daemon does not support configuration reloading, thus reload fails
rc_failed 3 rc_status -v ;;
status)
echo -n "Checking for service $NAME "
## Check status with checkproc(8), if process is running ## checkproc will return with exit status 0.
# Return value is slightly different for the status command: # 0 - service up and running
# 1 - service dead, but pid file exists
# 2 - service dead, but /var/lock/ lock file exists # 3 - service not running (unused)
# 4 - service status unknown :-(
# 5--199 reserved (5--99 LSB, 100--149 distro, 150--199 appl.)
# NOTE: checkproc returns LSB compliant status values. /sbin/checkproc -p $ZABBIX_PID $ZABBIX_BIN
# NOTE: rc_status knows that we called this init script with # "status" option and adapts its messages accordingly. rc_status -v
;; probe)
test $ZABBIX_CONFIG -nt $ZABBIX_PID && echo reload ;;
*)
echo "Usage: $0 {start|stop|status|try-restart|restart|force- reload|reload|probe}"
exit 1 ;; esac rc_exit
For the Zabbix agent daemon, create /etc/init.d/zabbix_agentd with the following contents: # License as published by the Free Software Foundation; either # version 2.1 of the License, or (at your option) any
# later version. #
# This library is distributed in the hope that it will be useful, # but WITHOUT ANY WARRANTY; without even the implied warranty of # MERCHANTABILITY or FITNESS FOR A PARTICULAR PURPOSE.
# See the GNU Lesser General Public License for more details. #
# You should have received a copy of the GNU Lesser General Public # License along with this library; if not, write to the
# Default-Stop: 0 1 2 6
# Short-Description: Zabbix monitoring agent daemon
# Description: This is a client daemon for the monitoring system Zabbix
# For more information see http://www.zabbix.com ### END INIT INFO
ZABBIX_CONFIG="/etc/zabbix/zabbix_agentd.conf"
test -r $ZABBIX_CONFIG || { echo "$ZABBIX_CONFIG missing"; if [ "$1" = "stop" ]; then exit 0;
else exit 6; fi; }
ZABBIX_BIN="/usr/local/sbin/zabbix_agentd"
test -x $ZABBIX_BIN || { echo "$ZABBIX_BIN not installed"; if [ "$1" = "stop" ]; then exit 0;
else exit 5; fi; }
. /etc/rc.status
# Reset status of this service rc_reset
NAME="Zabbix agent daemon"
ZABBIX_PID=/var/tmp/zabbix_agentd.pid
case "$1" in
start)
echo -n "Starting $NAME "
## Start daemon with startproc(8). If this fails ## the return value is set appropriately by startproc. /sbin/startproc -t 1 -p $ZABBIX_PID $ZABBIX_BIN
# Remember status and be verbose rc_status -v
;; stop)
echo -n "Shutting down $NAME "
## Stop daemon with killproc(8) and if this fails ## killproc sets the return value according to LSB.
# Remember status and be verbose rc_status -v
;;
try-restart|condrestart)
## Do a restart only if the service was active before. ## Note: try-restart is now part of LSB (as of 1.9). ## RH has a similar command named condrestart. if test "$1" = "condrestart"; then
echo "${attn} Use try-restart ${done}(LSB)${attn} rather than condrestart ${warn}(RH)${norm}"
# Remember status and be quiet rc_status
;;
restart)
## Stop the service and regardless of whether it was ## running or not, start it again.
$0 stop $0 start
# Remember status and be quiet rc_status
;;
force-reload)
## Zabbix agent daemon does not support configuration reloading, thus it is restarted,
## if running.
echo -n "Reload service $NAME "
;;
reload)
## Zabbix agent daemon does not support configuration reloading, thus reload fails
rc_failed 3 rc_status -v ;;
status)
echo -n "Checking for service $NAME "
## Check status with checkproc(8), if process is running ## checkproc will return with exit status 0.
# Return value is slightly different for the status command: # 0 - service up and running
# 1 - service dead, but pid file exists
# 2 - service dead, but /var/lock/ lock file exists # 3 - service not running (unused)
# 4 - service status unknown :-(
# 5--199 reserved (5--99 LSB, 100--149 distro, 150--199 appl.)
# NOTE: checkproc returns LSB compliant status values. /sbin/checkproc -p $ZABBIX_PID $ZABBIX_BIN
# NOTE: rc_status knows that we called this init script with # "status" option and adapts its messages accordingly. rc_status -v
;; probe)
## Optional: Probe for the necessity of a reload, print out the ## argument to this init script which is required for a reload. ## Note: probe is not (yet) part of LSB (as of 1.9)
test $ZABBIX_CONFIG -nt $ZABBIX_PID && echo reload ;;
*)
echo "Usage: $0 {start|stop|status|try-restart|restart|force- reload|reload|probe}"
To use these scripts, place them in /etc/init.d and create appropriate symlinks in /usr/sbin as root:
# ln -s /etc/init.d/zabbix_server /usr/sbin/rczabbix_server # ln -s /etc/init.d/zabbix_agentd /usr/sbin/rczabbix_agentd
Now let's try to start our newly created services. Again, as root execute:
# service zabbix_agentd start
Starting zabbix agent daemon done
# service zabbix_server start
Starting zabbix server daemon done
That should get the agent and server started, although there should be no additional output. Note: you can also use other syntax— remember those symlinks we just created? You can also use them as:
# rczabbix_agentd start # rczabbix_server start
Feel free to experiment with other parameters, like stop and restart— it should be obvious what those two do.
You can verify whether services are running with the status parameter. For a service that is not running, you would get:
# service zabbix_server status
Checking for service Zabbix server daemon unused
A running service would yield:
# service zabbix_agentd status
Checking for service Zabbix agent daemon running
There's also another parameter called probe. This will check whether the
Now that's nice, but we started all this with the goal of adding Zabbix services to system startup. Surely the previous actions didn't help with that? To reach our goal when using SysV-style init systems input the following as root:
# chkconfig -s zabbix_server 35 # chkconfig -s zabbix_agentd 35
This will add both services to be started at runlevels 3 and 5, which are used for multiuser and networked environments (though some distributions might use runlevel 4 instead of 5 for a graphical environment; consult your distribution's documentation when in doubt). There's usually no need to start Zabbix in single user or non-networked runlevels (1 and 2), as data gathering requires network connectivity.
To be fair, with the init scripts we created earlier it is even simpler than that:
# chkconfig -a zabbix_server zabbix_agentd
This will add both services as specified in the corresponding init scripts, which in our case is runlevels 3 and 5, configured by parameter Default-Start. If the command succeeds, you'll see the following output:
zabbix_server 0:off 1:off 2:off 3:on 4:off 5:on 6:off zabbix_agentd 0:off 1:off 2:off 3:on 4:off 5:on 6:off
Slackware
The Slackware Linux distribution (http://www.slackware.com/) uses a simpler startup script system. Here's an example of a script to start and stop the Zabbix server and agent daemon on Slackware systems. This script is dependant on bash, but it shouldn't be too hard to rewrite for sh compatibility, if so desired. Create script /etc/rc.d/rc.zabbix with the following content:
#!/bin/bash
# Init script to start/stop Zabbix server and agent daemon
# Check for stray pidfiles and remove them echo "No process $2 running" return
}
if [ -f $1 ]; then kill -15 $(cat $1) else
echo "pidfile $1 not found" processcheck $2 && killall -15 $2 fi
echo -n "Waiting for $2 to terminate" for i in $(seq 1 $TERMINATEWAIT); do processcheck $2 || break
sleep 1 echo -n "." done
processcheck $2 && echo "Warning! $2 did not terminate in $TERMINATEWAIT seconds"
}
zagent_start() {
if [ -x $BINLOCATION/zabbix_agentd ]; then if processcheck zabbix_agentd; then
echo "Zabbix agent daemon already running" else
echo "Starting zabbix agent daemon: $BINLOCATION/zabbix_agentd" $BINLOCATION/zabbix_agentd
fi else
echo "Executable $BINLOCATION/zabbix_agentd not present" fi
zserver_start() {
if [ -x $BINLOCATION/zabbix_server ]; then if processcheck zabbix_server; then
echo "Zabbix server already running" else
echo "Starting zabbix server: $BINLOCATION/zabbix_server" $BINLOCATION/zabbix_server
fi else
echo "Executable $BINLOCATION/zabbix_server not present" fi
}
zagent_stop() {
echo "Stopping Zabbix agent daemon" killprocess $AGENTPID zabbix_agentd }
zserver_stop() {
echo "Stopping zabbix server"
zserver_start
echo "Usage: $0 start|stop|restart [agent|server]" ;;
esac
This script combines agent and server controlling. To start both, execute the following as root:
To control the server or agent only, pass its name as a second argument. For example:
# /etc/rc.d/rc.zabbix restart server
Adding a script to the system's startup sequence is quite trivial. It's invocation has to be added to the /etc/rc.d/rc.local as follows:
# echo /etc/rc.d/rc.zabbix start >> /etc/rc.d/rc.local
Verifying the service's state
While the init script method is a nice way to check a service's state for some distributions, it's not available everywhere and isn't always enough. Sometimes you might want to check whether the Zabbix server or agent is running with other methods.
Checking running processes:
The most common method to check whether a particular process is running is by looking at running processes. You can verify if Zabbix agent daemon processes are actually running by using the following:
$ ps -C zabbix_agentd
netstat output:
Sometimes, an agent daemon might start up, but fail to bind to the port, or the port might be used by some other process. You can verify whether some other process is listening on the Zabbix port, or whether Zabbix agent daemon is listening on the correct port by issuing:
$ netstat -ntpl
Note that process names won't be printed for other users' processes unless you are root. In the output, look for a line looking similar to:
Proto Recv-Q Send-Q Local Address Foreign Address State PID/Program name
tcp 0 0 0.0.0.0:10050 0.0.0.0:* LISTEN 19843/zabbix_agentd
This indicates that the process zabbix_agentd is running and listening on all addresses, on port 10050, just what we need.
•
Telnetting to the port
Even when a service starts up and successfully binds to a port, there might be some connectivity issues; perhaps due to a local firewall. To quickly check connectivity to the desired port, you can try:
$ telnet localhost 10050
This command should open a connection to the Zabbix agent daemon, and the daemon should not close the connection immediately.
The Web frontend
Now that we have the Zabbix server and agent compiled, installed, and running, there's probably a feeling that something's missing. We have only configured some low-level behavior, so where's the meat?
That's what the frontend is for. While in theory Zabbix can have multiple frontends, the only one with full functionality so far is web frontend, which was written in PHP. We have to set it up to configure Zabbix and get to those nice graphs everybody likes.
Prerequisites and setting up the environment
Of course, being a web frontend, it will require a platform to run on; a web server with a PHP environment. We will need the following installed:
A web server that is supported by PHP; Apache is the most common choice PHP version 5
It is easiest to install these from distribution packages. For PHP we'll also need the following functionality:
GD MySQL BCmath mbstring
Some distributions split out core PHP modules. These might include
php5-ctype and php-net-socket.
Once you have all these installed, it's time to set up the frontend. First, you have to decide where the frontend code has to go. Most distributions that package web servers use /srv/www/htdocs or /var/www. If you compiled the Apache web server from source, it would be /usr/local/apache2/htdocs (unless you manually changed the
prefix or installed an older Apache version). We will place the frontend in a simple subdirectory, zabbix.
Assuming you have distribution packages installed with the web root directory at /srv/www/htdocs, placing the frontend where it is needed is as simple as executing it as root:
# cp -r frontends/php /srv/www/htdocs
# mv /srv/www/htdocs/php /srv/www/htdocs/zabbix
Now it's time to fire up a browser and navigate to Zabbix's address:
http://<server_ip_or_name>/zabbix. It should work just fine in the latest versions of most browsers, including Firefox, Opera, Konqueror, and Internet Explorer.
Installation of the web frontend
The web frontend has a wizard that helps you to configure its basics. Let's go through the simple steps it offers.
Step 1 – Welcome
If you are not, there are several things that could have gone wrong.
If you see a blank page or some PHP code, make sure that PHP is properly installed and configured to parse files ending with the extension php through the AddType application/x-httpd-php directive. If you see a file and directory listing instead of the installation wizard, make sure you have added index.php to DirectoryIndex directive. If these hints do not help, check the PHP documentation available at http://www.php.net/manual/en/.
This screen doesn't offer us much to configure, so just click Next > >.
Step 2 – Licence
On the second screen you are presented with the license, GPLv2. Hopefully you have no objections to this license, so check the I agree box and click Next > > again.
Step 3 – PHP prerequisites
If so, the Next > > button will be enabled, and you just have to click on it to continue to step 4.
Though, more often than not, one or more entries will have a red Fail warning listed next to them. This is where things get more interesting. Problems at this point fall into two categories—PHP installation, and configuration.
Entries like PHP version, PHP Databases support, PHP BC math PHP MB string, GD Version, and Image formats are PHP installation problems. To solve these, either install the appropriate distribution packages (sometimes called php5-bcmath, php5-gd, php5-mysql, and so on), or recompile PHP with the corresponding options. PHP Memory limit, PHP post max size, PHP max execution time, PHP Timezone , and PHP MB string overload are configuration issues that are all set in the php.ini configuration file. This file is usually located at /etc/php5 or similar for distribution packages, and /usr/local/lib for PHP source installations. Set the following options:
For timezone, set the date.timezone option to a timezone that best matches your environment. For Zabbix home it's Europe/Riga, and you can see valid options at http://www.php.net/manual/en/timezones.php
Since Zabbix version 1.8.2 mbstring.func_overload is not required anymore.
If you can't find php.ini, or you make changes but installation wizard does not pick them up, create a file named test.php in htdocs directory with only this content:
<?php phpinfo() ?>
Navigate using your browser to this file and check the value for entry Configuration
File (php.ini) Path—that's where you should look for php.ini.
Once everything is fixed, click Retry button, and you should see more green entries.
Now the Next > > button should be enabled, click on it to continue.
Remember the database we created before? That's the information we'll insert here. Default database Type, Host, and Port should work for us. Set both Name and User to zabbix. If you have forgotten the password, just look it up or copy it from /etc/zabbix/zabbix_server.conf. After entering the data, click the Test connection button. If all the information is correct, the status should be Ok, so click Next > > again.
Step 5 – Zabbix server details
Step 6 – Summary
If you left the defaults where appropriate and your database connection test was successful, it should be safe to continue by clicking Next > >.
It is quite likely that in the next screen you will be greeted with failure. The installation wizard attempted to save the configuration file, but with the access rights that it has, that should not be possible. There are two possible solutions:
Click Save configuration file and place this file in the htdocs/zabbix/conf directory.
Make a directory htdocs/zabbix/conf writable by web server user (execute as root):
# chown <username> /path/to/htdocs/zabbix/conf # chmod 700 /path/to/htdocs/zabbix/conf
Obviously, we need to insert the correct username and directory in the above commands. Remember, common locations were /srv/www/htdocs and /usr/local/apache2/htdocs, use the one you copied the Zabbix frontend code to. Common users are wwwrun, www-data, nobody, and daemon— you can find out what the correct user for your system is by running:
$ ps aux | grep http
The username that most httpd processes are running under will be the correct one. Once the permissions have been changed, click Retry. That should successfully save the configuration file.
You can also skip configuration wizard by copying zabbix.conf.php.example in the conf directory to zabbix.conf.php and editing it directly.
It is suggested that you restrict the permissions on this file afterwards to be readable only by web server user, by issuing as root:
# chmod 400 /path/to/htdocs/zabbix/conf/zabbix.conf.php
# chown <username> /path/to/htdocs/zabbix/conf/zabbix.conf.php
The file contains the database password which is better kept secret.
It is possible to personalize Zabbix frontend installation a bit. Adding in the zabbix.conf.php configuration file after the line that starts with $ZBX_SERVER_PORT another line $ZBX_SERVER_NAME = "Test server"; will make all pages in Zabbix setup use this name in page titles and display it in the upper-right corner of the frontend, so it would be easier to distinguish this installation from the production instance created later.
•
Step 8 – Configuration file in place
After successfully performing this step and clicking Retry, the installation wizard should be happy, so do as it says and click Next.
Step 9 – Finishing the wizard
Step 10 – Logging in
Immediately after clicking Finish you should see a login form.
The Zabbix database data that we inserted previously also supplied the default username and password, so enter admin as the Login name, and zabbix as the Password.
That should get you to the initial frontend screen, which doesn't show much; it only greets you.
Congratulations! The web frontend is now set up and we have logged in.
This view isn't too exciting, so let's check whether the frontend can see if the Zabbix server is running. Hover your mouse over Reports and click Status of Zabbix, the very first report.
Hover your mouse over Configuration and choose Hosts.
So there it is. It turns out that the default Zabbix database already has one server configured; the local Zabbix server. It is disabled by default, as indicated in the Status of Zabbix screen and here by Not monitored string in Status column.
Summary
In this chapter we set up a fresh Zabbix installation consisting of a database, a server, and an agent daemon; all running on the same machine. We also installed and configured the Zabbix web frontend, based on PHP, to access the database.
Getting Your First Notification
We have now installed Zabbix, but it's not doing much—at least that's what we'd expect. Software that starts doing something on its own probably would be a bit undesirable, at least for now. The promise of Zabbix was to inform you about problems as soon as possible, preferably before your users and management notice them. But how do we get data, where do we place it, and how do we define what a problem is? We will try to quickly get Zabbix working and alerting on a single monitored item, which is the most common scenario. Before we can tell Zabbix who to send notifications to, we will have to explore and use some basic Zabbix concepts. They are:
Navigating around the frontend
Creating a host and item (Zabbix term for a monitored metric) for it Looking at the gathered data and finding out how to get it graphed Defining problem threshold with a trigger
Telling Zabbix that it should send e-mail when this threshold is exceeded Causing a problem to actually receive a notification
Exploring the frontend
While we have already looked at some data provided by the frontend, we should get a bit more familiar with it before attempting some more configuration tasks.
Configuration steps will be followed by verifying results in Monitoring section. We will then explain some generic item terms used in Zabbix, and their use. Items, being the basis of information gathering, have a fair amount of configuration possibilities.
Move your mouse cursor over the entries of the top menu bar and observe how the lower menu bar opens to show sub-entries of the chosen category. Hovering mouse cursor over your chosen option, then clicking to select it will give you access to your chosen piece of Zabbix's frontend. You will be using the menus a lot, so in the future we'll refer to the action we just performed as something similar to Monitoring | Dashboard. (Whenever you see such a notation, first is the main category, second is entry under it.)
As you can see in the following screenshot, there are five main categories:
Monitoring: This category contains most of the monitoring-related pages. You will be able to view data, problems, and graphs here.
Inventory: Here inventory data for monitored systems can be viewed, if properly filled.
Reports: Whenever you'll need some nice report, visualizing more than few items, this will be the category to look at most likely.
Configuration: Setting up everything related to monitoring of systems, parameters, notification sending, and so on happens here.
Administration: This section allows to set up more of the Zabbix internals, including authentication methods, users, permissions, and global
Zabbix configuration.
Before we venture deeper into these categories, it might be worth visiting the Profile section—see the link in the upper-right corner.
• •
•
•
Here you can set some options concerning your user account for example, changing the password, the frontend language, or the frontend theme. As we will use an English frontend, it is suggested to leave the defaults for these three as it is. Notice that you can find out user account that you currently are connected as in the lower-right corner of the frontend. When you are not logged in, guest is displayed in that area.
There are two options related to logging in. Auto-login, which will automatically log the user in, using a cookie saved by their browser, and Auto-logout. It is suggested that you disable the latter for our test installation, as shown above. This way, you won't be logged out if your workflow is interrupted for a few minutes.
We won't change the URL option at present, but we'll discuss the benefits of setting a custom default URL for a particular user later. The Refresh sets the period in seconds that some pages in the frontend will refresh automatically to show new data. It might be beneficial to increase this parameter for huge screens that we do not have yet.
After you have disabled Auto-logout, click Save.
Take a quick look at below the menu—there's an option called History, commonly called breadcrumbs in computer software.
Here you can see last five pages that you have visited in the Zabbix frontend. Each of them can be clicked to quickly return to that page. After you click on another category, the page you just left is added to the right-hand side of the history.
Monitoring quickstart
Now that we have basic understanding of the frontend navigation, it's time to look at the basis for data gathering in Zabbix—items. In general, anything you want to gather data about will eventually go into an item.
An item in Zabbix is a configuration entity that holds information on gathered metrics. It is the very basis of information flowing