Proceeding
ISSN 0215-2487
FEB
Eddy Junarsin, Ph.D. Universitas Gadjah Mada
Prof. Wihana Kirana Jaya, Ph.D. B. Raksaka Mahi, Ph.D. Prof. Djoko Susanto, Ph.D. Prof. Sukmawati Sukamulja, Ph.D.
Sekar Mayang Sari, Ph.D. Deden Dinar Iskandar, Ph.D. Prof. John Malcolm Dowling, Ph.D. Prof. Mohamat Sabri Hassan, Ph.D.
Prof. Stein Kristiansen, Ph.D. Prof. Pacha Malyadri, Ph.D. Prof. Jae Il Kim, Ph.D. Daniel Suryadarma, Ph.D. Arianto
Sekolah Tinggi Ilmu Ekonomi YKPN Universitas Atma Jaya Yogyakarta Universitas Trisakti
Universitas Diponegoro
University of Hawaii at Manoa, U.S.
Universiti Kebangsaaan Malaysia, Malaysia University of Maryland Eastern Shore, U.S.
ROLE OF INFLATION AND IOS AS MODERATING
VARIABLES ONSTRENGTHENINGCORPORATE VALUES
THROUGH COMPANY PERFORMANCE
Sriyono Sriyono
Program Study of Magister Management Muhammadiyah University(UMSIDA)
,
ABSTRACT
The growth rategood company willbe able to increasethe value ofthe company. Meanwhile,to obtaina goodrate ofgrowth, company managersmust beable to maintainthe company's positioninanyeconomiccondition
This studyaims to determine how role of inflation and IOS as a moderating variables on Strengthening corporate values through company performance, whetherthe role of inflation and IOS as a moderating variables has significant effect to strengthening corporatevalue. It is very importantto know becausethe inflation and IOS has effect to Corporate Value
Dataofresearchcollectedsince
2008to2013,hypothesistestingisusingModerating Regression Analysis, and wewillknow that role of inflation and IOS. Managers will be easiertomanagewhat steps should bedecided to Strengthening corporate values
The result of this study showed that the inflation and IOS has significant rule and positive as moderating variable to influence corporate value through company performance.
CHAPTER I INTRODUCTION
Background
Maximization of existing corporate values can be achieved when the company pays attention to the interests of the stakeholders. The balance of the achievement of the objectives of the company stakeholders can make a company a chance to get the optimum benefit and ultimately judged by investors. The good performance of the company will positively responded by investors. This positive response will be on show with the growing demand for the company's shares. When a stock is on the rise, the demand for investors who already own shares does not want to sell (because of the good performance of the company), then the share price will rise.
Rising stock prices will increase the company's value, since value companies one of which is measured by multiplying the number of outstanding shares with a market price of shares (Hastuti, 2005). The value of the company is the price payable by prospective buyers if the company is sold. The value of the company is a reflection of the addition of the company's equity with debt of the company. There are several factors that affect the value of the company, namely: funding decisions, dividend policy, investment decisions, capital structure, the company's growth, the size of the company. Some of these factors have an impact on relationships and the value of the company is not consistent. . In addition to the fundamental factors that affect the share prices of the factors of political and macroeconomic conditions also affect the stock price (Purnomo, 1998)
According to Jhojor (2009) not Leverage effect on the value of the company, but simultaneously positive and significant effect against the value of the company, research is also supported by the research of Alfredo (2011). Meanwhile the high liquidity Level would indicate that the company is in a good condition so that will add to the demand for stocks and certainly will raise the price of a stock (Harjito and Martono, 2001).
According to Carningsih (2009) States the potential negative effect of ROA company property and real estate listed on the Indonesia stock exchange, meanwhile, according to Ang/(1997) that ROA positive effect significantly to returm shares. Therefore the ROA was one of the influential fator against corporate values (Bringham, 2006)
If a country's economy growing continuously with a pretty good macro variables such as inflation rates, foreign exchange rates, SBI interest rate, unemployment rate, as well as the political situation under control, then the investors interested in cultivating a capital in the stock exchange, and vice versa (Sriyono,2015 ). The condition of the economy, the political situation, as well as other technical factor is determinant variables outside of the company's financial performance that could spur stock price movement direction. This gives an indication that not only the fundamental conditions that affect a company's stock price variations (Purnomo, 1998).
The company's growth will create a large selection of investment (investment option) the company can do in the future. Investment choice is then known as the Investment Opportunity Set (IOS). This ratio is used by Smith and Watts (1992) in his research connecting levels IOS with policy dividends and corporate funding and the results of testing conducted States that the ratio of IOS have significant correlation against funding and policy dividends. Research conducted by Hartono (1999) also showed that this ratio has a significant correlation against a policy dividend. Research conducted by Norpratiwi (2004), which States the existence of a significant correlation between IOS with return company stock.
In this study wanted to prove how the role variable inflation and increased value against IOS invesment company via the company's performance. What is inflation and investment IOS is able to be the moderating variable to this conditions
CHAPTER II THEORETICAL TRACK
2.1 Basic theory
achieve the value of the company is generally the financier surrendered the management to the professional. The professional is positioned as the Manager or the Board of Commissioners. It can be concluded that the value of the stock ownership can constitute an appropriate index to gauge the effectiveness of the company. Based on the pedestal, then that's an objective of financial management is expressed in the form of corporate ownership of the stock value maximization of existing, or maximize the stock price.
Alfredo (2011) no significant positive effect of the liquidity of the company. This indicates that liquidity is not too taken into consideration by the external company in conducting an assessment of a company and does not have significant influence towards change in the stock price of a company. Leverage the potential negative effect is not significantly to the value of the company. Big nothingness of debt owned by the company is not too noticed by investors, because more investors see how the management of the company to use the funds effectively and efficiently to achieve added value to the value of the company.
Black and Scholes (1974) States that the value of a firm is only determined by the ability to generate profit and its business risk. Main and Santosa (1998) to find evidence that four of the fundamental factors (profitability, level of risk, growth prospects, and dividend policy) just profitability (ROE) which has a positive influence and significantly to the value of the company.
Based on the results of such research could be explained that the assessment of the achievements of a company can be seen from the company's ability to generate earnings. Research results Susilo (2009) supported by Lestroyini (2008), Fitriyanti (2009) shows that the value of the company to profitability.
Research on the influence of the liquidity of the company has been investigated by Nurhayati (2013) in the study interpreted value of the coefficient of liquidity is negative, meaning the higher the liquidity of the lower value of the company which is reflected through the stock price. . Interpretation of mentioning this occurs due to the economic conditions and the subjective perception of investors
debt then its free cash flow is excessive by management can be prevented, thereby avoiding wasted investment, which will be able to increase the value of the company
2.2 Framework for Thinking
This research analyzed using Structural Equation Modeling (SEM) to find out the truth concept of theories about the factors that affect the degree of public health at East Java and Moderated Structural Equation Modeling (MSEM) i.e. an approach that allows the relationship between an independent variable toward dependent variable influenced other latent variables (Ghozali and Fuad, 2005).
1. Simple Regression Analysis.
a. Y = α + β1X1 + e ………...……….. (1)
b. Y = α + β1X2 + e……..…………..……...……….. (2) c.
Y = α + β1X3 + e ……..…...……… (3)
2. Analysis Moderated Regression Analysis (MRA)
a. Model Equations Moderated Regression Analysis (MRA) with IOS investment decisions as a moderating variable relationship between profitability, liquidity, leverage against the value of the company.
Y = α + β1X1 + β2X2 + β3X3 + β4Z1 + β5 (X 1 * Z1) β6 + (Z1 * X 2) + β7 (X 3 * Z1) + e ... (4)
b. Model Equation Regression Analysis Moderated (MRA) with inflation as a moderating variable relationship between profitability, liquidity, leverage against the value of the company.
Y = α + β1X1 + β2X2 + β3X3 + β4Z2 + β5 (X 1 * Z2) + β6 (X 2 * Z2) + β7 (X 3 * Z2) + e ... (5)
c. Simultaneous equations Model on M Moderated Regression Analysis (MRA) with inflation and moderating variables as IOS the relationship between profitability, liquidity, leverage against the value of the company.
Y = α + β1X1 + β2X2 + β3X3 + β4Z1Z2 + β5 (X 1 * Z1 * Z2) + β6 (X 2 * Z1 * Z2) + β7 (X 3 * Z1* Z2) + e
e = Error Term, i.e. the level of errors in research
Test the interaction of this type are often referred to as Moderated Regression Analysis (MRA) is a special application of linear multiple regression where in the equation regressions contain elements of interaction (multiplication of two or more independent variables) (Ghozali 2006).
Jogiyanto (2010) States testing against the effects of the moderation can be done in two ways, namely by looking at the effect of Moderation caused by looking at indicators increase in R through the regression equation containing variables shared variable main moderation and effect of moderation from the regression equation contains only the main effects with it.
Arsintadiani and Harsono (2002) stated that the results of his research in the interacts variable and independent variable the dependent variable by including Moderating. To see the results of the main effects and the effects of moderation that is if at any regression analysis has increased the value of R square of main effects
2.3 Hypothesis
Based on the Foundation of theory and equations models are used then the hypothesis proposed is:
1.H1 = Profitability effect significantly to the value of the company. 2.H2 = Liquidity effect significantly to the value ofthe company. 3.H3 = Leverage effect significantly to the value of the company.
4.H4 = Inflation being able to moderate the influence of profitability, liquidity and leverage against the value of the company.
5.H5 = IOS investment decisions capable of moderating influence profitability, liquidity and leverage against corporate values
CHAPTER III
RESEARCH METHODOLOGY
3.1 Design of the Study
through a deductive approach. Moreover, this study also wants to analyze and examine the relationship between exogenous variables with endogenous variables in the regression model of moderating
3.2 Research Data
The data will be used in this study is a secondary data collected from several agencies, institutions, such as Indonesia stock exchange (idx), Bank Indonesia. The data used are of annual data, from the period of 2009 to the 2013.
3.3 Population and Sample
The population in this research is the company manufacture which belongs to the LQ 45 listed in Indonesia stock exchange (idx). During the four-year period, namely 2009-2013 was recorded in Indonesia stock exchange (idx) as well as the report on the financial statements and published in full at: http://ww.idx.co.id, the sample in this study using a Purposive Sample i.e. samples taken have certain criteria.
3.4 Variables and measurements
a.Performance 1.Profitability
Profitability shows the extent to which a company manages its own capital effectively, measuring the level of profit from the investment that has been made by the owner of the own capital or shareholders (Sawir, 2005) Profitability in this research is represented by the return on equity. Return on equity, using the following formula:
Return on Equity = net profit after tax/private equity 2.Liquidity
(Arwana,2001:332). Mathematically, the cash ratio can be calculated using the following formula:
CashRatio Cash Effec
Current Liabiliti
3.Leverage
Leverage is a measure of the company's ability to meet financial obligations consisting of short-term debt and long-term debt. Leverage in this study represented by debt to equity ratio. Debt to equity ratio is a ratio is a comparison between the total debts with private equity
Debt Equity Ratio = Total Debt/Total Capitalization Of Own
3. Corporate Value
The value of the company is a term which describes the degree to which the company appreciated the public. In this study using Tobin's Q Tobin's Q member, because the picture not only on fundamental aspect but also the extent to which the market is valuing the company from various aspects of the visits by outside parties including investors (Hastuti, 2005).
Measuring instrument which is used for the value of the company used in this research was the Tobins Q, Tobins Q is the ratio between the market value of equity plus debt with the book market value plus debt (Susanti,2010).
Tobins Q ={(CP xThe Number of Shares) +TL+I)}– CA TA
Where:
Tobins Q = the value of the company CP = Closing Price
TL = Total Liabilities CA = Current Assets TA = Total Asset I = Inventory
The ratio of the market to book value of equity is a proxy based on price. Proxy described the capital of a company. The intent of this proxy because elections can reflect the magnitude of return of assets existing and expected future investments will be exceeds the return from equities is desired. This ratio can be obtained by multiplying the number of shares outstanding by the stock's closing price to the total equity (Nurcahyo and Putriani,2009:9).
d. Inflation
According to Samuelson (2004), inflation is a macroeconomic indicators that illustrate the increase in the price of goods and services in a given period. Then the same opinion expressed by Case (2004), which States that: "Inflation is an increase in the overall price level" that means that inflation is rising at all price levels. a country's currency on an ongoing basis. The data used in this research was obtained from BI in the form of secondary data for inflation.
3.4 Test hypotheses and Data Analysis Techniques
3.4.1 Classic Assumption Test
A classic Assumption test Testing assumptions, this classic aims to know and test the feasibility of regression models used in this study. This test is also intended to ensure that in the regression model used there is no multikoloniertas and heteroskedasititas as well as to ensure that the resulting data is Gaussian. A classic assumption test consists of a test of Normality, test Multikolonieritas test Heteroskedatisitas test Autokolerasi (Ghozali, 2006).
3.4.2 Hypothesis Test
a Simple Regression Analysis.
Y = α + β1X1 + e ………...……….. (1)
Y = α + β1X3 + e ……..…...……… (3)
b. Analysis Moderated Regression Analysis (MRA)
Y = α + β1X1 + β2X2 + β3X3 + β4Z1 + β5 (X 1 * Z1) β6 + (Z1 * X 2) + β7 (X 3 * Z1) + e ... (4)
Y = α + β1X1 + β2X2 + β3X3 + β4Z2 + β5 (X 1 * Z2) + β6 (X 2 * Z2) + β7 (X 3 * Z2) + e ... (5)
Y = α + β1X1 + β2X2 + β3X3 + β4Z1Z2 + β5 (X 1 * Z1 * Z2) + β6 (X 2 * Z1 * Z2) + β7 (X 3 * Z1*Z2)+e……….6)
Description:
Y = The Value Of The Company X 1 = Profitability
X 2 = Liquidity X 3 = Leverage Z1 = investment IOS Z2 = Inflation
α = Constant
β1-7 = Regression Coefficient
e = Error Term, i.e. the level of errors in research
3.4.3 Data analysis techniques
Technique of data analysis using SPSS Software Version 16, ranging from classic assumption test to test the hypothesis
CHAPTER IV
RESULTS AND DISCUSSION
1 The classic test results
a. Normality
Table 4.1
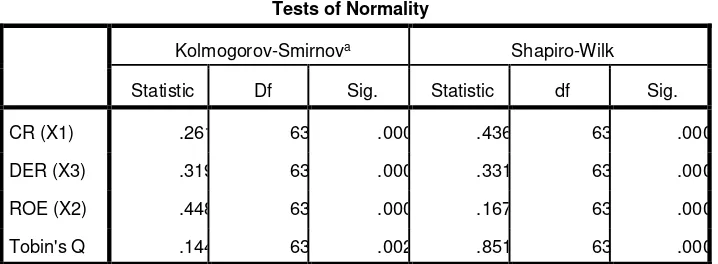
Tests of Normality
Kolmogorov-Smirnova Shapiro-Wilk
Statistic Df Sig. Statistic df Sig.
CR (X1) .261 63 .000 .436 63 .000
DER (X3) .319 63 .000 .331 63 .000
ROE (X2) .448 63 .000 .167 63 .000
Tobin's Q .144 63 .002 .851 63 .000
The results of the analysis in Table 4.1 indicates that data is used indicate its distribution is not normal because the value of Sig,< 0.05, because the data used under 100, This causes the data not distributed normaly
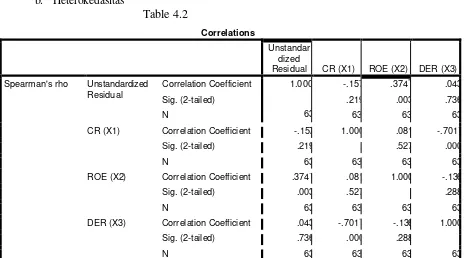
b. Heterokedasitas
Spearman's rho Unstandardized Correlation Coefficient Residual Sig. (2-tailed)
CR (X1) Correlation Coefficient -.157 1.000 .081 -.701*
Sig. (2-tailed) .219 . .527 .000
N 63 63 63 63
ROE (X2) Correlation Coefficient .374* .081 1.000 -.136
Sig. (2-tailed) .003 .527 . .288
N 63 63 63 63
DER (X3) Correlation Coefficient .043 -.701* -.136 1.000
Sig. (2-tailed) .736 .000 .288 .
N 63 63 63 63
**. Correlation is significant at the 0.01 level (2-tailed)
Model R R Square
a. Predictors: (Constant), DER (X3), ROE (X2), CR (X1)
b. Dependent Variable: Tobin's Q
Analysis of the results obtained in Table 4.3 values Durbin Watson 1622, according to Table Durbin Watson Standard that for n = 63 and k = 3 and value dl = 1346 and du = 1,534. because the value is larger than the Standard Table Durbin=Watson, so the research data used in areas not yet definitely
d. Multicolinerity
a. Dependent Variable: Tobin's Q
The results of the analysis in Table 4.4 shows that VIF less than 5 then the conceptual research of the multicollinearity does not occur
2. The results of the single-stage Regression
a.results of the R Square
Table 4.5
Model Summary
Model R R Square Adjusted R Square Std. Error of the Estimate
1 .246a .060 .013 48.22987
a. Predictors: (Constant), DER (X3), ROE (X2), CR (X1)
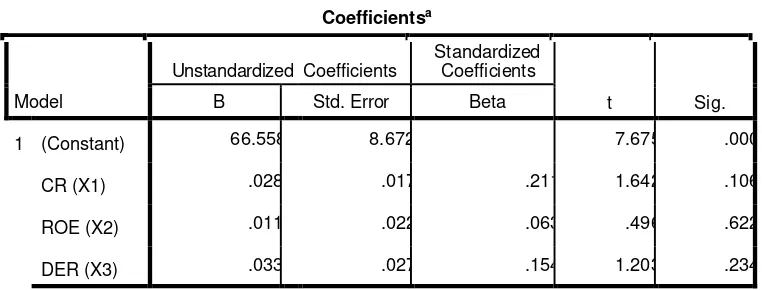
Table 4.6
Based on the results of the analysis in table 4.6 shows that Current Ratio (CR), Return on Equity (ROE) and the Debt Ratio (DER) Equity effect insignificant against the value of the company (Tobin's Q) with a value greater than 0.05 significance i.e. CR (p = 0.106), ROE (p = 0.622) and DER (p = 0.234)
Profitability is the company's ability to earn profits through all of its capabilities and resources such as cash selling activities, capital (Agustina, 2006) so that the capability is expected to increase the company's value. However, based on the results of the analysis in table 4.2 shows that the relationship between the company's performance against the corporate value of the effect was not significant, this result is supported by research conducted Rahayu (2010) stating that the ROE effect is not significantly to the value of the company. While the research Yuniasih & Wirakusuma (2009); Rahayu (2010) found that financial performance (ROA) effect significantly to the value of the company. HA l indicates that the value of the company's much influenced by asset owned by the company, with a high asset so the company can do the development and investment, which in turn could increase the value of the company.
In addition the results obtained in this study suggest that leverage (DER) is influence not significantly to the value of the company, it is large and small showed that the debt did not influence the company's value made it at guess that the company loans do have different purposes, could be for the development of short-term investments, as well as long. This research is different from research conducted by Mule (2015) which says that the leverage effect is significant and negative.
important coordination tool and supports the implementation of the stability financial ratios and the implementation of the financial regulation so that its role in the increase in value of the company so less
3. The results of the regression phase 2 with Moderating Inflation
a.Results of the R square
Table 4.7
Model Summary
Model R R Square Adjusted R Square Std. Error of the Estimate
1 .252a .064 .016 48.15220
a. Predictors: (Constant), X3IFL, X1IFL, X2IFL
b. Significance of Result
a. Dependent Variable: Tobin's
Based on the results of the analysis in table 4.5 and table 4.7 indicates that the R square shows no insignificant increase from 0.060 be 0064, this shows that the variable inflation not being able to moderate the main variable, this is emphasized by the value significance of the main variable is greater than 0.05 i.e. CR (p = 0.092), ROE (p = 0.919) and DER (p = 0.249 As unknown, that investor's decision was strongly influenced by the value of the return is received. Return to the main indicators being the ability of the corporate finance creating value for investors in the form of payment
4. The results of the regression phase 3 Moderating with Moderating IOS
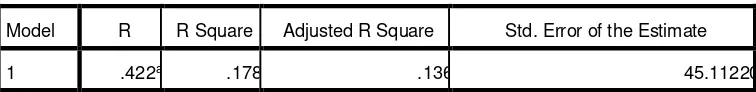
Tabel 4.9
Model Summary
Model R R Square Adjusted R Square Std. Error of the Estimate
1 .422a .178 .136 45.11220
a. Predictors: (Constant), X3IOS, X1IOS, X2IOS
b. Significance of Result
Based on the results of the analysis in table 4.10 shows that the IOS investment capable of being moderate relationship between performance with company values in particular for variable ROE and CR, while for variable DER showed no significant results. The simultaneous use of IOS Investment as the variable value moderation R square of 0178 this value proves that IOS has the effect of moderation
Tabel 4.10
Coefficientsa
Model
Unstandardized Coefficients Standardized Coefficients
T Sig.
B Std. Error Beta
1 (Constant) 69.045 6.315 10.934 .000
X1IOS .000 .000 .364 2.974 .004
X2IOS -2.760E-5 .000 -.502 -2.121 .038
X3IOS .000 .000 .459 1.956 .055
a. Dependent Variable: Tobin's Q
4. The results of the Simultaneous Regression Moderating stage 4 with
Moderating inflation and IOS
a. Predictors: (Constant), X3IFLIOS, XIIFLIOS, X2IFLIOS
b.Significance of Result
Table 4.12
Model
Unstandardized Coefficients
Standardized Coefficients
t Sig.
B Std. Error Beta
1 (Constant) 70.256 6.166 11.394 .000
XIIFLIOS 1.823E-5 .000 .339 2.777 .007
X2IFLIOS -6.861E-6 .000 -1.046 -2.484 .016
X3IFLIOS 3.629E-5 .000 .990 2.361 .022
a. Dependent Variable: Tobin's Q
Simultaneous analysis of results between the main variable, moderation of inflation and IOS is shown in Table 11 and 12 shows the change in the value of R square quite significant when compared with the initial conditions i.e. from 0.060 became 0181, this shows that the simultaneous IOS and inflation simultaneously able to do moderation towards the main variable with a value significantly i.e. CR (p = 0.07) , ROE (p = 0.016) and DER (0.022)
The results of this research provide an implication to that company managers to reinforce the strong values of a company there is a macro economic conditions and mikroenomi could be the moderation simultaneously. Microeconomic conditions can also provide a significant contribution to moderation has not been large (R square = 0178) but with a good macroeconomic conditions then it could give the value even though is not great. This also shows that between microeconomic and macroeconomic variables has a synergy in enhancing the value of the company.
HAPTER V CONCLUSION
1. Based on the results of the regression analysis on the primary variable prior to moderating shows that the results of the test on hypotheses 1, 2, 3 to the variable CR, ROA, DEBT ratio effect not significant
2, Based on the results of the Regression analysis of Moderating then it can be concluded that to do strengthening against the value of the company is not enough to just pay attention to microeconomic variables only i.e. extreme low liquidity, profitability, Market to book value but also macroeconomic conditions, since macroeconomic and microeconomic conditions simultaneously capable of moderating variables worked to strengthen the value of the company. This also means that all the economic variables of macroeconomic or microeconomic both simultaneously contribute to the strengthening of the value of the company
CHAPTER VI ADVICE
LITERATURE
Agustina, Dewi. (2006). Pengaruh Profitabilitas, Leverage, Kepemilikan Publik Dan Status Terhadap Pengungkapan Laporan Keuangan. Jurnal Bisnis dan Akuntansi, 8 (3), 219-246
Alfredo, mahendra.2011. PengaruhKinerjaKeuanganTerhadapNIlai Perusahaan (KebijakanDevidenSebagaiVariabel Moderating) Pada Perusahaan Manufaktur Di Bursa Efek Jakarta.Thesis.UniversitasUdayana Denpasar.
Ang ( 1997), Buku Pintar Pasar Modal Indonesia, Mediasoft, Jakarta
Arsintadiani, D. dan M. Harsono. 2002. Pengaruh tingkat LMX terhadap Penilaian Kinerja dan Kepuasan Kerja dengan Kesamaan Gender dan Locus of Control sebagai Variabel Moderator. Jurnal Perspektif7(2): 113-122.
Black, F, dan M. Scholes, 1974, The Effect of Dividend Yield and Dividend Policy on Common Stock Pri ces and Returns, Journal of Financial Economics , Vol. 1: 1- 22.
Brigham and Houston. 2006. Dasar-dasar Manajemen Keuangan. Edisi Kesepuluh. Jakarta: Salemba Empat
Carningsih, 2009. Pengaruh Good Corporate Governance Terhadap Hubungan Antar Kinerja Keuangan Dengan Nilai Perusahaan, Fakultas Ekonomi Universitas Guna Dharma
Case, Karl E. dan Ray C. Fair, 2004. Prinsip-Prinsip Ekonomi Makro. Edisi
Fitriyanti, Hayu. 2009.Analisis Pengaruh Roa, Roe, Dan Der Terhadap Harga Saham PadaPerusahaanMakananDanMinumanYangDiBei.UniversitasMuhammadiyahSur akarta,FakultasEkonomiManajemen.(online), (http://etd.eprints.ums.ac.id/3020/) Ghozali dan Fuad. (2005). Struktural Equation Modeling; Teori, Kosep, dan Aplikasi dengan
program Lisrel 8.54. Semarang : BP UNDIP.
Ghozali,Imam.2006.Analisis Multivariat denganProgramSPSS.Edisike4.BadanPenerbitUniversitasDiponegoro :Semarang. Harjito, A danMartono. 2005. ManajemenKeuangan. Yogyakarta.
Hastuti, Theresia Dwi (2005), Hubungan antara Good Corporate Governance dengan Kinerja Keuangan (Studi Kasus Pada Perusahaan yang Listing Di BEJ), Simposium Nasional Akuntansi VIII, Solo, 15-16 Nopember 2005 , hal 241
Hartono, Jogiyanto. 1999. ”Agency Cost Explanation for Deviden Payment”,Working Paper, UGM
Jensen, M. C and Meckling, W.H. 1976. Theory of the Firm : Managerial Behavior, Agency Costs and Ownership Structure . Journal of Financial Economics,Oktober, 1976, V. 3, No. 4, pp. 305-360.
Jensen, Michael C, 1986,. Agency Cost of Free cash Flow, Corporate Finance, and Takeovers,
American Economic Review 76 (2), 323-329 Lestyorini.Ina.2008.PengaruhVariabel-
variabelKeuanganTerhadapHargaPasarSahamSetelahInitialPublicOffering(ipo)Di BursaEfekIndonesiaPeriodesasi2000-
2005UniversitasMuhammadiyahSurakarta,FakultasEkonomiAkuntansi.. Miller, M.H., and F.Modigliani. (1961). Dividend policy, growth,and the valuation of
shares. Journal of Business. 34: 411-433
Mule, robert kisavi, 2015, financial leverage and performance of listed firms in a Frontier Market:Panel Evidence from Kenya, European Scientific Journal, March 2015 edition vol.11, No.7 ISSN: 1857 – 7881 (Print) e - ISSN 1857- 7431
Nurcahyo, Bagus dan A.D Putriani Anugrah. “Analysis Of The Effect of Investment Opportunity
2009.
Norpratiwi, M.V. Agustina. 2004. “Analisis Korelasi Investment Opportunity Set terhadap
Return Saham”, Thesis Pascasarjana UGM
Nurhayati, Mafizatun,2013, Profitabilitas, liquiditas dan ukuran perusahaan pengaruhnya terhadap Kebijakan Dividend an Nilai Perusahaan Sektor Non Jasa,Jurnal Keuangan dan Bisnis, Vol 5, No 2, Juli
Purnomo, Yogo. 1998. .Keterkaitan Kinerja Keuangan dan Harga Saham.Usahawan.
No. 12. BPFE UI. Jakarta
Rahayu, Sri. (2010). Pengaruh Kinerja Keuangan Terhadap Nilai Perusahaan Dengan Pengungkapan Corporate Social Respocibility dan Good Corporate Governance Sebagai Variabel Pemoderasi. Universitas Diponegoro, Semarang
Riyanto,Bambang.2001.Dasar-dasarpembelanjaanPerusahaan.Yogyakarta:BPFE.
Rahmawati, Intan dan Akram , 2007, Faktor-faktor yang Mempengaruhi Kebijakan Dividen dan Pengaruhnya terhadap Nilai Perusahaan Pada Perusahaan=Perusahaan di BEJ Periode 2000 – 2004, Jurnal Riset Akuntansi Aksioma, Vol 6., No 1. Juni 2007 Sawir,Agnes.2005.AnalisisKinerjaKeuangandanPerencanaanKeuanganPerusahaan,Jakarta:
PT. GramediaPustakaUtama.
Susilo,Agus.2009.PengaruhPergerakanRasioProfitabilitasEmitenTerhadapPerubahanHargaS aham(studiKasusPerusahaanPerbankanYangTerdaftarDiBursaEfekIndonesiaTahun2 005-2007),UniversitasMuhammadiyahSurakarta,FakultasEkonomiManajemen. Samuelson A. Paul and William D. Nordhaus. 2004. Ilmu Ekonomi Makro, Edisi Bahasa
Indonesia, Jakarta, PT. Media Global
Sriyono, Sriyono. 2015, Tracking of Transmission Mechanism on Inflation Targeting. Proceedings of 2nd International Conference for Emerging Market Bali, 22 - 23 Jan
Smith Jr.Clifford W.,dan Ross L.Watss. 1992. ”The Investment Opportunity Set and
Corporate Financing, Dividend,and Compensation Policies”, Journal of Fianancial
Economics, 2:263-292
Tandelilin, Eduardus.2001. Analisis Investasi dan Manajemen Portofolio‖, BPFE, Yogyakarta.
Utama, Siddharta dan Anton Yulianto Budi Santosa. 1998. “Kaitan antara Rasio Price/Book
Value dan Imbal Hasil Saham pada Bursa Efek Jakarta”. Jurnal Riset Akuntansi