STUDY ON THE EXPLAINABLE ABILITY BY USING AIRBORNE LIDAR IN STAND
VALUE AND STAND COMPETITION
S. C. Huanga, J. Y. Yeh b, C. T. Chen b, J. C. Chen b,*
aGraduate Institute of Bioresources, National Pingtung University of Science and Technology. 91201 No.1, Shuehfu Rd., Neipu,
Pingtung, Taiwan - [email protected]
b Department of Forestry, National Pingtung University of Science and Technology 91201 No.1, Shuehfu Rd., Neipu, Pingtung,
Taiwan - (m10212004, cct, zzzjohn)@mail.npust.edu.tw
Commission I, WG I/2
KEY WORDS: Airborne laser scanning, LiDAR characteristic values, Stand height, Stand competition index
ABSTRACT:
Forest canopy structure is composed by the various species. Sun light is a main factor to affect the crown structures after tree competition. However, thinning operation is an appropriate way to control canopy density, which can adjust the competition conditions in the different crown structures. Recently, Airborne Light Detection and Ranging (LiDAR), has been established as a standard technology for high precision three dimensional forest data acquisition; it could get stand characteristics with three-dimensional information that had develop potential for the structure characteristics of forest canopy. The 65 years old, different planting density of Cryptomeria japonica experiment area was selected for this study in Nanytou, Taiwan. Use the LiDAR image to estimate LiDAR characteristic values by constructed CHM, voxel-based LiDAR, mu0ltiple echoes, and assess the accuracy of stand characteristics with intensity values and field data. The competition index was calculated with field data, and estimate competition index of LiDAR via multiple linear regression. The results showed that the highest accuracy with stand characteristics was stand high which estimate by LiDAR, its average accuracy of 91.03%. LiDAR raster grid size was 20 m × 20 m for the correlation was the best, however, the higher canopy density will reduce the accuracy of the LiDAR characteristic values to estimate the stand characteristics. The significantly affect canopy thickness and the degree of competition in different planting distances.
1. INTRUCTION
The Forest canopy structure is composed of the various species. Sunlight is a main factor to affect the crown structures after tree competition (Parker, 1995). And the tree crown is the main places of photosynthesis, canopy size and healthy, determine the size of the standing of the productivity and growth. Through the tree crown has a critical impact on process of tree life and the long term of competition (Metz et al., 2013). Therefore, to determine the forest canopy structure is a key to the forest management (Wulder et al., 2012). Recently, the LiDAR (Light Detection and Ranging) can provide the three-dimensional structure information, and it can be used in forest structure and to catch the point cloud of trees. So we can use those Laser penetration index (LPI) to discover the spatial distribution in Horizontal and vertical structure. Nowadays, there is Serval study was confirmed that LiDAR can be used in leaf area index (LAI), biomass, and forest canopy structure analysis (Asner et al., 2011; d'Oliveira et al., 2012; Tang et al., 2012; Wei et al., 2010; Lin 2013). Furthermore, the difference of height in canopy surface can be used to establish the CHM (Canopy height model) (Cartus et al., 2012). All in all, to use the height information of LiDAR laser points can be improved to acquire the tree parameter (Dupuy et al., 2013; Chen, 2005; Chiang, 2006). In this study will focus on penetration characteristics of the LiDAR laser points. To analysis the forest structure and discuss the explanatory of airborne LiDAR 3-dimensional data in different plant density.
* Corresponding author
2. MATERIALS AND METHODS 2.1 Study Area
The study area is located in Nantou, Taiwan. Where has 65 years old, different planting density of the Cryptomeria japonica experiment site. The study site was shown in Figure 1.
Figure1. The study area
2.2 Material
2.2.1 LiDAR data: The LiDAR data that were used in this study is from Industrial Technology Research Institute Taiwan. They use the Leica ALS50 system and was loaded on plane to map the experiment site. The cloud points average density are around 2-4 pts m-2. The flight parameters can be shown in Table1.
Table1. Flight parameters the precise and high density 3- dimensional point cloud.
2.2.2 Field survey: The height of study site is around 1200 m above sea level, and the slope is about 15∘. This plantation was planted in 1950 and was used to discuss the tree growth between different plant densities.
According to the different planting densities, set sample site 1 m × 1 m, 2 m × 2 m, 3 m × 3 m, 4 m × 4 m, and 5 m × 5 m in different planting distance, total in 15 plots. And record the tree parameters such as tree height, under branch height, diameter breast height, crown width, and crown closure. Furthermore, use the VBS-RTK (Virtual base station real-time kinematic) and total station to coordinate every trees position. Enable to discuss the accuracy of the airborne LiDAR data.
2.3 Derivation the stand value from LiDAR data
With the property of the LiDAR image through the echoes classify method, the first echo can be defined to DSM (digital surface model), and the ground echoes could be defined to the DEM. The DSM and DEM subtraction can be obtained CHM, CHM completion of the data extracted by the production stand at different heights within the parameters of the high stand.
In order to realize the accuracy of stand value estimate by the LiDAR image, the inspection was applied:
Residual = estimate value − observed value………….…(1)
Accuracy = −| − |× %...(2)
2.4 Establish the correlate between the LiDAR index and stand competition index
2.4.1 Stand competition index: The stand competition index can be separated into distance independent competition index and distance dependent competition index two parts (Porte and Bartelink, 2002). In this case, we focus on distance dependent competition index-the improve Hegyi index, which was considered in the distance of trees was too short (Li and Yen 2010).
This study was used Hegyi index to discuss the stand competition status. The search radius was defined to 3.05 m, the trees. The trees were select for competition within the scope of wood (Hegyi, 1974), and complement the competition of trees. The formula can be shown below:
CI = ∑=1 �� × (� +11 )………(3)
Where Di=mainly trees DBH Dj=competition trees DBH
Lij=the distance between competition trees and mainly trees
2.4.2 Establish the stand competition correlation
Use the CHM to obtain the stand height, under branch height, crown closure, and crown depth, by airborne LiDAR. Then the final point cloud contains information such as the ratio of the echo intensity values and point clouds and other categories of factor 10, with the index ground survey stands competition with the multiple linear regression (MLR) conduct relations type of establishment. The stand competition index was defined as dependent variable and others was defined as independent variable. To develop belongs to light up the stand competition index.
3. RESULT
3.1 Derivation the stand value from LiDAR data
By the equation(1) and equation(2), we can obtain the accuracy of stand value by LiDAR image.
3.1.1 Estimate the stand height by LiDAR image: According to the Table2, the result of estimate stand height was shown below.
Table2. The result of stand height estimation
Plot Estimate
11 21.47 21.29 0.18 99.16
According to the Table2, the absolute value of the residual range between 0.05-5.67 m. The overall accuracy was higher than 78%, the highest accuracy can reach 99%, with an average accuracy of 91.03%, can be seen the LiDAR is useful to estimate the stand height.
Hsiao and Tesng (2009) were indicated the highest accuracy, but estimated height of the general underestimate the situation, because LiDAR is difficult to obtain point cloud data is located in the treetops, and it always catches the branch and parts where are lower than the treetops. Yu et al., (2004) were collocated stand high about 14-93% undervalued, consistent with the results of this study.
DEM accuracy of LiDAR data that affected the ground point cloud density, such as a lower ground echoes value, the result will lead to errors reckoning on. Especially when the slope is too large or undulating terrain, that will not be formed uniform distribution of the point cloud, and therefore the production of DEM, due to insufficient ground point data, but cannot show a change in terrain, will lead to a greater use of LiDAR error reckoning tree high (Véga and Durrieu, 2011; Tang et al., 2012) .
3.1.2 Estimate the under branch height by LiDAR image: The result of estimate under branch height was shown below.
Table3. The result of under branch height estimation
Plot Estimate
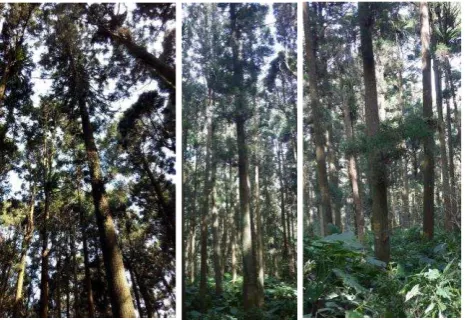
The cause of the difference between having a XXX estimated and measured values, because in the area of the forest like a lot of branches, sprout everywhere, leading investigators determine the error easily caused(Figure2).
Figure 2 Sprout of forest
Overall, the application of three-dimensional pixel stratified analysis LIDAR data to estimate forest under the high branch has its feasibility. The variable element of the three-dimensional image produced stratification more direct, without going through the establishment of other models can be obtained and no cumulative error more able to stand structure performance (Popescu and Zhao, 2008; Reitberger et al., 2009).
3.2 Establish the correlate between the LiDAR index and stand competition index
3.2.1 Establish the stand competition index: In order to discuss the stand competition in different plant distances. This study was used the improve Hegyi index to understand the competition, and define the distance to 3.05 m as the fixed search radius. The trees were selected for competition within the scope of wood. The result can be seen in the Table4.
Table4. Stand competition in different planting distance
Plot Planting distance (m) Stand competition index
2 1 × 1 1.286±0.937 competition index. Stand Competition Index 15 sample area of The International Archives of the Photogrammetry, Remote Sensing and Spatial Information Sciences, Volume XLI-B1, 2016
up to 1.286 ± 0.937, a minimum of 0.000 ± 0.000, showing no competition in the plot. Most of stand competition index is based on the size and planting distance increased or reduced, in addition to the plot6 and the plot9, the planting distance is 2 m × 2 m and stand competition index of 5 m × 5 m was higher, presumably the reason for the natural regeneration, resulting in the growth of forest trees between the skew caused by variation of the distance, so that competition index of forest due to improvement.
The stand competition index has found differences in different planting distances, this study using one-way ANOVA with Tukey HSD post-test work, to explore five different planting distance between the differences stand competition index, the results as shown in Table5.
Table5. The one-way ANOVA of stand competition in different planting distance among five different planting distances, respectively. Due to the distance between the five different planting from stand competition there are significant differences in the index, so further analysis to understand the differences between the different planting distances (Table6) through Tukey HSD method.
Table6. Stand competitive index analysis in variant between the five different planting distances
When planting distance is small, such as 1 m × 1 m and 2 m × 2 m, the stand competition from the larger index and planting 3 m × 3 m, 4 m × 4 m and 5 m × 5 m having very significant differences.
Based on these data to produce a box plot showing the distribution of stand competition index. The small boxes are average. Border box diagram representation of the standard deviation results shown in Figure 3.
Figure3. The contribute of stand competition index in 5 planting distance
Through Figure 3 shows the standard deviation of the variation in the index stand the competition from the plant up to 3 m × 3 m, it indicates the stand competition index greater than other variations, followed by 1 m × 1 m and the standard deviation from the plant 4 m × 4 m minimum variation. This can be inferred, when the planting distance is small, the growth space is limited, resulting in competition between the forest resources situation is more serious; In contrast, when a large planting distance, the index than other stand competition from the plant have the trend is clearly reduced, showing its growing space broader trees, trees contribute to growth, the degree of competition for resources is low.
Pedersen et al., (2013) estimated the stand value and calculated 7 stand competition by airborne LiDAR. And separated the competition index into space, non-space, and echo 3 types. The results show that when the competitors are within a radius of 3-4 m, the trees are mostly spatial autocorrelation, although this study only through Hegyi index search radius 3.05 m, but the increase will be based on the results from the plant stand to make the consistent reduction of the degree of competition results.
4. CONCLUTION
Tree competition is an important reference information tending plantation thinning. In recent years, with a three-dimensional space information form LiDAR conducive to get the standing information. Through this study, the penetration characteristics of LiDAR establishing canopy height model to investigate the information on stand value. To discuss the three-dimensional information from the LiDAR image under different planting densities of its ability to explain the structure of the stand.
Estimation of various stand-state values, including high stand by LiDAR, shows performed by LiDAR of Stand estimates are feasible.
Through the stand competitive index estimate by LiDAR, find a different stand from the plant will definitely affect the degree of competition, when the planting distance is small, the growth space is limited, resulting in competition between each other forest resources situation is more serious. In contrast, when a large planting distance, its stand competition index trend of significantly lower than other planting distance, showing the growth of their trees broader space and help the growth of trees, the extent of its resources are more competitive low.
planting distances
REFERENCES
Parker, R. C. (2006) Computer Automation of a LiDAR Double-Sample Forest Inventory. Forest and Wildlife Research Center, Mississppi State University. pp. 19.
Metz, J., D. Seidel, P. Schall, D. Scheffer, E. D. Schulze, and C. Ammer (2013) Crown modeling by terrestrial laser scanning as an approach to assess the effect of aboveground intra- and interspecific competition on tree growth. Fo`rest Ecology and Management 310, pp. 275-288.
Wulder, M. A., J. C. White, R. F. Nelson, E. Næsset, H. O. Ørka, N. C. Coops, T. Hilker, C. W. Bater, and T. Gobakken (2012) Lidar sampling for large-area forest characterization-A review. Remote Sensing of Environment 121, pp. 196-209.
Asner, G. P., J. Mascaro, H. C. Muller, G. Vieilledent, R. Vaudry, and M. Rasamoelina (2011) A universal airborne LiDAR approach for tropical olume Equation of Cryptomeria japonica in Alishan Area. Journal of Geographical Science (59), pp. 67-80.
Lin, L. P. (2013) Estimation of Forest Canopy Height Model and Leaf Area Index Using Airborne LiDAR data. Department of Geomatics National Cheng Kung University, pp.69.
Cartus, O., J. Kellndorfer, M. Rombach, and W. Walker (2012) Mapping canopy height and growing stock volume using airborne Lidar, ALOS PALSAR and Landsat ETM+. Remote Sensing 4, pp 3320-3345.
Dupuy, S., G. Lainéa, J. Tassinb, and J. M. Sarrailh (2013) Characterization of the horizontal structure of the tropical forest canopy using object-based LiDAR and multispectral image analysis. International Journal of Applied Earth Observation and Geoinformation 25: 76-86.
Chen, Y. K., J. F. Fan, K. S. Yeh, C. C. Cheng, and Y. H. Shih (2005) A Study on Estimating Tree Heights from Terrestrial Laser Scanner Data. Journal of Photogrammetry and Remote Sensing 10(4), 327-336.
Chiang T. W. (2006) Fusion of LIDAR Data and High Resolution Images for Forest Canopy Modeling. Department of Civil Engineering. National Central University pp. 82.
Wang Z. D. (1977) Studies on the growth f Japanese cedar (Cryptomeria japonica) plantation under different spacing. Experimental Forest, National Taiwan University
Porte, A., and H. H. Bartelink (2002) Modelling mixed forest growth: a review of models for forest management. Ecological Modelling 150, 141-188.
Li L. E., and T. M. Yen (2010) Thinning Effects on Stand and Tree Levels of Taiwan Red Cypress (Chamaecyparis Formosensis Matsum.) 4 Years After Thinned. Quarterly Journal of Chinese Forestry 43(2), 249-260.
Hegyi, F. (1974) A simulation model for managing jack-pine stands. p. 74-90. In: Fries, J. (Ed.) Growth models for tree and stand simulation. Royal Collage of Forestry, Stockholm.
Hsiao, C. Y., and Y. H. Tesng (2009) Estimation of Forest Region and Canopy Volume Using Airborne LiDAR Data and Remote Sensing Imagery. Journal of Photogrammetry and Remote Sensing 14(1), 51-64.
Yu, X., J. Hyyppä, H. Kaartinen, and M. Maltamo (2004) Automatic detection of harvested trees and determination of forest growth using airborne laser scanning. Remote Sensing of Environment 90, 451-462.
Véga, C., and S. Durrieu (2011) Multi-level filtering segmentation to measure individual tree parameters based on Lidar data: application to a mountainous forest with heterogeneous stands. International Journal of Applied Earth Observation and Geoinformation 13, 646-656.
Tang, H., R. Dubayah, A. Swatantran, M. Hofton, S. Sheldon, D. B. Clark, and B. Blair (2012) Retrieval of vertical LAI profiles over tropical rain forests using waveform lidar at La Selva, Costa Rica. Remote Sensing of Environment 124, 242-250.
Popescu, S. C., and K. Zhao (2008) A voxel-based LiDAR method for estimating crown base height for deciduous and pine trees. Remote Sensing of Environment 112: 767-781.
Reitberger, J., C. Schnörr, P. Krzystek, and U. Stilla (2009) 3D segmentation of single trees exploiting full waveform LIDAR data. ISPRS Journal of Photogrammetry and Remote Sensing 64: 561-574.
Pedersen, R. Ø., E. Næsset, T. Gobakken, and O. M. Bollandsås (2013) On the evaluation of competition indices: The problem of overlapping samples. Forest Ecology and Management 310: 120-133.
Revised April 2016