Using social media for disaster emergency management
Y.D. Wang a*, T. Wang a, X.Y. Ye b,*, J.Q. Zhu a, J. Lee c, b,
a State key Laboratory of Information Engineering in Surveying, Mapping and Remote Sensing, Wuhan University, Wuhan, China -
[email protected] (Y.W.); [email protected] (T.W.); 12 [email protected] (J.Z.) b Department of Geography, Kent State University, Kent, USA - [email protected] (X.Y.); [email protected] (J.L.)
c College of Environment and Planning, Henan University, Kaifeng, Henan, China
* Corresponding author. Email: [email protected] ; [email protected]
Theme Sessions, ThS 12
KEY WORDS: social media, Sina-Weibo, emergency information, timely, Beijing rainstorm
Social media have become a universal phenomenon in our society (Wang et al., 2012). As a new data source, social media have been widely used in knowledge discovery in fields related to health (Jackson et al., 2014), human behaviour (Lee, 2014), social influence (Hong, 2013), and market analysis (Hanna et al., 2011).
In this paper, we report a case study of the 2012 Beijing Rainstorm to investigate how emergency information was timely distributed using social media during emergency events. We present a classification and location model for social media text streams during emergency events. This model classifies social media text streams based on their topical contents. Integrated with a trend analysis, we show how Sina-Weibo fluctuated during emergency events. Using a spatial statistical analysis method, we found that the distribution patterns of Sina-Weibo were related to the emergency events but varied among different topics. This study helps us to better understand emergency events so that decision-makers can act on emergencies in a timely manner. In addition, this paper presents the tools, methods, and models developed in this study that can be used to work with text streams from social media in the context of disaster management.
1. DATA
On July 21-22, 2012, Beijing suffered the strongest rainstorm and urban flooding in over 60 years. According to data released by the Beijing City Government, about 1.6 million people’s normal daily lives were disrupted, some 10.6 thousand houses were destroyed and the economic loss was estimated to be around 11.64 billion yuan.
Sina-Weibo (e.g., http://us.weibo.com), a Twitter-like microblogging system, is the most popular microblogging service in China. Using web crawlers and Sina Weibo API, we collected 706,835 Sina-Weibo with ‘Beijing rainstorm’ as the keyword with time stamps between 00:00 AM on July 20 and 24:00 AM on August 10. Among collected, there were 26,050 Sina-Weibo texts which contained GPS information, and 10,988 of them were located in Beijing.
2. THE CLASSIFICATION AND LOCATION OF EMERGENCY INFORMATION
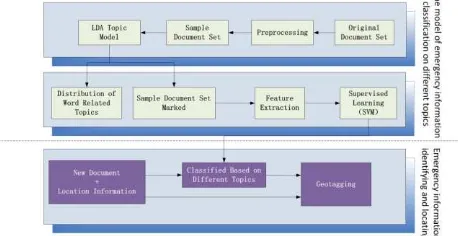
As the first step in analysing Sina-Weibo, we formulated a classification and location model. This model combines a latent Dirichlet allocation (LDA) algorithm [36] and a support vector
machine (SVM) algorithm to classify Sina-Weibo text streams in real time. As shown in the Figure 1, we first used the LDA algorithm to classify Sina-Weibo text streams posted by topics of concerns in the initial stage of the emergency event. Then, we utilized the classification results as training samples for the SVM algorithm. Thus, each Sina-Weibo text obtained in real time was classified using SVM algorithm. It should be noted that additional steps might be needed for the model. First of all, because of the noise of the text, text pre-processing was necessary for the original Sina-Weibo texts. Given that the contents of Sina-Weibo texts were time-sensitive during the unfolding of emergency events, the emergency information classification model should be reconstructed iteratively with regular time intervals.
Figure 1. real-time social media text streams classification and location model
Finally, based on our proposed model, in the event of
‘Beijing rainstorm’, we generalized five topics (‘traffic’, ‘weather’, ‘disaster information’, ‘loss and influence’, ‘rescue
information’).
3. TREND ANALYSIS
In order to accurately display changes in the number of social media streams under different topics over time, we calculated the proportion of the number of microblogging under different topics within each hour to the total number of microblogging within the same hour. The trend of the three topics ( "weather", "disaster information", "loss and influence") are shown in Fig 2 respectively. As can be seen from Figure 2, the proportion of the microblogging under the topic related to
“weather” reached a peak around at 07:00 on July 21, and it reached a new peak around at 12:00, while the proportion of
the microblogging under the topic related to “disaster
The International Archives of the Photogrammetry, Remote Sensing and Spatial Information Sciences, Volume XLI-B2, 2016 XXIII ISPRS Congress, 12–19 July 2016, Prague, Czech Republic
This contribution has been peer-reviewed.
information” and “loss and influence” had been very little.
However, the proportion of the microblogging under the topic
related to “disaster information” is much higher than the
proportion of the microblogging under the other two topics. The proportion of the microblogging under the topic related to
“loss and influence” had been in the doldrums until 02:00 on
July 22, however it reached a peak at 03:00, and maintained at a very high value continued to 11:00.
Figure 2. the trend of Sina-Weibo under different topics over time
Combined with the entire development process of the
‘Beijing rainstorm’, these three topics correspond exactly to
the three stages: ‘before the rainstorm’, ‘rainstorm’, and ‘after the rainstorm’. Therefore, changes in the proportion of the Sina-Weibo under different topics reflected the development process of emergency events. The trends extracted from Sina-Weibo text streams, given their close correspondence with how the events proceeded, can be used to help to predict development of events.
4. SPATIAL ANALYSIS
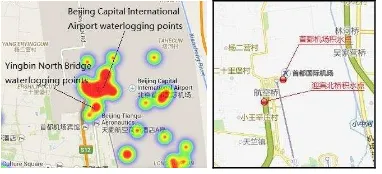
In heat map related to emergency events, there are many hotspots in some area. These hotspots is outliers of emergencies, they often reflect serious regional in emergency events. If identify these outliers timely, we can allocate emergency resources rationally and effectively. Kernel density estimation, as shown in Formula 1, can be used to detect hotspots. Combined with the detecting outliers in the spatial
distribution of microblogging, x_i (i=1,2,…,n) represent points
corresponding to the microblogging and these points obey unknown distribution, h represent radius of the hotspot. The longer radius the hotspot is the larger sphere of influence the point corresponding to the microblogging becomes. After a number of experiments, when the Gaussian function was kernel density estimation method. Spatial distribution of heat map about rainstorm around the Beijing Capital International Airport was displayed in Figure 3 a). The hotspots in heat map are consistent with stagnant water zones in figure 3 b) which is produced by Sogou Map according to official data provided afterwards(source from http://map.sogou.com).
a) Heat Map about Torrential Rain b) Flooded Points by
Sougou Map
Figure 3. Comparison between Heat Hap of microblogging about Torrential Rain and Chart provided by the Official
When we explore the distribution pattern of microblogging under different topics, Each of these microblogging was regarded as a point feature. Using the method of Kernel Density Estimation, spatial distribution of the microblogging under the topic could be obtained. We extracted microblogging with GPS information under the topic related to “traffic”. Using ArcGIS Spatial Analyst tools, spatial distribution of these microblogging is show as figure 4. In the figure 4, distribution density of the microblogging in Beijing West Railway Station, Beijing Capital International Airport and Beijing Railway Station are significantly higher than other regions. In fact, Beijing West Railway Station and Beijing Capital International Airport is transportation hubs between Beijing and other provinces. Affected by rainstorm, nearly 20 trains were delayed in Beijing West Railway Station, and a lot of flights were delayed in Beijing Capital International Airport, nearly 80,000 passengers stranded at the airport
Figure 4. spatial distribution of the microblogging under the topic related to “traffic”
From the result of spatial analysis by different topics about ‘Beijing Rainstorm’, the clustering analysis by topics can well reflect the spatial distribution of the topics. When an emergency occurred, spatial analysis under different topics may be focused in a particular aspect of the event, so as to obtain more valuable information.
REFERENCES
Wang, Z., Tchernev, J. M., and Solloway, T., 2012. A dynamic longitudinal examination of social media use, needs, and gratifications among college students. Computers in Human Behavior, 28(5), 1829-1839.
The International Archives of the Photogrammetry, Remote Sensing and Spatial Information Sciences, Volume XLI-B2, 2016 XXIII ISPRS Congress, 12–19 July 2016, Prague, Czech Republic
This contribution has been peer-reviewed.
Jackson D, Brown J, Duffy E, 2014. Australian health professions student use of social media. Collegian Journal of the Royal College of Nursing Australia, 21(2):5410-5423. Lee, H., 2014. Social media and student learning behavior: Plugging into mainstream music offers dynamic ways to learn English. Computers in Human Behavior, 36, 496-501.
Hong, H., 2013. Government websites and social media's influence on government-public relationships. Public Relations Review, 39(4), 346-356.
Hanna, R., Rohm, A., and Crittenden, V. L., 2011. We’re all
connected: The power of the social media ecosystem. Business Horizons, 54(3), 265-273.
The International Archives of the Photogrammetry, Remote Sensing and Spatial Information Sciences, Volume XLI-B2, 2016 XXIII ISPRS Congress, 12–19 July 2016, Prague, Czech Republic
This contribution has been peer-reviewed.