VALIDATION OF SMOS L2 AND L3 SOIL MOISTURE PRODUCTS OVER THE DUERO
BASIN AT DIFFERENT SPATIAL SCALES
A. González-Zamora a, N. Sánchez a, *, A. Gumuzzio a, M. Piles b, E. Olmedo c, J. Martínez-Fernández a
a Universidad de Salamanca/CIALE, Duero 12, 37185 Villamayor, Spain - (aglezzamora, nilda, angela.gumuzzio, jmf)@usal.es b Universitat Politècnica de Catalunya, UPC/IEEC, and SMOS Barcelona Expert Center, Jordi Girona 08034, Barcelona, Spain –
c Institut de Ciències del Mar, ICM/CSIC and SMOS Barcelona Expert Center, Pg. Marítim 3749, 08003 Barcelona, Spain [email protected]
KEY WORDS: Soil moisture, SMOS, Validation, Remote Sensing, L-Band
ABSTRACT:
An increasing number of permanent soil moisture measurement networks are nowadays providing the means for validating new remotely sensed soil moisture estimates such as those provided by the ESA’s Soil Moisture and Ocean Salinity (SMOS) mission. Two types of in situ measurement networks can be found: small-scale (100-10000 km2), which provide multiple ground
measurements within a single satellite footprint, and large-scale (>10000 km2), which contain a single point observation per satellite footprint. This work presents the results of a comprehensive spatial and temporal validation of a long-term (January, 2010 to June, 2014) dataset of SMOS-derived soil moisture estimates using two in situ networks within the Duero basin (Spain). The first one is
the Soil Moisture Measurement Stations Network of the University of Salamanca (REMEDHUS), which has been extensively applied for validation of soil moisture remote sensing observations, including SMOS. REMEDHUS can be considered within the small-scale network group (1300 km2). The other network started from an existing meteorological network from the Castilla y León region, where soil moisture probes were incorporated in 2012. This network can be considered within the large-scale group (65000 km2). Results from comparison to in situ show that the new reprocessed L2 product (v5.51) improves the accuracy of former soil moisture retrievals, making them suitable for developing new L3 products. Validation based on comparisons between dense/sparse networks showed that temporal patterns on soil moisture are well reproduced, whereas spatial patterns are difficult to depict given the different spatial representativeness of ground and satellite observations.
* Corresponding author
1. INTRODUCTION
Recently, the World Meteorological Organization (WMO), the Global Climate Observing System and the Committee on Earth Observation Satellites included soil moisture as one of the Essential Climate Variables (WMO, 2010), highlighting its importance in meteorology and climatology, taking a central role in the land surface-atmosphere interface, and in the interactions between soil, vegetation and climate forcing. It is also very important for agricultural applications, as it represents the reservoir of the plant available water.
In the last few years, several satellites have been launched dedicated to globally measuring the Earth’s surface soil moisture based on passive microwave techniques at the frequency band from 1 to 2 GHz (L-band) (Jackson et al., 2012). The Soil Moisture and Ocean Salinity (SMOS) satellite was launched by the European Space Agency (ESA) and is providing the first global maps of soil moisture since January 2010 (Kerr et al., 2010). The second dedicated mission, the National Aeronautics and Space Administration (NASA)’s Soil Moisture Active Passive (SMAP) mission, was launched in January 2015. It aims at retrieving soil moisture and the freeze/thaw state using the combination of active and passive technologies (Entekhabi et al., 2010). A third instrument, Aquarius, was launched in June 2011 on board the international Aquarius/SAC-D mission by NASA and Argentina's space to primarily measure sea surface salinity. This mission is also providing soil moisture products (Lagerloef et al., 2008).
Remotely sensed soil moisture measurements have the advantage of covering large areas and identify synoptic events that are difficult to characterize using in situ measurements, but their averaged and coarse-resolution nature renders validation of these products difficult. A key issue is to bridge the gap between point scale measurements with footprint-scale estimates. Crow et al. (2012) distinguishes between two types of networks, small-scale and large-scale. The small scale networks (between 100 km2 and 10000 km2) have the advantage of providing multiple measurements within a single footprint, and therefore allows for the examination of the sub-footprint scale. The large scale networks (>10000 km2), in turn, have the advantage of covering large areas and a larger range of land cover soil types, but they typically lack of multiple measurements per footprint.
2. IN SITU NETWORKS 2.1 REMEDHUS network
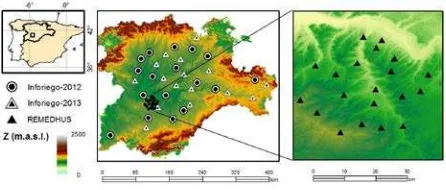
REMEDHUS covers an area over 1300 km2 located in the central Duero Basin (41.1° to 41.5°N and 5.1° to 5.7°W in Spain) ranging from 700 to 900 m.a.s.l., nearly flat (Figure 1). The land uses are rainfed cereals, irrigated crops, vineyards and forest-pasture. This region has a continental semi-arid Mediterranean climate, with a mean temperature of 12°C and an average annual precipitation of 385 mm. The network is equipped with 23 automated stations with capacitance probes (Hydra Probes, Stevens Water Monitoring System, Inc.) measuring every hour in the top 5 cm of the soil.
Figure 1. Location of the two networks used in this study.
REMEDHUS has been widely used in the validation of soil moisture products due to the characteristics and homogeneity of the area. REMEDHUS is a member of the International Soil Moisture Network (Dorigo et al., 2011, https://ismn.geo.tuwien.ac.at/). A detailed description of this network can be found in previous works (Sánchez-Ruiz et al., 2014).
2.2 Inforiego network
This soil moisture network was set up profiting an existent meteorological network dedicated to irrigation assessment (http://www.inforiego.org/). The network is deployed over the Duero River Basin (north-western part of the Iberian Peninsula) and it covers an area over 65000 km2 (Figure 1). The area is surrounded by mountains to the north, south and east, with an average height over 800 m.a.s.l. The land uses in this network are similar to those of REMEDHUS: rainfed crops in winter-spring and irrigated crops in summer. The climate of the region is continental semi-arid Mediterranean with an average temperature of 11.7°C and an average annual precipitation of 450 mm.
Inforiego soil moisture network had 17 stations in use from July 2012 to July 2013 (hereafter Inforiego-2012) and other 16 different stations were available between August 2013 and August 2014 (hereafter Inforiego-2013). These 33 stations were selected following the distribution and localization of the main sub-basins of the Duero River Basin and the representativeness of the soil type and land use. As in the REMEDHUS network, Hydra Probes were installed at a 5 cm depth.
3. SMOS DATA 3.1 SMOS L2 soil moisture
The SMOS Soil Moisture Level 2 User Data Product (SMUDP2 file) version 5.51 contains retrieved geophysical parameters (soil moisture and optical thickness) as well as complementary quality parameters. This product is distributed in an Icosahedral
Snyder Equal Area Earth grid (ISEA-4H9) with equally spaced nodes at approximately 15 km, called Discrete Global Grid (DGG). A more detailed description of the L2 algorithm can be found in Kerr et al. (2012). Data of L2 soil moisture v5.51 from January 2010 to June 2014 over the river Duero Basin were used in this study (Table 1). The REMEDHUS area is covered by 11 DGGs, and Inforiego area is covered by approximately 300 DGGs.
Two filter criteria were used. The first filter was a threshold over the Data Quality Index (DQX, which represents the uncertainty of the retrieval) of 0.04 (volumetric soil moisture units, m3m-3) was used to select the best-quality SMOS retrievals. This threshold restricts the retrieval to the theoretical accuracy of the SMOS targeted accuracy and is usual in validation experiments. The second filter is based on the probability of occurrence of Radio Frequency Interferences (RFIs), which is updated in a new flag (RFI_Prob flag) in this version for each grid node. Users can use this indicator as a predictor of the RFI corruption, ranging from 0 (no RFI probability) to 1 (expected corrupted data). For this research, the use of several thresholds was explored. When a filter of 0.4 was applied, the number of data was reduced by 3.8% for ascending orbits and 3.1% for descending orbits. Using a more restrictive filter of 0.3, the data reduction was 5.8% for ascending and 6.4% for descending orbits. Thus, prior to further analysis, three levels of RFI filtering were tested: 0.4, 0.3 and none. There were no meaningful differences in the validation results, except in the Root Mean Square Difference, which was reduced by 0.01%. Thus, only DQX filtering was applied.
Soil moisture datasets Number of data Asc. Des.
REMEDHUS network 1642 1642
Inforiego-2012 network 363 363 Inforiego-2013 network 334 334
SMOS L2 (REMEDHUS) 835 881
SMOS L2 (Inforiego-2012) 229 248 SMOS L2 (Inforiego-2013) 234 233 SMOS BEC L3 (REMEDHUS) 804 851 SMOS BEC L3 (Inforiego-2012) 226 251 SMOS BEC L3 (Inforiego-2013) 233 235
Table 1. Number of data for each dataset
3.2 SMOS BEC L3 soil moisture product
The REMEDHUS area is covered by 4 L3 pixels, and Inforiego is covered by approximately 100 L3 pixels.
4. METHODOLOGY
L2 and L3 soil moisture datasets were compared with the in situ
data at the two spatial scales provided by the REMEDHUS and Inforiego networks. Spatial and temporal comparisons were performed.
For the temporal comparisons, the entire time series of the satellite soil moisture estimates were compared with ground measurements that were previously collocated in time with the SMOS overpasses. At point-scale measurements at each station with its collocated DGG (L2) and pixel (L3) were compared. Also, the in situ data from both networks were averaged using
area-average, land-use-average, soil-texture-average. SMOS ascending and descending passes were distinguished in order to assess their individual performances. Regarding the land use, four categories were taken into account (rainfed cereals, vineyard, forest-pasture and irrigated) and for texture, four soil categories were considered: fine (including silty clay loam, clay loam, clay and loam textures), medium (including sandy loam and clay loam textures), coarse (including loamy sand texture) and very coarse (including sand texture). The distribution of the soil texture compositions of the 56 stations used showed a slightly high sand content at most of the stations (Figure 2).
Figure 2. Soil texture distribution of the 56 stations used. Orange, red, green and blue colors represent fine, medium,
coarse and very coarse texture, respectively.
Regarding the spatial validation, spatially collocated SMOS and
in situ observations for each day were compared. A threshold of
16 concurrent observations was established as the minimum to compute statistics for a given day. This threshold tried to preserve a robust comparison while taking into account the number of the stations in each network.
The statistical metrics chosen for evaluate the comparison were the correlation coefficient (R of Pearson), the RMSD and the centered RMSD (cRMSD), the bias and the standard deviation (std). Additionally, Taylor diagram (Taylor, 2001) was used for the temporal validation at point-scale. This diagram relates the metrics of R, std and cRMSD.
5. RESULTS AND DISCUSSION 5.1 Temporal validation
The soil moisture time series in REMEDHUS (Figure 3) and Inforiego (not shown) show that the SMOS data set series have a larger dynamic range than the in situ data. For REMEDHUS,
in situ measurements have a mean value of 0.141 with a minimum of 0.052 in summer and a maximum of 0.280 in winter, with a std of 0.054. The SMOS L2 ascending data ranged from 0.003 to 0.356, with a std of 0.075, and for descending data from 0.009 to 0.439, and the std values are similar for both orbits. The difference between both products is that L2 have larger dynamic range than L3. The SMOS dataset followed the temporal dynamics of the REMEDHUS dataset, although a slight underestimation can be observed, particularly in the dry periods. This dry bias is consistent with recent studies of calibration/validation on SMOS; however, the underestimation observed in this study is considerably smaller than that obtained with previous SMOS L2 versions (Dall'Amico et al., 2012; Sánchez et al., 2012). SMOS showed a quicker reactivity to rainfall events and dry-downs than the ground observations. Both effects, underestimation and reactivity, were already detected in previous experiments on validations in the same area (Sánchez et al., 2012).
Figure 3. Evolution of the soil moisture in situ measurements
(average of stations) and SMOS products (average of DGGs/Pixels), along with rainfall, during the study period (January 2010-June 2014) for the REMEDHUS network. Top,
ascending orbit, bottom, descending orbit.
Inforiego networks (Table 2). The SMOS cRMSD reached the expected accuracy of 0.04 m3m-3, and the bias was always positive (i.e., dry bias); the value is higher for both Inforiego networks (Table 2) than for REMEDHUS. This effect can be explained by the length of the time series, which is shorter for Inforiego, resulting in more accentuated seasonal effects that are smoothed in the longer time series of REMEDHUS.
A
ll
toge
the
r R 0.78 0.83 0.79 0.82
bias 0.034 0.014 0.034 0.014
RMSD 0.056 0.040 0.055 0.040
cRMSD 0.044 0.037 0.043 0.037 Table 2. Results of the comparison between the spatially averaged series of soil moisture for the three networks in each
usable time series.
From the time series comparison, it can be stated that the SMOS soil moisture products were generally underestimated. This underestimation appears to be larger for the ascending products than for the descending (Table 2) and for shorter time series. Regarding the products and orbits, there was no difference between the L2 and L3 performances, and the ascending and descending series were similar in terms of R and cRMSD, with a bias noticeably smaller for the descending series (Table 2). When computing the comparison of all 56 stations (REMEDHUS + two Inforiego), the statistics slightly improved. Increasing the number of stations and integrating the scales led to a smaller bias.
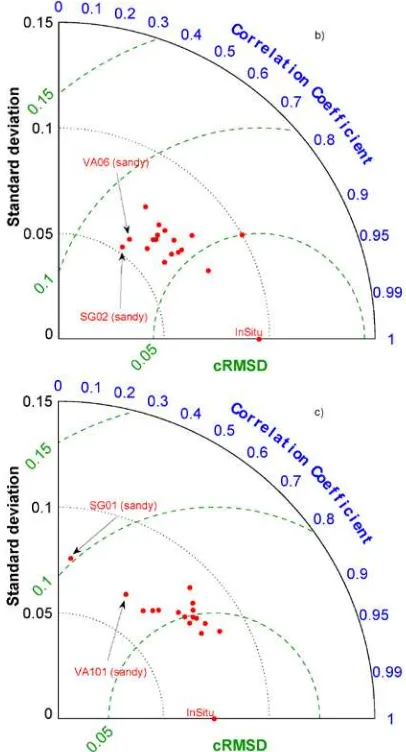
Figure 3. Results of the comparison between each station in: a) the REMEDHUS network, b) the Inforiego-2012 network, c) the Inforiego-2013 network and its corresponding L2 ascending
DGG. Only stations with results discussed in the text are labeled.
Using Taylor diagrams (Figure 3, only L2 ascending data was shown) it can be seen R ranging from 0.41 to 0.8, and a cRMSD from 0.045 to 0.145 for the L2/L3 and ascending/descending data respectively, in REMEDHUS (Figure 3a). Similar metrics were obtained for the Inforiego networks. The worst results were obtained for K9, H7 and I6. These poor results in H7 and I6 may be attributed to the very high sand content at these stations (85% and 90%, respectively), which is consistent with a particular behavior of these soils that cannot be captured by the average values of SMOS (Panciera, 2009; Crow et al., 2012). Soils with higher sand content exhibited persistently drier soil moisture conditions than soils with finer textures. The K9 station is located in an irrigated area, where the soil moisture pattern is controlled by repetitive irrigations events. Inforiego-2012 (Figure 3b) and Inforiego-2013 (Figure 3c) had better results than REMEDHUS, with R~0.91, and cRMSD ranged between 0.036 and 0.102. Also, the in situ cRMSD is smaller
than that obtained with REMEDHUS. The scatter of the cRMSD values of the Inforiego stations is higher than REMEDHUS (Figure 3), and the worst results were obtained for the sand stations (SG02, VA06, SG01 and VA101, H7 and I6). In 10 out of 23 REMEDHUS stations and in 7 out of 33 Inforiego stations, the bias was negative, indicating
L2 L3
Asc. Des. Asc. Des.
R
E
M
E
DHUS
R 0.80 0.81 0.80 0.79
bias 0.034 0.023 0.037 0.027
RMSD 0.057 0.051 0.056 0.051
cRMSD 0.045 0.045 0.042 0.043
In
fo
.
2012
R 0.84 0.88 0.84 0.87
bias 0.073 0.042 0.078 0.047
RMSD 0.088 0.064 0.093 0.069
cRMSD 0.050 0.048 0.050 0.050
In
fo
.
2013
R 0.85 0.85 0.87 0.80
bias 0.059 0.050 0.063 0.038
RMSD 0.071 0.073 0.073 0.061
underestimations (not shown). Overall, the bias for each station in both networks ranged between -0.084 and 0.215.
In summary, the results of the comparisons at the point scale were less satisfactory than those taking into account the regional average of each network, in agreement with other works. According to Bircher et al. (2012), point measurements do not necessarily support coarse-resolution satellite observations due to the heterogeneity of the soil and the vegetation cover. Several strategies of data upscaling are required to more effectively translate the information derived from sparse point-scale ground-based sensors to satellite footprint resolutions (Crow et al., 2012).
The results of the comparisons regarding to soil use and texture, were in agreement with the results obtained for the area-averaged and point-scale analyses, showing a generally better match for the Inforiego networks than for REMEDHUS. No differences between orbits were detected, with values of R>0.80 in all cases excepting for the irrigated land use (R~0.46) and very coarse textures (R~0.60). In contrast, for the higher soil moisture contents (forest-pasture and fine textures), the bias is the highest (bias > 0.180). Rainfed land use and medium soil textures, which are common in the area, exhibited the best results in terms of R (>0.82), bias (<0.05) and cRMSD (<0.05).
5.2 Spatial validation
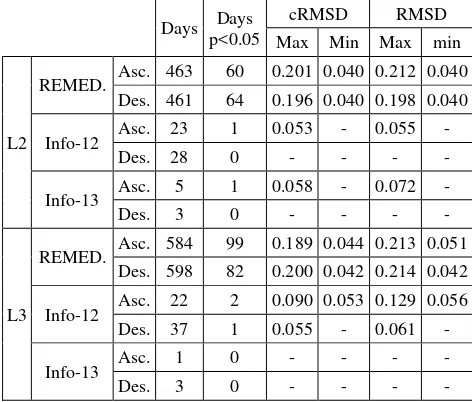
The daily validation showed poor results for both networks (Table 3). Of all the dates studied, only 13.9% of the comparisons have a p-value<0.05. Negative and positive correlations were found for all products and networks. The variability between the satellite products (15 km for L2 and 25 km for L3) and the in situ measurements (point scale) is
extremely large. Given this spatial difference their direct comparison is debatable.
Table 3. Results of the daily validation for the days were the correlation was significant (p-value <0.05) given a threshold of
16 concurrent pairwise observations for calculation.
To explore the comparisons at an improved spatial matching, a new spatial validation was performed (not shown) using a SMOS-derived product at a 1 km spatial resolution (Piles et al., 2014). Still, poor results were obtained. No significant correlation was found at the 95% confidence level for the daily correlation at a 1 km resolution at any network.
6. CONCLUSIONS
A comprehensive validation of SMOS L2 and L3 soil moisture products over the Duero basin, Spain, was presented by comparison with in situ measurements at a small- and a
large-scale network. Compared with former SMOS validations, this version of the SMOS L2 product (v5.51) exhibits better results in terms of temporal comparison with in situ measurements,
which demonstrates its potential for developing new L3 products at different temporal resolutions and regular grids, as the ones presented in this work. Indeed, there was not a significant difference between the statistical scores obtained with L2 and L3 data. However, a general dry bias was observed in both the SMOS L2 and the SMOS L3 products. This effect appears to be larger for the shorter time series and for the ascending overpasses. The areal-averaged results were confirmed by the comparisons at the point scale, except at stations with particular conditions (very sandy soil and irrigated plots) were in the comparison obtained worst results. For temporal correlations, the results obtained for the large-scale network were slightly better than for the small-scale site, indicating that enlarging the spatial extent of the network resulted in a better matching. In this line, when all networks were jointly computed, better results were obtained.
A detailed analysis of soil types and land coverages was also performed. Regarding to soil texture and land use, better results were achieved, except for irrigated land use and verycoarsetextured soils. This can be explained by the high sand content, -which coincides with vineyard use- leading to a quick soil moisture decrease in the top soil layer, therefore hindering a good estimation. Conversely, a lower bias in the vineyard land use and very coarse soils was found, maybe due to their typically low soil moisture content. The main type of soils in the area (medium coarse) and land use (rainfed crops) showed the best results for all the statistics used. In this case, the data representativeness and favourable results are correlated.
Regarding the spatial validation, only a few dates show a significant correlation for both networks. It seemed almost impossible (and likely useless) to depict the soil moisture spatial distribution at all stations at a given instantaneous time. This result may be attributed to the contrast between in situ
measurements, which provide point-scale measurements under very different conditions at each location, and the large footprint of the radiometer observations.
ACKNOWLEDGEMENTS
This work was supported by the Spanish Ministry of Economy and Competitiveness (Project AYA2012-39356-C05). The authors acknowledge the European Space Agency (Project AO-3230) and the SMOS Barcelona Expert Centre for providing the data. Authors also thank the Itacyl (Agriculture Technological Institute of Castilla y León, Spain), and particularly Javier Antolín who leads the Inforiego data services. Ángela Gumuzzio acknowledges support from the FPI grant BES-2011-050439.
REFERENCES
products using global ground-based in situ observations.
Remote Sensing of Environment, 118, 215-226
Bircher, S., Skou, N., Jensen, K.H., Walker, J.P., & Rasmussen, L., 2012. A soil moisture and temperature network for SMOS validation in Western Denmark. Hydrology and Earth System Sciences, 16, 1445-1463
Crow, W.T., Berg, A.A., Cosh, M.H., Loew, A., Mohanty, B.P., Panciera, R., de Rosnay, P., Ryu, D., & Walker, J.P., 2012. Upscaling sparse ground-based soil moisture observations for the validation of coarse-resolution satellite soil moisture products. Reviews of Geophysics, 50, RG2002
Dall'Amico, J.T., Schlenz, F., Loew, A., & Mauser, W., 2012. First results of SMOS soil moisture validation in the upper danube catchment. IEEE Transactions on Geoscience and Remote Sensing, 50, 1507-1516
Dente, L., Su, Z., & Wen, J., 2012. Validation of SMOS soil moisture products over the Maqu and Twente Regions. Sensors (Switzerland), 12, 9965-9986
Dorigo, W.A., Wagner, W., Hohensinn, R., Hahn, S., Paulik, C., Xaver, A., Gruber, A., Drusch, M., Meckelenburg, S., van Oevelen, P., Robock, A., & Jackson, T., 2011. The International Soil Moisture Network: a data hosting facility for global in situ soil moisture measurements. Hydrology and Earth System Sciences, 15, 1675-1698
Entekhabi, D., Njoku, E.G., O'Neill, P.E., Kellogg, K.H., T., C.W., Edelstein, W.N., Entin, J.K., Goodman, S.D., Jackson, T.J., Johnson, J., Kimball, J., Piepmeyer, J.R., Koster, R.D., Martin, N., McDonald, K.C., Moghaddam, M., Moran, S., Reichle, R., Shi, J.C., Spencer, M.W., Thurman, S.W., Tsang, L., & Van Zyl, J. (2010). The Soil Moisture Active Passive (SMAP) Mission. Proceedings of the IEEE, 98, 704-716
Jackson, T.J., Bindlish, R., Cosh, M.H., Zhao, T., Starks, P.J., Bosch, D.D., Seyfried, M., Moran, M.S., Goodrich, D.C., Kerr, Y.H., & Leroux, D., 2012. Validation of soil moisture and Ocean Salinity (SMOS) soil moisture over watershed networks in the U.S. IEEE Transactions on Geoscience and Remote Sensing, 50, 1530-1543
Kerr, Y., Waldteufel, P., Wigneron, J.-P., Delwart, S., Cabot, F., Boutin, J., Escorihuela, M.-J., Font, J., Reul, N., Gruhier, C., Juglea, S., Drinkwater, M., Hahne, A., Martín-Neira, M., & Meckelenburg, S., 2010. The SMOS Mission: New Tool for Monitoring Key Elements of the Global Water Cycle.
Proceedings of the IEEE, 98, 666-687
Kerr, Y.H., Waldteufel, P., Richaume, P., Wigneron, J.P., Ferrazzoli, P., Mahmoodi, A., Al Bitar, A., Cabot, F., Gruhier, C., Juglea, S.E., Leroux, D., Mialon, A., & Delwart, S., 2012. The SMOS soil moisture retrieval algorithm. IEEE Transactions on Geoscience and Remote Sensing, 50,
1384-1403
Lagerloef, G., Raul Colomb, F., le Vine, D., Wentz, F., Yueh, S., Ruf, C., Lilly, J., Gunn, J., Chao, Y., deCharon, A., Feldman, G., & Swift, C., 2008. The Aquarius/SAC-D mission: Designed to meet the salinity remote-sensing challenge.
Oceanography, 21, 68-81
Merlin, O., Escorihuela, M.J., Mayoral, M.A., Hagolle, O., Al Bitar, A., & Kerr, Y., 2013. Self-calibrated evaporation-based disaggregation of SMOS soil moisture: An evaluation study at 3 km and 100 m resolution in Catalunya, Spain. Remote Sensing of Environment, 130, 25-38
Panciera, R., 2009. Effect of land surface heterogeneity on satellite near-surface soil moisture observations. PhD thesis.
Department of Civil and Environmental Engineering: The
University of Melbourne, Australia
Piles, M., Sanchez, N., Vall-llossera, M., Camps, A., Martínez-Fernández, J., Martínez, J., & González-Gambau, V., 2014. A dowscaling approach for SMOS land observations: long-term evaluation of high resolution soil moisture maps over the Iberian Peninsula. IEEE Journal of Selected Topics in Applied Earth Observations and Remote Sensing, 7, 3845-3857
Sánchez, N., Martinez-Fernandez, J., Scaini, A., & Perez-Gutierrez, C., 2012. Validation of the SMOS L2 Soil Moisture Data in the REMEDHUS Network (Spain). IEEE Transactions on Geoscience and Remote Sensing, 50, 1602-1611
Sánchez-Ruiz, S., Piles, M., Sánchez, N., Martínez-Fernández, J., Vall-llossera, M., & Camps, A., 2014. Combining SMOS with visible and near/shortwave/thermal infrared satellite data for high resolution soil moisture estimates. Journal of Hydrology, 516, 273-283