RANGE AND PANORAMIC IMAGE FUSION INTO A TEXTURED RANGE IMAGE
FOR CULTURE HERITAGE DOCUMENTATION
Z. Bila a *, J. Reznicek b, K. Pavelka c
Dept. of Mapping and Cartography, Civil Engineering Faculty, Czech Technical University in Prague Thakurova 7, 166 29 Prague 6, Czech Republic
[email protected] a, [email protected] b, [email protected] c
KEY WORDS: Culture heritage, Photogrammetry, Range image, Panoramic image, Sensor fusion, 3D scanner
ABSTRACT:
This paper deals with a fusion of range and panoramic images, where the range image is acquired by a 3D laser scanner and the panoramic image is acquired with a digital still camera mounted on a panoramic head and tripod. The fused resulting dataset, called “textured range image”, provides more reliable information about the investigated object for conservators and historians, than using both datasets separately. A simple example of fusion of a range and panoramic images, both obtained in St. Francis Xavier Church in town Opařany, is given here. Firstly, we describe the process of data acquisition, then the processing of both datasets into a proper format for following fusion and the process of fusion. The process of fusion can be divided into a two main parts: transformation and remapping. In the first, transformation, part, both images are related by matching similar features detected on both images with a proper detector, which results in transformation matrix enabling transformation of the range image onto a panoramic image. Then, the range data are remapped from the range image space into a panoramic image space and stored as an additional “range” channel. The process of image fusion is validated by comparing similar features extracted on both datasets.
1. INTRODUCTION
Today, there exist several methods for the purpose of visualisation and documentation of the culture heritage (Koska et al., 2013; Křemen et al., 2011; Musílek et al., 2001; Pavelka et al., 2008). Each of these methods provides the opportunity to document an investigated object in a different way. The most often used techniques for culture heritage documentation include all kinds of photogrammetric methods (ortho-images, stereo, 3D models), 3D laser scanning and also the panoramic photography. The last mentioned method can be with advantage combined with the 3D point cloud acquired with the 3D laser scanner and hence provide a new form of dataset – textured range image, which has several advantages. In this paper the fusion process of range and panoramic images is described. The paper is divided into several sections which deal with the mentioned methods and with the process of the texture image creation. Data which we had available were obtained in the Baroque church of St. Francis Xavier in Opařany.
1.1 Object of Interest
The St. Francis Xavier Church is situated in the southern part of a small town of Opařany. It was built in 1732–1735 and replaced the original church which was placed on the site of an earlier fort. The author of the new rebuilding plan was Kilian Ignaz Dientzenhofer, the most important Bohemian architect of the late Baroque era.
The interiors of the church are very rich decorated with several Baroque sculptures and frescos. The most dominant decoration is the vault fresco by Josef Kramolín, a Bohemian painter. This church was included into the system of State monument care of the Ministry of Culture of the Czech Republic in a programme so-called Architectural Heritage Rescue Programme.
1.2 Literature Review
The issue of the fusion of range and camera images has been discussed by different authors (Scheibe et al., 2004; Klette et al., 2005; Reulke et al., 2003; Kern, 2001. Several papers (Scheibe et al., 2004; Klette et al., 2005) describe an algorithm which solves a fusion of laser scanning dataset with images of a rotating CCD line camera. An extensive 3D point cloud generated from several laser range finders datasets is textured with several panoramic images. The transformation of both types of data into the world coordinate system is also mentioned. A geometric relation between the images and the point cloud is also discussed in (Kern, 2001). A combination of photogrammetric and laser scanning systems for the purpose of a complex object modelling is described in that paper as well. To acquire the data, system Callidus with an integrated video camera is used. The fusion of data obtained with the digital 360° camera EYSCAN and a laser scanner are mentioned in (Reulke et al., 2003). The basic principles of image fusion are also described in (El-Hakim, 2003; Yang et al., 2011).
* Corresponding author.
2. DATA ACQUISITION FOR RANGE IMAGE
2.1 Acquisition Device
The interior of the church was scanned with a “time of flight” type laser scanner Callidus 1.1 with a range uncertainty 5 mm @ 32 m (according to the manufacturer specifications). The resolution was set to 0.25 degrees in vertical and also horizontal direction, which takes approximately 15 minutes of scanning in a full panoramic mode. The scanner was positioned approximately (± 1 m) to the same place where the digital camera mounted on a panoramic head and tripod was before.
2.2 Range Image Creation
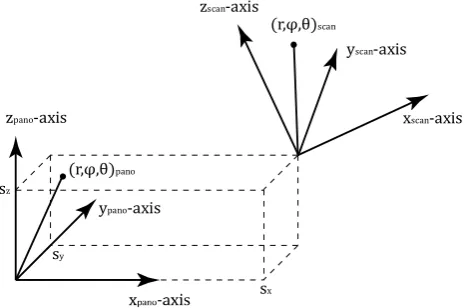
Here, we will describe the method of converting measured xyz point cloud in Cartesian coordinate system into the same type of coordinate system as panoramic image has, which is spherical coordinate system (see Figure 1 and Figure 2). The measured data can be exported to a various formats suitable for 3D applications but we will use a simple ASCII format with three columns ( , , ) which we then project to a 2D range image shown in Figure 1. The 2D range image will be generated as a projection of 3D point cloud in Cartesian coordinate system into a spherical coordinate system. The point cloud is in the Euclidean local coordinate system having the origin coincident with the center of a rotating mirror used for laser beam directing and z-axis heading to the nadir. The origin of the range image spherical coordinate system is in the upper left corner of the image. The x-axis has a right direction from the center, while the y-axis goes down to the bottom of the image. x-axes represents the azimuthal angle , while the y-axes represents the polar angle . The transformation relations between both systems are as follows (see Figure 2):
2 12 0 (1) generally do not match the exact centre of the pixel, we have to interpolate the proper value. The simplest possibility is to round the values to an integer, which is the method of the nearest neighbour. A more proper method consists of triangulating the point cloud, removing long triangles and triangles with improper incident angle and interpolating each centre of pixel by computing the intersection of the ray and proper triangle of the net. The ray vector is defined by location of the pixel ( , ) in spherical coordinate system. Cartesian
coordinates of the ray vector can be simply computed using trivial relations (see Figure 2). This method of interpolation is linear. Since the ray-triangle intersection, called also “collision detection” is time consuming process, some kind of octree structure of triangulated point cloud is needed.
Figure 1. Range image in scanner local spherical coordinate sys.
Figure 2. Relations between Cartesian and spherical coordinate systems.
3. DATA ACQUISITION FOR PANORAMIC IMAGE
The second type of our dataset used for image fusion is a panoramic image of the interior of the St. Francis Xavier Church. The panoramic image consists of several individual images which are stitched together by appropriate software.
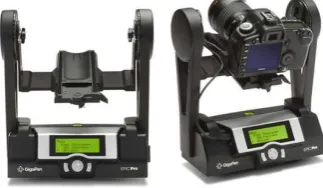
3.1 Acquisition Device – GigaPan Epic Pro
GigaPan Epic Pro is a unique robotic camera mount invented by the GigaPan Systems Company. This version of a panoramic head, which is shown in Figure 3, is especially intended for DSLR (digital single lens reflex) cameras and provides wide range of motion – 360° in horizontal direction with a –65°/ +90° tilt. The range of motion enables image capturing for almost spherical panorama. This is very useful for interior documentation. GigaPan Epic Pro provides many of setting possibilities including an actual field of view, time per picture, pictures order or overlap size. Moreover, it is able to capture
3.2 Acquisition of the Images
Our intention was to capture almost the whole spherical panorama of the interior of the church. The tripod with panoramic head and the DSLR camera were placed in the centre of the nave of the church. All images were taken with a Canon EOS 20D digital camera with the parameters shown in Table 1.
Focal length 22 mm
Aperture F 11.0
ISO 200
Exposure time 1/8 sec
Table 1. Camera parameters during the image acquisition
Altogether, 96 images were taken with a 40 % of overlap. The most important thing, which cannot be neglected, is the precision of the position setting of the camera on the GigaPan device. The lens input pupil should be placed in the center of rotation of panoramic head to avoid parallax which causes unwanted discontinuities. The elimination of the parallax is very important in the case of very close objects.
3.3 Panoramic Image Creation
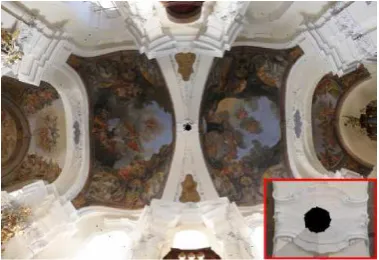
Next step is creation of a panoramic image. It can be done in many specialized software. Each software differs from others in used algorithm. As it was mentioned in (Salemi et al., 2005) the main difference is not in the result but in the processing time. The GigaPan Systems Company developed its own GigaPan Stitched software. This software enables to browse through the spherical panorama, it can be rotated and zoomed but the output is only a panorama where the top and the bottom side correspond with the settings of panoramic head. One of the disadvantages of this software is that it is not possible to set the centre of the resulted panorama. So in the case in which the centre of the panorama is required to be the centre of the vault it is then impossible to do it. The other disadvantage – a hole which is caused by faulty stitched row of upper images – appears when the panorama has to be rotated in the software. This problem is displayed in the Figure 4.
Figure 4. Faulty stitched panoramic image with GigaPan Software
Many of other software aimed at images stitching have been developed, for example Microsoft Image Composite Editor, PTGui, Panorama Plus and Hugin. The last mentioned software is based on an open-source library PanoTools and enables the user to influence any step of stitching process. In our case the Microsoft ICE was used as alternative solution. This software belongs under the Microsoft research department. It gives us satisfying results, full stitched panorama (without any hole) and it enables the setting of the central position of the panorama and
also the possibility to select the final projection. An example of full stitched panorama is shown in Figure 5. The drawback can be seen in the inability of editing matching points so the result cannot be manually controlled. So, in case it is necessary to edit control points, Hugin software seems to be very suitable solution.
Figure 5. Panoramic image from Microsoft ICE
The resulted panoramic image can be seen in the Figure 6. It is almost the full spherical panorama with only the space under the tripod missing. Unfortunately, due to the security policy of this church, which states that no inventory inside the church can be publicly shown, we had to blur the inventory.
Figure 6. Panoramic image of the St. Francis Xavier Church
4. RANGE AND PANORAMIC IMAGE FUSION
The process of fusion can be divided into two main parts: transformation and remapping. In the first, transformation, part, both images are related by matching similar features detected on both images with a proper detector, which results in transformation matrix enabling transformation of the range image onto a panoramic image. Then, the range data are remapped from the range image space into a panoramic image space and stored as an additional “range” channel. The process of image fusion is validated by comparing similar features extracted on both datasets.
4.1 Transformation
Because the scanner local coordinate system has a different position in space than the coordinate system of panoramic image (see Figure 7), the range image cannot be simply overlaid on the panoramic image. For that reason, we have to transform the 3D point cloud to the coordinate system of panoramic image before generating a range image and before the fusing process can be done. Therefore, we have to estimate the parameters of a Euclidean transformation (translation and rotation). The relation of both coordinate systems can be expressed with using Euclidean transformation as:
00123 4 ∙ 06712 (5)
Figure 7. Relations between scanner and panoramic spherical coordinate systems.
The observation equations can be then expressed as:
9 := 2 − B B 9 :
and where (according to previous relation 5):
9 := + "+ >+ ? transformation vectors) for the parameters of the rotation ??:
" + " ""+ > ">= 0 elements with constraints (Fan, 2003), where the observation equations are (8), (9) and (10), the constrains are (13) and (14), the unknown parameters are ?? and ?, @, A, the observations are 9 :, 9 : and the feature points E6712. Inasmuch as the location of the scan coordinate system is very close to the panoramic coordinate system, the approximate unknown parameters DF can be set elementarily. The solution is briefly
where:
Q = ZQ"ZM+ Q (18)
where L is the matrix of partial derivative of observation equations according to the unknowns, L? is the matrix of partial derivative of constrain equations according to the unknowns, P is the vector of differences between observations 9 :, 9 : and observation equation function with approximate values of unknowns. G is the vector of constrain misclosures computed by using approximate values of unknowns. I denotes the Lagrangian multipliers. Q is the covariance matrix of panoramic image coordinates ( 9 :, 9 :), Q" is the covariance matrix of scan Cartesian coordinates (E6712) and Z is the matrix of partial derivative of observation equations according to the scan Cartesian coordinates (E6712).
As can be seen from equation (18), the tightness of the control points (features) can be set by changing the weights in covariance matrix of either observed panoramic image coordinates or observed scan Cartesian coordinates.
4.2 Feature Detection
The most reliable features, that are visible on both images, were manually marked on both images. The placement of the features is visible in Figure 9. These features were used as input observations for estimation of the transformation parameters.
4.3 Remapping
Now, when we estimated the transformation parameters between the scan and panoramic coordinate systems, we can transform the point cloud and generate the new range image, which will have the same spherical coordinate system as the panoramic image has and can be therefore added as an additional channel of the panoramic image which will finish the fusion process.
4.4 Validation of the fusion accuracy
The accuracy of the fusion process will be validated by using statistical results from estimation. 45 feature points were used overall. The a priori standard deviation of the image coordinate measurements (on panoramic image) [0123 was set to 0.25 degrees in both axes (approximately 3.5 pixels on a panoramic image of size 5000 × 2500 pixels). The a priori standard deviation of the 3D coordinate measurements (on a point cloud)
[6712 was set to 30 mm in all axes. The a priori standard error of unit weight [\10] was set to 0.25 degrees. The a posteriori standard error of unit weight [\103 was estimated to 0.23 degrees, which makes error of about 41 mm in space in the range of 10 meters. This is approximately what we expected. The estimated residuals of image coordinates measured on panoramic image are shown in Figure 9.
5. CONCLUSION AND FUTURE WORK
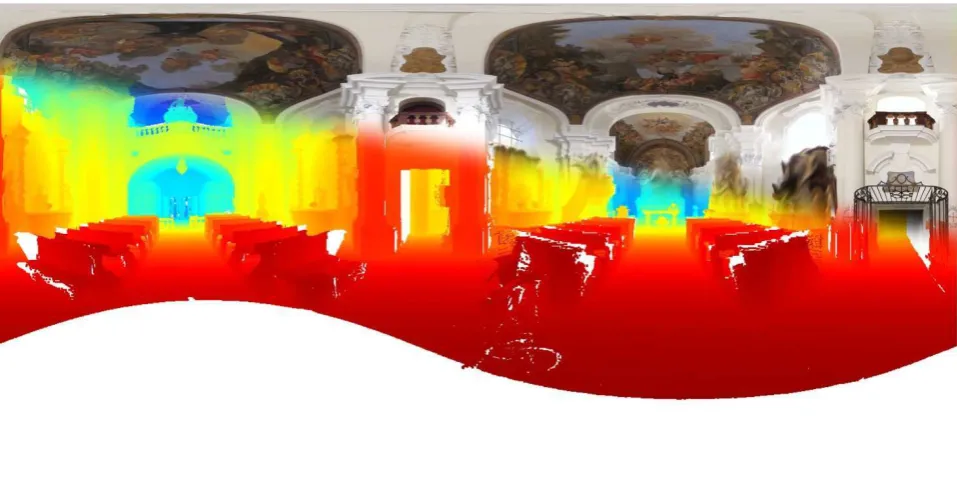
In this paper two different techniques for culture heritage documentation were presented – panoramic image and range image. The fused resulting dataset, called “textured range image” shown in Figure 8, provides more reliable information about an investigated object for conservators and historians, than using both datasets separately. The estimated standard
deviation of image coordinates is 0.23 degrees, which is in 2001. The Laboratory of Quantitative Methods in Historic Monument Research at the CTU Prague. In: Radiation Physics and Chemistry. Vol. 61, no. 3-6, pp.725-727, ISSN 0969-806X.
Pavelka, K.; Tollingerová, D, 2008. Creating of Digital Surface Model and Orthophoto from ASTER Satellite Data and their Application in Land/Water Research. In: Soil and Water Research. Vol. 2, no. 3, pp. 52-61, ISSN 1801-5395.
Yang, M. Y; Cao, Y.;McDonald, J., 2011, Fusion of camera images and laser scans for wide baseline 3D scene alignment in urban environments, ISPRS Journal of Photogrammetry and Remote Sensing, Volume 66, Issue 6, pp. S52-S61.
References from Books:
Fan, H., 2003. Theory of Errors and Least Square Adjustment. Lecture Notes, Division of Geodesy Report No. 2015, Royal Institute of Technology, Department of Geodesy and Photogrammetry, Universitetsservice US AB, Stockholm, Sweden, ISBN 94-7170-200-8
References from Other Literature:
El-Hakim, S. F.; Beraldin, J.-A.; Picard, M.; Vettore, A., 2003. Effective 3D Modeling Of Heritage Sites. Proc. 3DIM 2003, Banff, Canada, pp. 302-309.
Kern, F., 2001. Supplementing laser scanner geometric data with photogrammetric images for modelling. In: XVIII. International CIPA Symposium, Potsdam, German, pp.454–461.
Klette, R.; Scheibe K., 2005. Combinations of Range Data and Panoramic Images – New opportunities in 3D Scene Modeling. CGIV '05 Proceedings of the International Conference on Computer Graphics, Imaging and Visualization, pp. 3-10.
Koska, B.; Křemen, T., 2013. The Combination of Laser Scanning and Structure from Motion Technology for Creation of Accurate Exterior and Interior Orthophotos of St. Nicholas Baroque Church. Int. Arch. Photogramm. Remote Sens. Spatial Inf. Sci., XL-5/W1, 133-138, doi:10.5194/isprsarchives-XL-5-W1-133-2013.
Křemen, T.; Koska, B.; Pospíšil, J., 2011. Laserscanning for Castle Documentation. In: Proceedings of the 23rd CIPA Symposium. Prague, pp. 1-8. ISBN 978-80-01-04885-6.
Reulke, R.; Wehr, A., 2003. Fusion of digital panoramic camera with laser scanner data. Optical 3-D Measurement Techniques, Vol. II, A. Grün and H. Kahmen (Eds.), Zurich, Switzerland, pp. 142 – 149.
Salemi, G.; Achilli V.; Bragagnolo D.; Menin A.; Ru, F., 2005. Data fusion for cultural heritage documentation: from the panoramic paging to 3D laser scanning. In: XX. International CIPA Symposium, Torino, Italy, pp. 511 – 516.
Scheibe, K.; Scheele, M.; Klette, R., 2004. Data fusion and visualization of panoramic images and laser scans. Proceedings of the ISPRS working group V/1, Panoramic Photogrammetry Workshop, Vol. XXXIV, Part 5/W16.
Figure 8. Fused image. The transformed range image has been overlaid over the panoramic image and diagonally cropped in order to visually show the correctness of the estimation of transformation parameters.
Figure 9. Estimated residuals (green arrow) between image coordinates of the features in panoramic coordinate system (red circle) and adjusted value of the features (green arrowhead) after adjustment. The real value of estimated residuals is very small and was
therefore scaled to 1:50. The visual examination of residual vectors does not indicate systematic error.