EXTRACTION OF COASTLINES WITH FUZZY APPROACH
USING SENTINEL-1 SAR IMAGE
N.Demir a,b*, M.Kaynarcaa, S.Oya a
Akdeniz University, Dept.of Space Science and Technologies b
Akdeniz University, Remote Sensing Research and Application Center 07058 Antalya- Turkey
[email protected], (mustafakaynarca78, selenoy171)@gmail.com
Commission VII, WG VII/7
KEY WORDS: SAR, coastline, fuzzy, LIDAR, classification, SENTINEL-1
ABSTRACT:
Coastlines are important features for water resources, sea products, energy resources etc. Coastlines are changed dynamically, thus automated methods are necessary for analysing and detecting the changes along the coastlines. In this study, Sentinel-1 C band SAR image has been used to extract the coastline with fuzzy logic approach. The used SAR image has VH polarisation and 10x10m. spatial resolution, covers 57 sqkm area from the south-east of Puerto-Rico. Additionally, radiometric calibration is applied to reduce atmospheric and orbit error, and speckle filter is used to reduce the noise. Then the image is terrain-corrected using SRTM digital surface model. Classification of SAR image is a challenging task since SAR and optical sensors have very different properties. Even between different bands of the SAR sensors, the images look very different. So, the classification of SAR image is difficult with the traditional unsupervised methods. In this study, a fuzzy approach has been applied to distinguish the coastal pixels than the land surface pixels. The standard deviation and the mean, median values are calculated to use as parameters in fuzzy approach. The Mean-standard-deviation (MS) Large membership function is used because the large amounts of land and ocean pixels dominate the SAR image with large mean and standard deviation values. The pixel values are multiplied with 1000 to easify the calculations. The mean is calculated as 23 and the standard deviation is calculated as 12 for the whole image. The multiplier parameters are selected as a: 0.58, b: 0.05 to maximize the land surface membership. The result is evaluated using airborne LIDAR data, only for the areas where LIDAR dataset is available and secondly manually digitized coastline. The laser points which are below 0,5 m are classified as the ocean points. The 3D alpha-shapes algorithm is used to detect the coastline points from LIDAR data. Minimum distances are calculated between the LIDAR points of coastline with the extracted coastline. The statistics of the distances are calculated as following; the mean is 5.82m, standard deviation is 5.83m and the median value is 4.08 m. Secondly, the extracted coastline is also evaluated with manually created lines on SAR image. Both lines are converted to dense points with 1 m interval. Then the closest distances are calculated between the points from extracted coastline and manually created coastline. The mean is 5.23m, standard deviation is 4.52m. and the median value is 4.13m for the calculated distances. The evaluation values are within the accuracy of used SAR data for both quality assessment approaches.
*
Corresponding author
1. INTRODUCTION
There are many studies regarding extraction of coastlines from SAR data in recent years. Descombes et al. ( 1996) proposed a hierarchical approach by implementing Markov Random Fields (MRFs) to decrease the drawbacks of the coarse resolution on a holes topology using speckled SAR image. Dellepiane et al. (2004) extracts the coastlines with use of fuzzy connectivity concepts with considering coherence measure from Interferometric Synthetic Aperture Radar (InSAR) pair. Elaksher (2008) developed a novel technique for coastal mapping by using LIDAR-based digital elevation model (DEM) and the laser point cloud with optical images. Al Fugura et al. (2011) propose a semi-automated technique for shoreline delineation from RADARSAT-1 image. They apply average filter to reduce random noise on ocean surface, particularly near the shoreline. Acar et.al. (2012) develop an algorithm that can extract coastlines automatically by using SAR images using
fit-coast algorithm. They evaluated the results with manual measurements.
Lee and Jurkevich ( 1990) tried to extract coastlines by using an edge-tracing method from low- resolution Synthetic Aperture Radar (SAR) images with resulting rough coastlines.
Liu et al.(2016) combine the modified K-means method and adaptive object-based region-merging mechanism (MKAORM) from wide-swath Synthetic Aperture Radar (SAR) images to extract the coastlines. Niedermeier et al. (2000) propose implementation of wavelet and active contour methods to delineate a coastline. One of the biggest advantages of the approach is continuously monitor and update the topography of large areas. Baselice and Ferraioli (2013)offer an unsupervised method which is based on the estimation of the spatial correlation between neighbor pixels. The method operates to Bayesian stochastic estimation as well as Markov random frameworks. Buono et al. (2014) used the Improved Integral Equation Method (IIEM). The method is very effective and accurate, when wind is low to moderate. Nunziata et al. (2014) The International Archives of the Photogrammetry, Remote Sensing and Spatial Information Sciences, Volume XLI-B7, 2016
proposed two steps procedure to extract a coastline from SAR data acquired in a dual-polarization HH/VV PingPong mode. Schmitt et al. (2015) developed an automatic technique for coastline detection by implementing the active contours algorithm. Yang et al. (2014) proposed a semi-automatic coastline extraction method by running Interferometry SAR (InSAR) or SAR interferometry (SARIF) method. Ding et al. (2014) experienced to coastline detection based on multiscale normalized cut segmentation from SAR images. Results of the method were compared with Nunziata et al. (2014) and discrepancy between this two is slightly small. Additionally, the whole process was lunched in around 25 minutes on basic computer. Qu (2013) proposed a method based upon the nature of water regions. This approach run multiscale wavelet-based despeckling and support vector machine (SVM). Asaka et al. (2013) developed an automated method for tracing shorelines in L-band SAR images with three steps. These steps were detection of shoreline edge detection; masking of unwanted edges; and automated shoreline tracing. Their algorithms implemented edge detection methods. Paes et al. (2015) presented a method by using k-means clustering algorithm and
Canny edge detection filter.
In this study, Sentinel-1 C band SAR image has been used to extract the coastline with fuzzy unsupervised approach.
2. USED DATA
The used data is from Puerto Rico can be seen in Figure 1. The test site is chosen from the southeast coast of the island, where SAR and partly LIDAR data are available.
Figure 1. Test site
The used SAR data is Sentinel-1 Image Level 1 GRD product, which has following properties in Table 1.
Table 1. Properties of SAR image
Polarisation: VH
Radiometric Accuracy: 1 db
Range and Azimuth Spacing: 10 m
Polarisation: VV
For evaluation of the result, airborne LIDAR dataset is used. The LIDAR data is provided from opentopography.org.
The used SAR image is shown in the following Figure 2.
Figure 2. Used SAR data
3. METHOD
The method consist of five processing steps, pre-processing, classification and post-processing.
The detailed processing workflow is found in Figure 3.
Figure 3. Processing workflow
Processing is consisting of cropping of the original image and terrain correction plus speckle reduction. Classification refers to the fuzzy clustering using mean standard deviation method. The post-processing includes the morphological filter which refines the classification with following raster vector conversion, simplification progress. To evaluate the results, two additional data have been used. One is manually created coastline using the original image. The second dataset is airborne LIDAR data.
3.1.Pre-processing of SENTINEL-1 Image
SAR images have big amount of speckle and they have to be removed. Sentinel Toolbox which developed by ESA, is used to remove the speckles, and also for terrain correction of the imagery. The used DEM is 30 m elevation model from ASTER.
3.2.Classification of SAR Image
Classification of SAR image is a challenging task since SAR has different characteristics than the optical image datasets. SAR images have much noise and intensities are highly depending on the surface geometries of the targets. In this work, we follow fuzzy membership clustering with applying Mean-Standard Deviation fuzzy membership function. To define the type of the membership functions, the target classes have to be taken into the account.
There are several functions which are applied for calculating fuzzy memberships. Gaussian, Large, Linear, Mean-standard-The International Archives of the Photogrammetry, Remote Sensing and Spatial Information Sciences, Volume XLI-B7, 2016
deviation small, MSLarge, Near, Small are some of these functions.
Linear function has a linear increasing or decreasing membership between two inputs. Function Large has Sigmoid shape where large inputs have large membership. MSLarge has Sigmoid shape defined by the mean and standard deviation where large inputs have large memberships. MSLarge has Sigmoid shape defined by the mean and standard deviation, where small inputs have large memberships (ESRI guide). The membership is calculated using the following formula;
μ(x)=1-(bs/(am+bs) if x<am else μ (x)=0
where m=mean,s=standard deviation, a and b are user inputs.
In this study, mean-standard-deviation (MS) Large membership function is used because the large amounts of land and ocean pixels dominate the SAR image with large mean and standard deviation values. Here we have two classes, one land, and the other is ocean. The maximisation of land surface class is considered for selection of the multipliers.
3.3.Post-Processing
The classified SAR image is converted to vector form, and then Douglas-Peucker regularisation algorithm is applied to remove the zigzag effects which come from the raster data type.
3.4.Quality Assessment
The assessment is simply done with comparing the reference dataset with the extraction result. For this, the line datasets are converted to the points
The coastline from LIDAR is used for evaluation of the results. First, the laser points are classified with elevation thresholding. The points below 1 m are selected as ocean points, and the other points are from the land class.
The digitizing of the boundary of ocean points are performed using alpha shapes algorithm. The alpha-shapes algorithm is used to reconstruct the boundary from a plane. It has been
developed by Edelsbrunner and Mücke (1994). Since it can extract the outer boundary of the point sets, it is useful for extracting any point cloud cluster. In this algorithm, there is no restriction for the concavity of the shape as Convex-Hull algorithm.
Further, for overall assessment, the coastline is manually digitized on SAR image, and compared with the one from the used method.
4. RESULTS
4.1 Pre-processing
The speckle is reduced using ESA software package Sentinel Toolbox. Further, ASTER DEM is used to apply the terrain correction.
4.2 Classification
MS Fuzzy clustering is applied to classify the land and ocean pixels. The pixel values are multiplied with 1000 to easify the calculations. For estimation of the used parameters The mean is
calculated as 23 and the standard deviation is calculated as 12 for the whole image. The multiplier parameters are selected as a: 0.58, b: 0.05 to maximize the land surface membership (Figure 4).
Figure 4. Fuzzy membership of the land, Dark is low, bright is high membership of the land class.
Applying of the threshold 0.50 will result the clusters of land and sea surfaces as shown in Figure 5.
Figure 5. Extracted clusters, black: water surfaces, green: Land surface
The raster dataset is converted to the vector form, and the zigzag effects come from the raster is eliminated using Douglas-Peucker algorithm. Then, the line with maximum length gives the final coastline result, as demonstrated in Figure 6.
Figure 6. Final results
4.3 Extraction of coastline from LIDAR data.
To define the ocean points, the density map is created using the LIDAR points which below 0.5 m elevation.
The density is calculated per 10 m x 10 m cell, and the magnitude is calculated as total nr of points/ total area of the cell. The density map is shown in the Figure 7.
Figure 7. Density map
Furthermore, Figure 8 illustrates that the cells which has a density value, higher than 3% is selected as ocean region candidates.
Figure 8. Candidate ocean regions, green : ocean, black:Land
As it is shown in Figure 9, applying an area threshold removes the non-ocean regions, and then the points which correspond are selected as the ocean points.
Figure 9. Selected ocean regions
Then, the alpha-shapes algorithm is applied to create the boundary of the points, which is the coastline. This is only applied to where LIDAR dataset is available.
Figure 10. Extracted coastline from LIDAR data (yellow)
The extracted coastline from LIDAR is shown in Figure 10.
4.4. Quality assessment
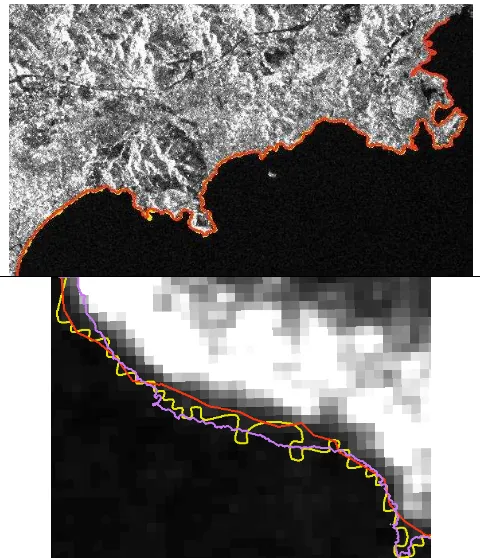
The results are evaluated with the manually created coastline from SAR data and the extracted coastline from LIDAR data, details can be seen in Figure 11. All Datasets are converted to the point features with 20 cm interval, and the distances are calculated between the points from reference and the result coastline.
Figure 11. Comparison of the extracted coastlines with reference data (yellow:SAR, Purple :LIDAR, red: manual digitizing)
Regarding LIDAR reference coastline, the statistics of the distances are calculated as following; the mean is 5.82m, standard deviation is 5.83m and the median value is 4.08 m. Regarding manually created coastline, the mean is 5.23m, standard deviation is 4.52m. and the median value is 4.13m for the calculated distances. The evaluation values are within the accuracy of used SAR data for both quality assessment approaches.
5. CONCLUSIONS
In this study, the coastlines are extracted from SAR and LIDAR data both, and the results are evaluated accordingly. The assessment shows us that Sentinel 1 image has a high potential to derive the coastlines with unsupervised fuzzy clustering method. So, the lower resolution SAR image has similar capability to extract the coastline comparing to high resolution LIDAR dataset.
ACKNOWLEDGEMENT
The authors would like to thank ESA and opentopography.org for providing the free SAR and LIDAR datasets.
REFERENCES
Acar, U., Bayram, B., Sanli, F. B., Abdikan, S., Sunar, F., & Cetin, H. I. ,2012. An algorithm for coastline detection
using SAR images. In: International Archives of the
Photogrammetry, Remote Sensing and Spatial Information Sciences, Melbourne, Australia, vol. XXXIX, Part B3, pp. 457-460.
Al Fugura, A., Billa, L., & Pradhan, B. ,2011. Semi-automated procedures for shoreline extraction using single
RADARSAT-1 SAR image. Estuarine, Coastal and Shelf
Science, 95(4), pp. 395-400.
Asaka, T., Yamamoto, Y., Aoyama, S., Iwashita, K., & Kudou, K. ,2013. Automated method for tracing shorelines in
L-band SAR images. In: 2013 Asia-Pacific Conference on
Synthetic Aperture Radar (APSAR), Tsukuba, Japan, pp. 325-328.
Baselice, F. & Ferraioli, G., 2013. Unsupervised coastal line
extraction from SAR images. IEEE Geoscience and
Remote Sensing Letters, 10(6), pp. 1350-1354.
Buono, A., Nunziata, F., Mascolo, L., & Migliaccio, M. ,2014. A multipolarization analysis of coastline extraction using
X-band COSMO-SkyMed SAR data. IEEE Journal of
Selected Topics in Applied Earth Observations and Remote Sensing,7(7), pp. 2811-2820.
Dellepiane, S., De Laurentiis, R., & Giordano, F. ,2004. Coastline extraction from SAR images and a method for
the evaluation of the coastline precision.Pattern
Recognition Letters, 25(13), pp. 1461-1470.
Descombes, X., Moctezuma, M., Maître, H., & Rudant, J. P.
,1996. Coastline detection by a Markovian segmentation
on SAR images. Signal Processing, 55(1), pp. 123-132.
Ding, X., Li, X. ,2014. Coastline detection in SAR images
using multiscale normalized cut segmentation. In: 2014
IEEE International Geoscience and Remote Sensing Symposium (IGARSS), Quebec City, Canada, pp. 4447-4449.
Edelsbrunner, H., & Mücke, E. P. ,1994. Three-dimensional
alpha shapes.ACM Transactions on Graphics
(TOG), 13(1), pp. 43-72.
Elaksher, A. F. ,2008. Fusion of hyperspectral images and
lidar-based dems for coastal mapping. Optics and Lasers in
Engineering, 46(7), pp. 493-498.
Lee, J. S., & Jurkevich, I. ,1990. Coastline detection and tracing
in SAR images. IEEE Transactions on Geoscience and
Remote Sensing, 28(4), pp. 662-668.
Liu, Z., Li, F., Li, N., Wang, R., & Zhang, H. ,2016. A Novel Region-Merging Approach for Coastline Extraction From
Sentinel-1A IW Mode SAR Imagery. IEEE Geoscience
and Remote Sensing Letters, 13(3), pp. 324-328.
Niedermeier, A., Romaneessen, E., & Lehner, S. ,2000. Detection of coastlines in SAR images using wavelet
methods. IEEE Transactions on Geoscience and Remote
Sensing, 38(5), pp. 2270-2281.
Nunziata, F., Migliaccio, M., Li, X., & Ding, X. ,2014. Coastline extraction using dual-polarimetric
COSMO-SkyMed PingPong mode SAR data. IEEE Geoscience
and Remote Sensing Letters,11(1), pp. 104-108.
Paes, R. L., Nunziata, F., & Migliaccio, M. ,2015. Coastline extraction and coastal area classification via SAR
hybrid-polarimetry architecture. In: 2015 IEEE
InternationalGeoscience and Remote Sensing Symposium (IGARSS), Milan, Italy,pp. 3798-3801.
Qu, G., Yu, Q., & Wang, Y. ,2013. An improved method for SAR image coastline detection based on despeckling and
SVM. In: IET International Radar Conference 2013,
Xi’an, China,pp. 1-6.
Schmitt, M., Wei, L., & Zhu, X. X. ,2015. Automatic coastline
detection in non-locally filtered tandem-X data. In: 2015
IEEE InternationalGeoscience and Remote Sensing Symposium (IGARSS), Milan, Italy, pp. 1036-1039.
Yang, H., Lee, D. G., Kim, T. H., Sumantyo, J. T. S., & Kim, J. H. ,2014. Semi-automatic coastline extraction method
using Synthetic Aperture Radar images. In: 2014 16th
International Conference onAdvanced Communication Technology (ICACT), PyeongChang, Korea(South),pp. 678-681.