AN EMPRICAL POINT ERROR MODEL FOR TLS DERIVED POINT CLOUDS
Mustafa Ozendi a *, Devrim Akca b, Hüseyin Topan a
a BEU, Department of Geomatics Engineering, 67100 Zonguldak, Turkey – (mustafa.ozendi, topan)@beun.edu.tr b ISIK University, Department of Civil Engineering, 34980 Sile, Istanbul, Turkey – [email protected]
Commission V, WG V/3
KEY WORDS: TLS, reflectance, incidence angle, range, error ellipsoid, anisotropic, error model
ABSTRACT:
The random error pattern of point clouds has significant effect on the quality of final 3D model. The magnitude and distribution of random errors should be modelled numerically. This work aims at developing such an anisotropic point error model, specifically for the terrestrial laser scanner (TLS) acquired 3D point clouds. A priori precisions of basic TLS observations, which are the range, horizontal angle and vertical angle, are determined by predefined and practical measurement configurations, performed at real-world test environments. A priori precision of horizontal �� and vertical �� angles are constant for each point of a data set, and can directly be determined through the repetitive scanning of the same environment. In our practical tests, precisions of the horizontal and vertical angles were found as ��= ± . �� and ��= ± . ��, respectively. On the other hand, a priori precision of the range observation �� is assumed to be a function of range, incidence angle of the incoming laser ray, and reflectivity of object surface. Hence, it is a variable, and computed for each point individually by employing an empirically developed formula varying as ��= ± − �� for a FARO Focus X330 laser scanner. This procedure was followed by the computation of error ellipsoids of each point using the law of variance-covariance propagation. The direction and size of the error ellipsoids were computed by the principal components transformation. The usability and feasibility of the model was investigated in real world scenarios. These investigations validated the suitability and practicality of the proposed method.
1. INTRODUCTION
Even though the Terrestrial Laser Scanning (TLS) technology provides accurate 3D description of a target object or scene, individual points of the 3D point cloud contains random and gross errors. These errors propagate through processing steps such as pre-processing, registration, integration and model generation. This fact evokes the question of how reliable the laser scanning data which is widely used for applications vary from cultural heritage to deformation monitoring.
The question of reliability can be analysed by means of positional uncertainty of individual points. Positional uncertainty of a point mainly depends on object distance, incidence angle of the incoming laser ray and reflectivity of object surface. These dependencies and nature of 3D sensors result in heteroscedastic (point dependent), anisotropic and inhomogeneous point error distribution (Matei and Meer, 1999; Ohta and Kanatani, 1998; Williams et al., 1999). The anisotropic error nature of 3D sensors implies that error budget of each individual point is different. Generating an anisotropic point error model for laser scanning data will put forward the level of confidence for each point and it will be a feasible tool for quality analysis and quality control of final point cloud products.
TLSs simply observe distance or range, horizontal and vertical angle, and amplitude of reflected laser beam or so called intensity. In the past, several efforts have been made concerning error models of the laser scan data. (Williams et al., 1999) proposed an additive error model to improve quality of registration of point clouds by taking advantage of covariance matrix of points. (Guehring, 2001) also used covariance matrix for modelling anisotropic error of a commercial structured light
* Corresponding author
system based upon photogrammetric techniques. In an another study which is covariance matrix based, is presented in (Okatani and Deguchi, 2002) where, only the range measurement error is taken into consideration, angular measurement error is neglected and scan data is corrected depending on variance of each point. Similar assumption is made also in (Sagawa et al., 2002) and (Sagawa et al., 2006). However, the former approach proposes a method which aims to refine data iteratively, similar to ICP algorithm, and the latter approach estimates the uncertainty by determining the precision of range measurement with respect to intensity of the observed light as described in (Sagawa et al., 2005). (Scaioni, 2012) used standard deviation values provided by the manufacturer and computed covariance matrix of each point for stochastic modelling. Effect of incidence angle was modelled in (Soudarissanane et al., 2011) where, it is reported that the incidence angle has cosine effect on the range measurement precision. This contribution is used in the study presented by (Grant et al., 2012) for computation of covariance matrices in addition to instrument’s precision. In a recent study, (Chen et al., 2015) evaluated point cloud accuracy by means of error ellipsoids using instrument’s precision values provided by the manufacturer and the effect of incidence angle introduced by aforementioned study (Soudarissanane et al., 2011). However, reflectivity of object surface is neglected.
surface reflectivity. A priori precisions of basic TLS observations were determined by practical measurement configurations, which were performed at real-world test environments. This procedure was followed by computation of error ellipsoid of each individual point using the law of variance-covariance propagation.
The following section outlines the theoretical background of proposed point error model. Sections 3 and 4 describe determination of a priori angular and range precision, respectively. Section 5 presents the usability and feasibility of the proposed error model and finally, in Section 6, conclusions are reported.
2. ANISOTROPIC POINT ERROR MODEL TLS system operates in spherical coordinate system measuring range (ρ), horizontal (θ) and vertical (α) angles where any point is defined as ��= [ρ, θ, α]�. Most of the current TLSs provide the point cloud data in Cartesian coordinate system, which are computed from spherical coordinates as defined in Equation 1:
[ �� from the Cartesian coordinates as described in following equations: covariance matrix for each �� can be constituted as follows:
∑��= [ ∑�� are zero because it is assumed that the TLS is well-calibrated, measurements are free of systematic errors and free of physical correlation among themselves.
Using the variance and covariance propagation rule, the × covariance matrix ∑ of a point in Cartesian coordinate system is:
∑ = ��∑����� (6)
where, �� is the Jacobian matrix described in Equation 7.
��=
Standard error ellipsoid parameters corresponding to each point can be computed using eigenvalues � = [� � � ] and eigenvectors of ∑ . Semi-axis dimensions [ ] of error ellipsoids can be computed as in Equation 8 and orientation parameters of error ellipsoids can be obtained from eigenvectors.
[ ] = [√� √� √� ] (8)
Determination of a priori precisions (��, ��, ��) required for this model are described in following Section 3 and Section 4.
3. ANGULAR PRECISION DETERMINATION Precisions of the horizontal and vertical angles are determined by means of practical tests performed in near-laboratory conditions. In this study, a Faro Focus 3D x330 scanner was used. This scanner provides different resolution and quality options for scanning. Since maximum and minimum resolution parameters are not practical, only 1/2, 1/4 and 1/8 resolution parameters were used in the experiments. According to the user manual, increasing the quality reduces the noise in the scan data while increasing the scanning time. The effect of quality was investigated using scans performed with all quality options (6x, 4x, 3x, 2x and x) only at 1/4 resolution.
This experiment was conducted for three days. At the first day, the scanner was turned on and after waiting 30 minutes, the test area was scanned at 1/2 resolution, 1/4 resolution with all quality options and 1/8 resolution. For each scan configuration, the test area was scanned six times. Consecutive scans were performed with 5 minutes intervals. At the end of the first day, the scanner stayed at the same position (Scan Position A see Figure 1) during night and at the second day, scanning procedure was repeated as described for the first day. At the end of the second day, the scanner was turned off and encased to its original case. The following day, the same scanning procedure was followed as in the first and second days but this time at a different position (Scan Position B). Such an experiment allows investigation of time effect on angular precision.
Figure 1. Scan stations and selected points
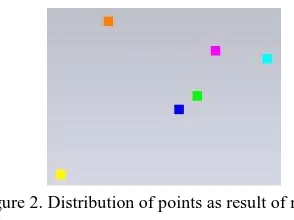
Since it is impossible to make exactly the same measurements, repeated measurements will be distributed around the expected measurement as depicted in Figure 2.
Figure 2. Distribution of points as result of repeated measurements belonging to 1/2 scan resolution
each scan, spherical coordinates ρ, θ, α corresponding to selected points were computed from the Cartesian coordinates , , using Equations 2, 3 and 4. So that, for each point, six repeated ρ, θ, α observations were obtained for each scan configuration. This step was followed by calculation of the horizontal �� and vertical angle RMSE �� using repeated measurements. Similar to Figure 2, the first measurement of each scan configuration was separated from other measurements mostly because of internal temperature of the TLS. In this case, it is strongly suggested for users to perform a void scan to heat up the TLS. Due to this fact, �� and �� were computed for all six repeated measurements and last five measurements excluding the first one. These results are tabulated in Table 1.
6 Repeated Measurements
1/2 Resolution 1/4 Resolution 1/8 Resolution
Point ID �� �� �� �� �� ��
1 40.2cc 27.3cc 66.4cc 16.3cc 153.4cc 31.5cc 2 39.4cc 32.6cc 73.8cc 15.2cc 146.1cc 31.6cc 3 39.1cc 24.2cc 61.8cc 14.5cc 144.7cc 23.5cc 4 38.4cc 26.9cc 75.0cc 13.2cc 147.0cc 26.6cc Average 39.3cc 27.8cc 69.2cc 14.8cc 147.8cc 28.3cc
5 Repeated Measurements
1/2 Resolution 1/4 Resolution 1/8 Resolution
Point ID �� �� �� �� �� ��
1 37.3cc 21.6cc 60.9cc 17.3cc 163.9cc 34.0cc 2 38.8cc 20.9cc 58.3cc 16.1cc 146.7cc 34.3cc 3 32.8cc 13.3cc 56.6cc 14.0cc 152.8cc 24.2cc 4 37.4cc 15.6cc 63.2cc 13.0cc 153.1cc 28.3cc Average 36.6cc 17.8cc 59.8cc 15.1cc 154.1cc 30.2cc
Table 1. Angular precision of TLS
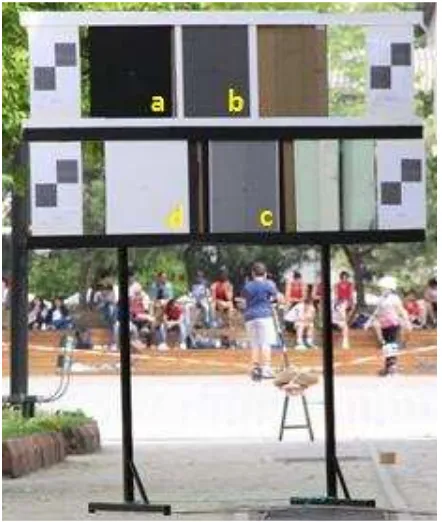
4. RANGE PRECISION DETERMINATION In order to find out range precision �� of the scanner, an outdoor experiment was carried out. For this experiment, a stand was designed as shown in Figure3.
Figure 3. Designed stand of experiment
To investigate the effect of surface reflectivity, four glasses (a, b, c, d) were coated with papers that have different reflectance properties. The stand was placed at distances from the scanner ranging from 5 to 105 m in steps of 10 m. At each step the stand was scanned with 0°, 30° and 45° orientations with respect to the TLS that enables investigation of incidence angle effect on range precision. Experiment was carried out with five minutes breaks between scans to make sure that scanner was stable. As a result of this experiment, a total of 33 scans of the stand were acquired. Scan plan of this experiment is presented in Figure 4.
Figure 4. Scan plan. Red dashed line represents orientation of the designed stand with respect to TLS.
Assuming that coated glasses are exactly planar and distance of each point to the plane is same, the best fitting plane for each coated glass was computed using the least squares solution. In order to compute the best fitting plane, Equation 9 was used.
+ + + = (9)
where , , and represent plane coefficients and , , represents the point which lies on the plane. After computation of coefficients, the distance between each ��ℎ point of the coated glass and Least Square Plane was computed using Equation 10.
�
=
√�+2+�+2+�2+ (10)Figure 5. Variation of Least Square Plane RMSE depending on intensity, range and incidence angle
From Figure 5 it can obviously be observed that �� strongly depends on the distance between the TLS and object, surface reflectivity and incidence angle. Moreover, �� tends to be more discrete for black objects compared to objects with other colors. On the other hand, for dark gray, light gray and white objects �� can be considered as linear and slightly varied.
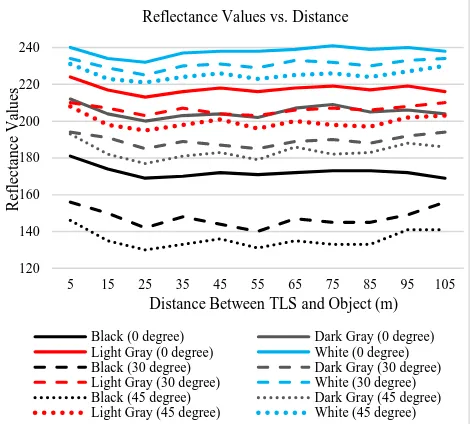
Apart from positional data, TLSs record an additional attribute called intensity for each point. Intensity is generally used for visual improvement of point clouds (Carrea et al., 2016). Intensity can be defined as the power of the backscattered signal from the object. The scanner used in this study does not provide raw intensity values, instead, it provides reflectance values for the user. While intensity strongly depends on the incidence angle and distance, reflectance only depends on the surface properties. Reflectance values obtained for coated glasses are presented in Figure 6.
Figure 6. Mean reflectance values
Taking Figure 6 into consideration, reflectance of black coated glass is more discrete than other objects, which ease classification of black objects.
The point cloud processing software of TLS does not provide raw intensity values as output. It only displays raw values on the screen. Therefore, to investigate the intensity, thirty well distributed points were selected from each coated glass point cloud and their mean values were plotted as shown in Figure 7.
Figure 7. Raw intensity values
Variation of intensity depending incidence angle, distance and surface properties are demonstrated in Figure 7.
4.1 Empirical Model for Range Precision
In the previous section, it was shown that the range precision (��) of a point strongly depends on range (ρ), incidence angle (�) of the incoming laser beam and reflectivity (Ι) of the object surface as shown in Figure 5. Hence, �� is variable for each individual point and can be considered as an empirical function of (ρ, �, Ι). This function has to fulfil the conditions below:
As the range increases, �� decreases.
The wider incidence angle means weaker returned signals. So that, as the incidence angle increases, �� decreases.
Black objects absorb most of the incoming laser beam and detection unit of the TLS will hardly detect the reflected signal. In this case, lower reflectivity will result in lower ��.
Considering these conditions, several empirical models were developed. However, efforts on determining the most suitable one is going on. Because of this reason, the empirical model will be introduced explicitly in forthcoming events
�� was computed with the proposed empirical model using the data of Figure 5 for comparison. The model driven �� values are plotted in Figure 8:
5m 15m 25m 35m 45m 55m 65m 75m 85m 95m 105m
L
Range vs Least Squares Plane RMSE (mm)
Black (0 degree) Dark Gray (0 degree) Light Gray (0 degree) White (0 degree) Black(30 degree) Dark Gray (30 degree) Light Gray (30 degree) White (30 degree) Black (45 degree) Dark Gray (45 degree) Light Gray (45 degree) White (45 degree)
120
Distance Between TLS and Object (m) Reflectance Values vs. Distance
Black (0 degree) Dark Gray (0 degree) Light Gray (0 degree) White (0 degree) Black (30 degree) Dark Gray (30 degree) Light Gray (30 degree) White (30 degree) Black (45 degree) Dark Gray (45 degree) Light Gray (45 degree) White (45 degree)
50
Distance Between TLS and Object (m) Raw Intensity vs. Distance
Figure 8. Model driven σρ values
The empirical model fulfils the conditions mentioned above. σρ
values of black objects tend to be discrete when compared to other objects. And σρ of non-black objects are linear and slightly varied. Also, model driven σρ values are compatible with Least Square Plane RMSE values as visualized in Figure 5. However, σρ values belong to Dark Gray, Light Gray and White objects overlap. This is an expected situation, because the empirical model can only distinguish reflectance values of highly absorbent objects. Moreover, when Figure 5 is taken into consideration, RMSE values belong to Dark Gray, Light Gray and White objects are very close to each other. Hence, the overlapping can be ignored.
5. VALIDATION OF THE PROPOSED POINT ERROR MODEL
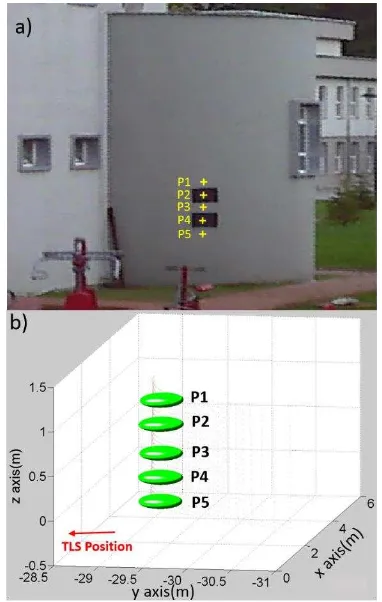
The usability and feasibility of the proposed error model was investigated in real world scenarios. At the first scenario influence of the range and incidence angle was investigated. The test object used for this scenario was a building section. Seven points were selected from this building section and their associated error ellipsoids were plotted in Figure 9.
Figure 9. A building section with varying sensor-to-object distance and incidence angle. Seven points P1 to P7 selected on the object surface (a), and their associated point error ellipsoids,
whose magnitudes are exaggerated by factor 500 are shown (b). Note that (b) is a plan view and the TLS location is depicted at
the lower right corner.
Both sensor-to-object distance and incidence angle increases from P1 to P7. This situation naturally influences dimensions of error ellipsoids. In this scenario, the reflectance value of P1, P3, P5 and P7 are lower than the ones of P2, P4 and P6. However, this difference at reflectance values had no effect on ellipsoids because surfaces corresponding to P1, P3, P5 and P7 are not highly absorbent.
At the second scenario, the test object was a cylindrical building section with various reflectance properties and distance to TLS was almost 30 m. To investigate the effect of reflectance, black papers, which are highly absorbent, were attached on the wall as in Figure 10a. Five points were selected on the object (Figure 10a) and their error ellipsoids were plotted (Figure 10b). Reflectance of P2 and P4 was drastically smaller than other points. Both incidence angle and range of points were almost equal to each other. Due to the fact that black papers are highly absorbent, error ellipsoids of P2 and P4 were more elongated which is an expected situation. When the error ellipsoids of P1, P3 and P4 are compared, there is no significant change in the dimensions because they almost have the same reflectance, range and incidence angle.
Figure 10. Test object and selected points for error ellipsoid plotting (a). Error ellipsoids corresponding to P1-P5 (b).
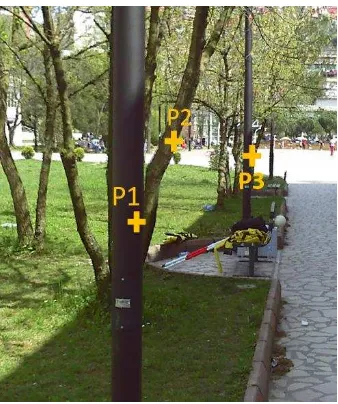
At the last scenario, test objects were lamp poles and a branch of a tree. These objects were intentionally chosen, because the reflectance of lamp poles are very low compared to the tree branch. Three points were selected, P1 and P3 from the lamp poles and P2 was from the branch of a tree. P2 had the smallest incidence angle (≈14°), P1 had the biggest incidence angle (≈40°) and incidence angle of P3 was almost equal to 30°. Test objects and selected points are shown in Figure 11.
0 1 2 3 4 5 6 7 8 9 10
5m 15m 25m 35m 45m 55m 65m 75m 85m 95m 105m
σρ
V
al
u
es
(mm
)
Distance
Model Driven σρValues Against (ρ,�,Ι)
Figure 11. Test objects and selected points P1-P3 for error ellipsoid plotting. P1 and P3 selected from lamp poles, and P2
from branch of tree
Even though P1 is closer than P2 to the TLS, error ellipsoid of P1 is more elongated as illustrated in Figure 12. This is expected because P1 is highly absorbent and its incidence angle is bigger than incidence angle of P2. When P3 is considered, its error ellipsoid elongation is more than that of P2 but less than P1. At the first glance, this situation may be considered unreasonable. However, when incidence angle is taken into account, it is a normal situation because the incidence angle of P1 is bigger than the incidence angle of P3.
Figure 12. Error ellipsoids at plan view associated with P1,P2 and P3. Location of TLS is depicted at lower right corner.
6. CONCLUSIONS
In this paper, an anisotropic point error model was presented for TLS derived point clouds. First the practical method for angular precision determination was described. Then, range precision was defined empirically as a function of sensor-to-object distance, incidence angle and surface reflectance. It was shown that this empirical function is capable of determining the range precision feasibly. Using these a-priori precision values, the variance and covariance propagation rule was employed for the computation of error ellipsoids for each point.
The proposed point error model was validated with practical experiments performed at real-world scenarios. Generated error ellipsoids show that the proposed error model works successfully
at real data sets. However, this model was tested with only one TLS model (FARO Focus X330). Because of this, in the future, these experiments will be performed with several other TLSs.
ACKNOWLEDGEMENTS
This research was funded by TUBITAK – The Scientific and
Technological Research Council of Turkey (Project ID: 115Y239) and by the Scientific Research Projects of Bülent Ecevit University (Project ID: 2015-47912266-01).
REFERENCES
Carrea, D., Abellan, A., Humair, F., Matasci, B., Derron, M.-H., Jaboyedoff, M., 2016. Correction of terrestrial LiDAR intensity channel using Oren–Nayar reflectance model: An application to lithological differentiation. ISPRS Journal of Photogrammetry and Remote Sensing, 113, pp. 17-29.
Chen, X., Hua, X., Zhang, G., Wu, H., Xuan, W., Li, M., 2015. Evaluating point cloud accuracy of static three-dimensional laser scanning based on point cloud error ellipsoid model. Journal of Applied Remote Sensing, 9(1), pp. 095991.
Grant, D., Bethel, J., Crawford, M., 2012. Point-to-plane registration of terrestrial laser scans. ISPRS Journal of Photogrammetry and Remote Sensing, 72, pp. 16-26.
Guehring, J., 2001. Reliable 3D surface acquisition, registration and validation using statistical error models, "Third International Conference on 3-D Digital Imaging and Modeling", Quebec, Canada, Proceedings., pp. 224-231, (28 May 2001).
Matei, B., Meer, P., 1999. Optimal rigid motion estimation and performance evaluation with bootstrap, "IEEE Computer Society Conference on Computer Vision and Pattern Recognition", Fort Collins, CO, USA (23 Jun. 1999).
Ohta, N., Kanatani, K., 1998. Optimal estimation of three-dimensional rotation and reliability evaluation, "5th European Conference on Computer Vision — ECCV'98", Freiburg, Germany, pp. 175-187.
Okatani, I.S., Deguchi, K., 2002. A Method for Fine Registration of Multiple View Range Images Considering the Measurement Error Properties. Computer Vision and Image Understanding, 87(1-3), pp. 66-77.
Sagawa, R., Oishi, T., Nakazawa, A., Kurazume, R., Ikeuchi, K., 2002. Iterative refinement of range images with anisotropic error distribution, "IEEE/RSJ International Conference on Intelligent Robots and Systems", 71, pp. 79-85.
Sagawa, R., Osawa, N., Echigo, T., Yagi, Y., 2005. Real Time 3D Environment Modeling for a Mobile Robot by Aligning Range Image Sequences, "British Nachine Vision Conference" Oxford, UK, pp. 330-339.
Sagawa, R., Osawa, N., Yagi, Y., 2006. A Probabilistic Method for Aligning and Merging Range Images with Anisotropic Error Distribution. In: Proceedings of the Third International Symposium on 3D Data Processing, Visualization, and Transmission (3DPVT'06) IEEE Computer Society, pp. 559-566.
Information Sciences, Melbourne, Australia, Vol. XXXIX, Part B5, pp. 601-606.
Soudarissanane, S., Lindenbergh, R., Menenti, M., Teunissen, P., 2011. Scanning geometry: Influencing factor on the quality of terrestrial laser scanning points. ISPRS Journal of Photogrammetry and Remote Sensing 66, pp. 389-399.