DRAWING FOR TRAFFIC MARKING USING BIDIRECTIONAL GRADIENT
-
BASED
DETECTION WITH MMS LIDAR INTENSITY
G. Takahashi a , H. Takeda a, K. Nakamura a
a Kokusai Kogyo Co., Ltd., Tokyo, Japan - (genki_takahashi, hiroshi1_takeda, kazuhiro_nakamura)@kk-grp.jp
Commission V, WG V/4
KEY WORDS: MMS, LiDAR, Intensity, Traffic marking, Mapping, the Hough transform
ABSTRACT:
Recently, the development of autonomous cars is accelerating on the integration of highly advanced artificial intelligence, which increases demand for a digital map with high accuracy. In particular, traffic markings are required to be precisely digitized since automatic driving utilizes them for position detection. To draw traffic markings, we benefit from Mobile Mapping Systems (MMS) equipped with high-density Laser imaging Detection and Ranging (LiDAR) scanners, which produces large amount of data efficiently with XYZ coordination along with reflectance intensity. Digitizing this data, on the other hand, conventionally has been dependent on human operation, which thus suffers from human errors, subjectivity errors, and low reproductivity. We have tackled this problem by means of automatic extraction of traffic marking, which partially accomplished to draw several traffic markings (G. Takahashi et al., 2014). The key idea of the method was extracting lines using the Hough transform strategically focused on changes in local reflection intensity along scan lines. However, it failed to extract traffic markings properly in a densely marked area, especially when local changing points are close each other.
In this paper, we propose a bidirectional gradient-based detection method where local changing points are labelled with plus or minus group. Given that each label corresponds to the boundary between traffic markings and background, we can identify traffic markings explicitly, meaning traffic lines are differentiated correctly by the proposed method. As such, our automated method, a highly accurate and non-human-operator-dependent method using bidirectional gradient-based algorithm, can successfully extract traffic lines composed of complex shapes such as a cross walk, resulting in minimizing cost and obtaining highly accurate results.
1. INTRODUCTION
It has been increasingly important to use Mobile Mapping Systems (MMS) sensor data in various applications since we can extract information around roads. Additionally, the demand for a digital map with high accuracy has increased given the development of autonomous cars on the integration of highly advanced artificial intelligence. Therefore, in many cases, we have recently started to draw traffic markings using MMS LiDAR data (Bisheng, 2012). The call for automated methods of extracting markings is at the same time increasing aimed for minimizing cost and obtaining highly accurate results. Apart from that, manual processing includes human errors, subjectivity errors, and low reproducibility, which involves more time-consuming tasks. Due to the lack of technology, however, we occasionally failed to use automatic methods in drawing traffic markings.
Based on these conditions, we set our ultimate goal as automatic drawing of all traffic markings using MMS LiDAR data. In such drawing work, it is necessary to draw the shape of traffic markings accurately. As the first phase for our ultimate goal, we, in this study, attempt to extract traffic markings such as the example shown in Figure 1.
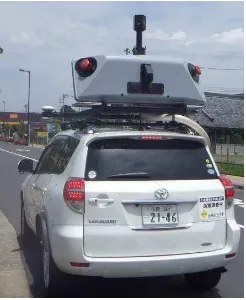
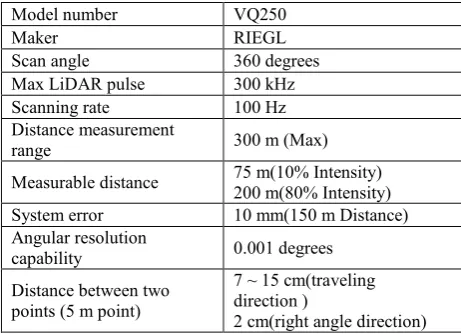
In this study, we use MX-8, which is a system developed by Trimble (Trimble websites, 2016). The exterior of MX-8 is shown in Figure 2, and one example of LiDAR data collected by MX-8 is shown in Figure 3. MX-8 has two VQ250 LiDAR scanners developed by RIEGL that can acquire X, Y, and Z data along with intensity information (RIEGL websites, 2012). The specifications of the LiDAR scanner are listed in Table 1.
Figure 1. Traffic marking in Japan
Figure 2. MX-8 exterior
Figure 3. Example of LiDAR data by MX-8
Model number VQ250
Maker RIEGL
Scan angle 360 degrees
Max LiDAR pulse 300 kHz
Scanning rate 100 Hz
Distance measurement
range 300 m (Max)
Measurable distance 75 m(10% Intensity) 200 m(80% Intensity) System error 10 mm(150 m Distance) Angular resolution
capability 0.001 degrees
Distance between two points (5 m point)
7 ~ 15 cm(traveling direction )
2 cm(right angle direction)
Table 1. Specification of the LiDAR scanner
2. ISSUES
There are several issues in extracting traffic markings as follows. Firstly, traffic markings include a lot of parallel / vertical sections such as the example of Figure 4. Considering the parallel / vertical rule, we expect that more proper results can be obtained.
Secondarily, some traffic markings consist of short sections. Figure 4 is an example of a traffic marking made of short sections. We can find that three short lines are placed straightly as shown in the red dashed rectangle in this figure. These two sections, placed at the upper part, has such short lengths that it is particularly difficult to extract as each line segment, so that we prefer to extract them as one straight line in this case. Note that it will additionally require us to detect the interior/exterior of the polygons composed of many straight lines.
Finally, although the Road Traffic Act defines the size of traffic markings in Japan (Road Traffic Act websites, 2009), there are a variety of traffic markings in terms of size and shape in practice. Therefore, the template matching method, which requires high accuracy and reflection of the state, is not suitable to extract traffic markings.
Figure 4. Example of short section and parallel / vertical section of traffic marking (sign of “Stop”)
3. METHODOLOGY
3.1 Flow chart
The flow of this study is shown in Figure 5. In this chapter, we describe our method step by step following the flow chart.
Figure 5. Flow chart of the whole processing The International Archives of the Photogrammetry, Remote Sensing and Spatial Information Sciences, Volume XLI-B5, 2016
3.2 Noise reduction through median filter
Since LiDAR point data includes a lot of noise, we have to remove points with noise using a proper method before applying the Hough transform. For this purpose, we use median filtering, which sets median to each pixel value in a two -dimensional neighborhood mesh (e.g., a 3 by 3 mesh). This allows us to remove spike noise such as LiDAR point data with noise. Note that we apply a median filter one-dimensionally for local changing points and a few points around them along scanning lines.
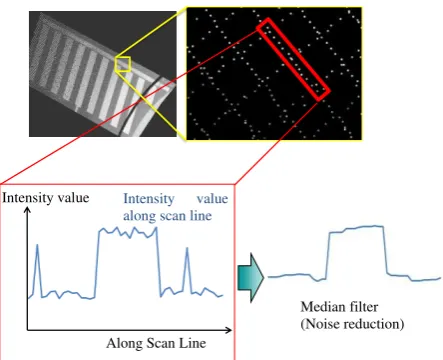
Figure 6 shows the noise reduction diagram along scanning lines using median filtering, where the red rectangle area on the upper right image shows a scanning line generated from LiDAR.
Figure 6. Diagram of noise reduction along scanning lines using median filtering (for image only)
The figure in the lower left schematically shows the intensity along with the scanning line as horizontal axis and the intensity value as vertical axis. The figure in the lower right shows the results filtered along the horizontal axis, where spike noises appear to be disappeared.
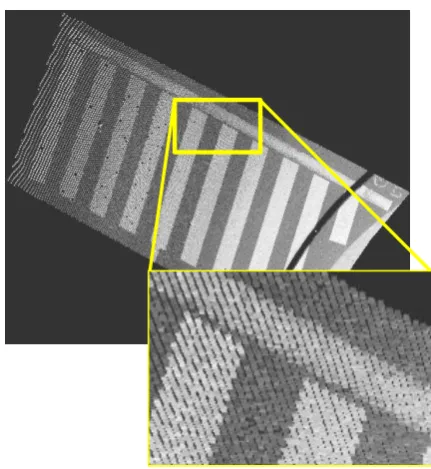
Figure 7 shows one example of noise reduction along scanning lines using median filtering, illustrating that spike noises are disappeared enough, and traffic markings such as a cross work are extracted properly.
(a) before filtering (b) after filtering
Figure 7. Noise reduction by median filtering
3.3 Extracting changing points on scan lines
Next, we extract traffic markings by means of local change detection as the LiDAR data is sequential. Details of this method are as follows. Note that Step1, 2 and 3 are the same methods as our previous study (Takahashi, 2014), and Step4 is the proposed one in this study:
(1) set a changing point where the difference of intensity between the targeted point and previous point is more than a certain threshold,
(2) set coordinates of the changing point between the targeted point and previous point,
(3) when the targeted point is far from the previous one, the detected changing point is discarded since it passes over the buffer polygon,
(4) assign plus/minus labels according to local changing points detected by bidirectional gradient search, which considers the gradient of intensity value as illustrated in Figure 8.
Figure8. Local changing point detection along scan lines from LiDAR intensity
3.4 Area scoping for wide processing area
We enclose the target area by an outer polygon to scope the wide area, for which we extracts changing points on scan lines as described at 3.3. Since this outer polygon should include some traffic markings, the polygon is distributed widely. Following processes deal with the area just inside the polygon.
3.5 Selection of suitable method of line extraction
The next step is to extract straight lines from local changing points. Some algorithms of extracting approximate straight lines have been reported such as a progressive approximate straight line method (Douglas and Peucker, 1973), RANSAC as RAndom Sample Consensus (Fischler, 1981), and the Hough transform (Chris, 2004) (Davies, 1988) (Paul, 1959) (Rabbani, 2005) (Richard, 1972).
In addition to the standard Hough transform, several variants have been studied such as the probabilistic Hough transform which can extract only line segments and the generalized Hough transform which can extract various shape like a shape of curve.
Although there are many algorithms as such, the best way which can handle any cases does not exist. Therefore, it is required to select a suitable method for each case. In this study, we select a method using the elimination method as follows:
- the progressive approximate straight line method: not suitable to extract lines from a point cloud since it eliminates vertices on a curved line
- RANSAC method: difficult to apply for traffic markings which include many parallel /vertical lines due to difficulties to define a limitation of parallel /vertical rules. In addition, it is said to perform unstably.
- the probabilistic Hough transform: only can extract line segments but not straight lines despite the fact that we attempt to extract traffic markings as lines as explained at 2.1(a). - the generalized Hough transform: versatile for various shape extractions, but not suitable for this study since it requires us to define a table of shape each by each, yet we have various types of traffic markings as mentioned in 2.3.
As such, we apply “bidirectional gradient-based detection” based on the standard Hough transform. This method is suitable to extract traffic markings in our method, because it can consider parallel / vertical rules and extract a traffic marking edge as a straight line.
3.6 Extracting lines using the Hough transform
As shown 2.1(e), we wish to convert LiDAR data into the traffic marking polygon with fewer vertices. In general, the Hough transform is used for extracting lines from a camera image. In this study, we expand the Hough transform to finding polygon vertices from LiDAR data and trying to extract approximate lines around a traffic marking as follows:
(1) define a plus rho-theta plane and minus rho-theta plane, and then vote for plus rho-theta plane on a concerned cell if the label of a local changing point is plus, and vice versa.
(2) extract an approximate line using cells of which value are the larger between plus rho-theta plane and minus rho -theta plane, meaning the approximate line has a plus or minus attribute depending on which plane it belongs to. (3) make a buffer polygon from the line and eliminate points
within the polygon. Note that we eliminate only plus points if the attribute of the line is plus, and vice versa. (4) repeat until the number of remaining points is less than
the threshold.
As mentioned in 2.1(b), traffic markings consist of a lot of parallel / vertical sections. Considering this characteristics, we regard the angle of the concerned line as being parallel/vertical if the angle is closed to the line angle acquired in previous steps, and extract the new one as an approximate line. We call this process as “angle alignment”, which is particularly effective for the case that traffic markings have less various angle types (e.g., a single rectangle).
On the other hand, the angle alignment can possibly return the angle which is far from the original one. Hence, it is desirable to use the angle alignment properly. That is, it is undesirable to use
the angle alignment for traffic marking extraction over a wide area as it includes various line angles, and desirable to use it over a narrow area.
3.7 Traffic marking polygons formation using extracted lines and LiDAR data
In order to create traffic marking polygons, we not only create polygons from extracted lines but also judge if the polygons belong to traffic markings or others using Lidar data, meaning we calculate the statistic value of LiDAR point intensity over points inside the polygon and detect if the polygon belongs to a traffic marking. We eventually form the traffic marking polygon by dissolving polygons which just belong to traffic markings. Note that we try both average and median as statistic value and select the appropriate one.
3.8 Problem of area scoping for wide area processing
There are two problems in case of extracting a traffic marking from a wide area. First, there is a possibility that an approximate line of a short section is not detected in the case that another during the operation of long section. Second, the larger the area is, the more we get tiny polygons. This is because a large execution area produces more lines, and more lines produce more polygons by crossing each other. Since these problems are caused by the fact that the execution area is large, we set a size limit over the area.
3.9 Re-extraction of the processing area and traffic markings
The process of area scoping and re-extract traffic marking is as follows:
(1) apply the progressive approximate straight line method proposed by Douglas and Peucker over the processing area and remove unnecessary points which do not affect the polygon shape even though they are removed, (2) extract an edge line composed of some sequential vertices, (3) create a buffer polygon as a boundary polygon of the edge
line,
(4) repeat the steps from 3.4 to 3.7 once more using the boundary polygon and finalize a traffic marking polygon in the end.
4. EXPERIMENT
Input LiDAR data is as follows: 1) single sensor,
2) single course,
3) people and cars are removed from data.
4.1 Comparison of proposed method to conventional method
In order to evaluate the proposed method which extracts local changing points considering the gradient direction, we compare it to the conventional method which does not consider the gradient direction. Figure 9 shows the targeted traffic markings, where it appears difficult to extract approximate lines since a cross walk and bicycle crossing zone are located very closely, in The International Archives of the Photogrammetry, Remote Sensing and Spatial Information Sciences, Volume XLI-B5, 2016
turn which means local changing points are placed closely. Therefore, we qualitatively evaluate the performance of approximate lines extraction there.
(a) Aerial (b) From MMS
Figure 9. Processing area photos
4.2 Comparison of wide area processing and narrow area processing
We extract traffic markings in a wide area as shown in Figure 10.
(a) Aerial (b) From MMS
Figure 10. Processing area photos
A hatched traffic marking represents “No entry by vehicles”. There is a slit on the one side of the marking, meaning the marking is separated from a road compartment line, and no slit on the other side, meaning it is connected to a road compartment line. Practically it is required to recognize this kind of slit in traffic marking drawing. We expect that the proposed method will perform well as the hatched traffic marking consists of parallel lines.
4.3 Comparison of extraction regarding statistic values
As mentioned in 3.7, we apply average and median as statistic values and select the appropriate one among them. We compare the extracted results with the statistic value. The target area is the same in 4.2 as shown in Figure 10.
5. RESULTS AND CONSIDERATION
5.1 Comparison of proposed method to conventional method
Figure 11 shows LiDAR data of traffic markings in processing area. Figure 12 and 13 show the results, where local changing points and approximate lines are extracted by the conventional method and proposed method. When we apply the proposed method, we can extract lines properly in the area where we cannot extract them with the conventional method as shown in
the red dashed rectangle in Figure 12, indicating the gradient based method used in our proposal is predominant.
Figure 11. LiDAR data of traffic markings in processing area
Figure 12. Result of local changing points and extracted lines by the conventional method
On the other hand, we extract an additional line with the proposal method as shown in the upper part since a cell size suitable for the Hough transform is much smaller than the one which satisfies the condition of the LiDAR point density. Although we can set a cell size properly in case of a narrow area, cannot select a proper constant value in a wide area due to the diversity of LiDAR point density. As such, we plan to find a method which changes the cell size locally.
Local changing point Extracted lines
Figure 13. Result of local changing points and extracted lines by the proposed method
5.2 Comparison of wide processing area to narrow area
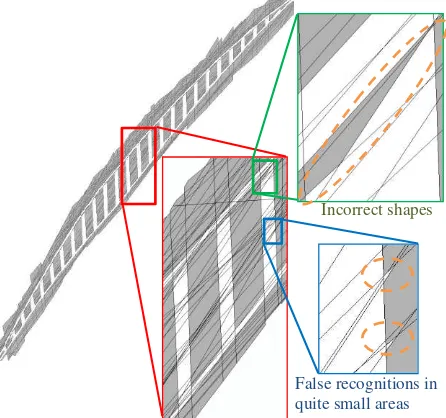
Figure 14 shows the result that approximate lines and areas of traffic markings with wide area processing.
Figure 14. Result of traffic marking extraction with wide area processing
Globally, traffic markings are extracted. In addition, gradual curve lines are also extracted even though only straight lines can be extracted in this method. This extraction of curve lines is granted because a curved line is considered as continuous straight line segments in our method.
On the other hand, there still remains some errors such as incorrect shapes and false recognition in quite small areas. These errors appear to be caused by wide area processing as
described in 3.8. Therefore, we processed again in a narrow area which is shown in the red rectangle zone in Figure 14 as described in 3.8. Figure 15 shows the result.
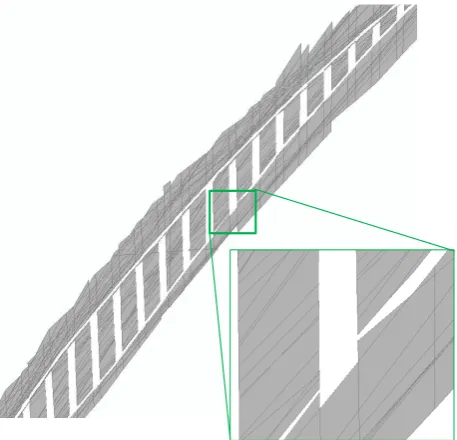
(a) Extracted lines (b) Extracted traffic markings
Figure 15. Result of traffic marking re-extraction with narrow area processing
Figure 15(a) shows the result of line extraction, in which a yerrow area is a limited area and blue/red lines are extraced lines with plus/minus attributes. Also, Figure 15(b) shows the result of traffic marking area extraction. Figure 14 illustrates that remaining errors, incorrect shapes and false recognitions in quite small areas observed with wide area processing in Figure 15, are disappeared. Additionally, we can see that the extracted traffic markings follow the actual shape much more, which shows that the re-extraction processing enables us to draw accurate traffic markings.
Table 2 shows the quantitative evaluation in units of area size, where each value describe the ratio of underestimate and overestimate of extracted area with respect to a wide area and a narrow area. Note that we drew true values by manual drawing.
Since the total area of a narrow area is smaller than one of a wide area, we gathered the adjacent traffic markings for a narrow processing area so as to be compatible with a wide area.
Scoping Underestimate Overestimate
Wide area 2.93% 3.36%
Narrow area 2.35% 3.52%
Table 2. Comparison of underestimate/overestimate areas between proposed method and manual drawing
This table evaluates the result quantitatively, which means the underestimate ratio of a narrow area is smaller than the one of a wide area so that the extraction quality increases. On the other hand, the overestimate ratio of a narrow area is higher than the one of a wide area since the proposed method is instable in terms of parameter settings. This problem is left for the future work.
5.3 Comparison of extraction regarding statistic values
Figure 16 and 17 describe the results of traffic markings extraction, where we apply average and median as statistic values of a wide area.
Local changing point (plus) Local changing point (minus) Extracted lines (plus) Extracted lines (minus)
Incorrect shapes
False recognitions in quite small areas
Figure 16. Traffic marking extraction calculated with average
Figure 17. Traffic marking extraction calculated with median
By means of comparison of Figure16 and 17, the result with median values appears better than the result with average values due to the fact that average is sensitive to outliers. That is, clipped LiDAR points sometimes include noise or other points from neighbor polygons along approximate lines, resulting they affect the statistic values, particularly average values. Therefore, it is suitable for our goal to utilize median values as statistic values.
Furthermore, it is expected to apply other type of statistic values for the future work. For instance, values of variances are expected to extract undetected approximate lines currently.
6. CONCLUSIONS
In this paper, we discussed automatic traffic marking extraction using MMS high-density LiDAR data. The conclusions are as
follows:
- we propose a bidirectional gradient-based detection method based on the standard Hough transform, through which we can identify traffic markings explicitly, meaning traffic lines are differentiated correctly by the proposed method,
- gradual curve lines are successfully extracted even though only straight lines can be extracted in this method since a curved line is considered as continuous straight line segments,
- the median value of LiDAR point intensity over points inside the polygon performs quite well to extract traffic marking properly.
7. FUTURE WORKS
Future works are as follows:
- find a method which changes the cell size locally as we failed to select a proper constant value in a wide area due to the diversity of LiDAR point density,
- find a method to set parameter values properly as a whole since it highly effects the result yet exclusively dependent on each case currently,
- apply other type of statistic values when we detect traffic marking polygons formation.
8. REFERENCES
Bishen. Y, et al., Automated extraction of road markings from mobile Lidar point clouds, Photogrammetric Engineering & Remote Sensing, Vol. 78(4), 2012, pp. 331-338.
Davies, E. R., 1988, Application of the generalized Hough transformation to corner detection, IEEE proceedings, Vol. 135, Pt. E, No.1.
G. Takahashi, et al., Automatic drawing for traffic marking with MMS LIDAR intensity, Photogrammetric Engineering & Remote Sensing, Volume II-5, 2014, ISPRS Technical Commission V Symposium, Riva del Garda, Italy, pp. 363-370.
J. Chris McGlone., 2004. Manual of Photogrammetry fifth edition, ASPRS, pp. 482-499.
Paul. H., “Machine analysis of bubble chamber pictures,” in Int. Conf. High Energy Accelerators and Instrumentation, 1959, pp. 554-556.
Rabbani, T. et al., 2005, Efficient Hough transform for automatic detection of cylinders in point clouds, ISPRS Proceedings. Workshop Laser scanning 2005, pp. 60-65.
Richard O. D. et al., 1972, Use of the Hough transformation to detect Lines and curves in pictures, Graphics and Image Processing, 15(1), pp. 11-15.
RIEGL websites, http://www.riegl
-japan.co.jp/product/pdf_1/DataSheet_VQ-250_rund_25-09 -2012.pdf (15 April. 2016 Access)
Road traffic act websites, http://law.e -The International Archives of the Photogrammetry, Remote Sensing and Spatial Information Sciences, Volume XLI-B5, 2016
gov.go.jp/htmldata/S35/S35HO105.html (15 April. 2016 Access)
Trimble websites, http://www.trimble.com/imaging/Trimble -MX8.aspx (15 April. 2016 Access)